Table of Contents
10+ Chart Templates in Google Docs
There are people who are in charge of collecting data on a particular subject matter and then must present what he/she has learned to those who are interested in the information. Those who are assigned the task may want to do the presentation with something that can visually stimulate the audience.

The one thing that is able to do just that would be a chart. This article will teach you all that you need to know in regards to how you can create your own chart in Google Docs.
Elements of a Chart
You’ll want to make sure that the people who see your chart actually understand what it is that it’s trying to show them. The way to guarantee that they do is by implementing all of the basic elements that a chart needs. They are as follows:
1. Title: Whatever chart you decide to create will need its own title. The purpose of the title is to give viewers of the chart an idea as to what information they will be presented with and its purpose. You’ll have to make sure that the title you come up with is directly related to the chart’s intended purpose. For example, let’s say that you’re creating one that will show rising or declining growth of a business. A good title for something like that would be “Business Growth Chart” or perhaps “Corporate Growth Chart“.
2. Bars, Lines, Tables: Once you have gathered all of the data you need, you’ll want to figure out a way to present it to an audience that will make it easier for them to understand. That’s why you need to decide how you want the data to be visually represented in the chart. Do you think that you should use bar graphs to make your point? Or maybe a pie chart would be the best option? Think about which one will easily get the point across to the viewers.
3. Dates: Certain charts may require that you put in dates; this is especially true for those which are business-related. Whenever you are required to place any, you want to make sure that you share the complete date. That way, viewers can better understand the period of time that you’re trying to point out to them. Also, this helps show if the data you’re presenting is either updated or obsolete.
10+ Chart Templates in Google Docs
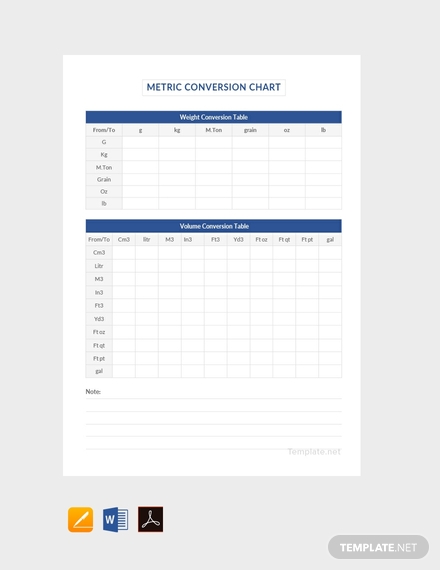
Metric Conversion Chart Template
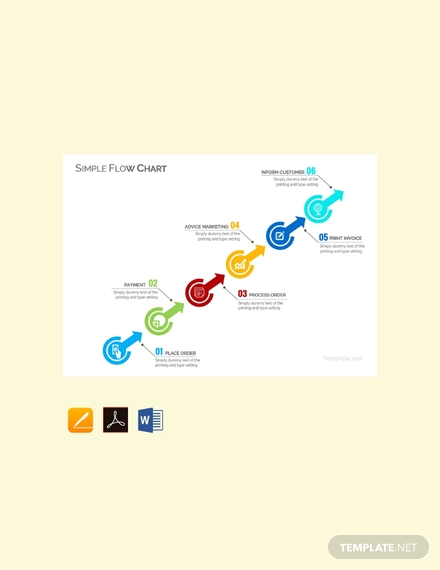
Free Simple Flow Chart Template
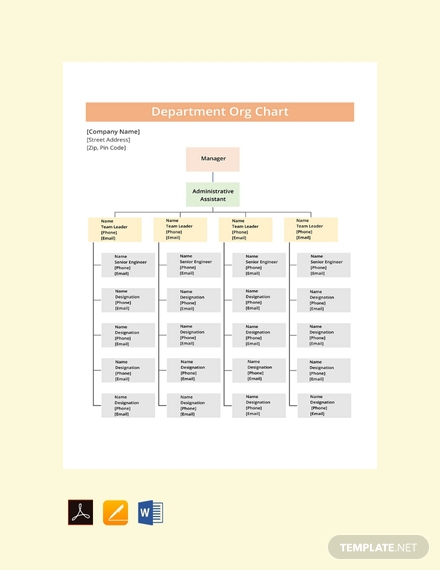
Department Org Chart Template
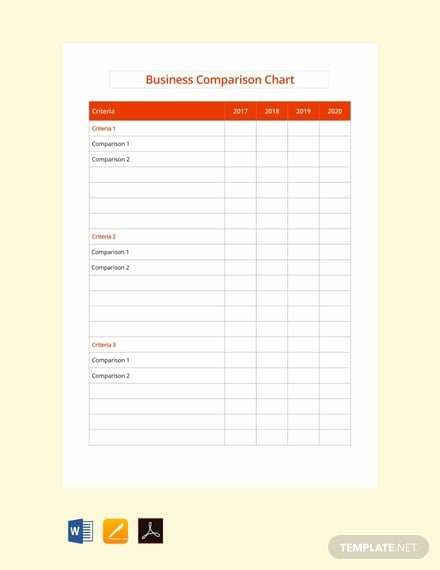
Business Comparison Chart Example
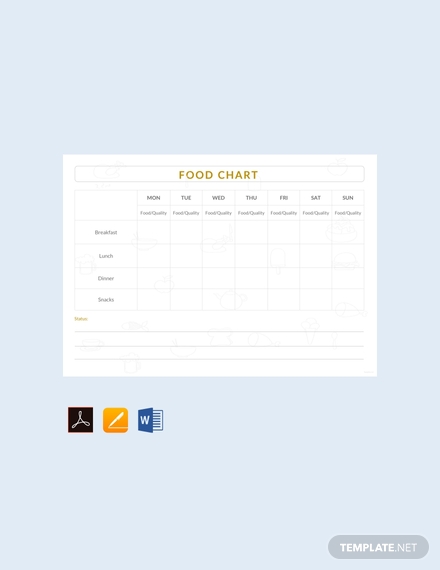
Free Food Chart Template
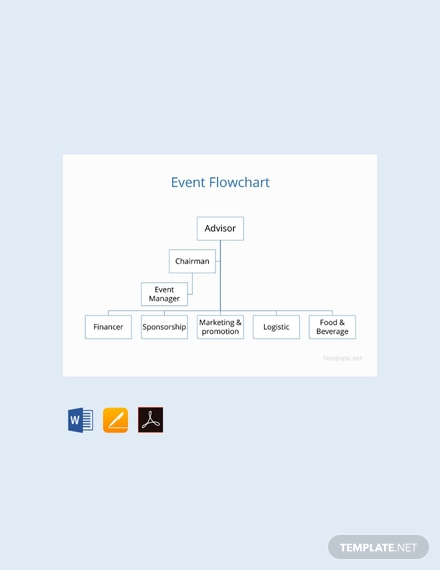
Free Event Flowchart Example
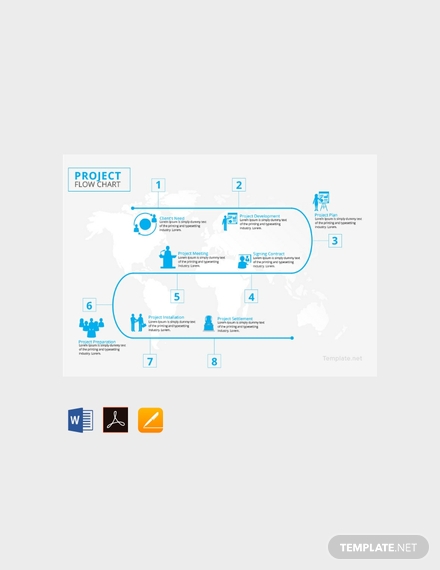
Project Flow Chart Template
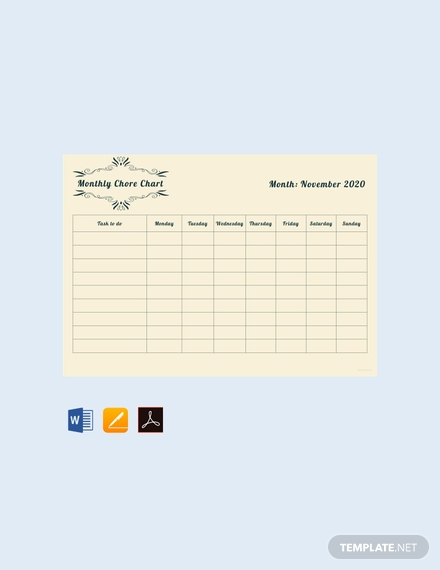
Free Monthly Chore Chart Template
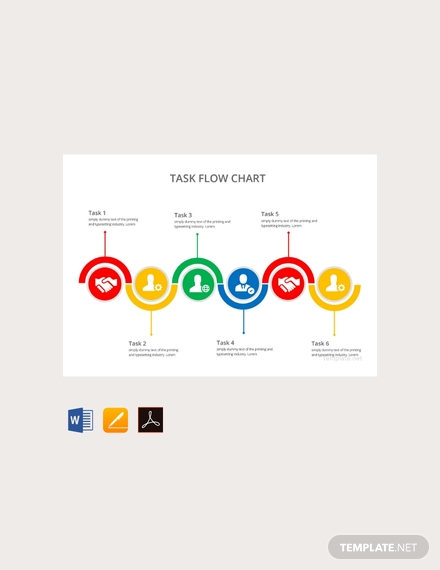
Task Flow Chart Sample
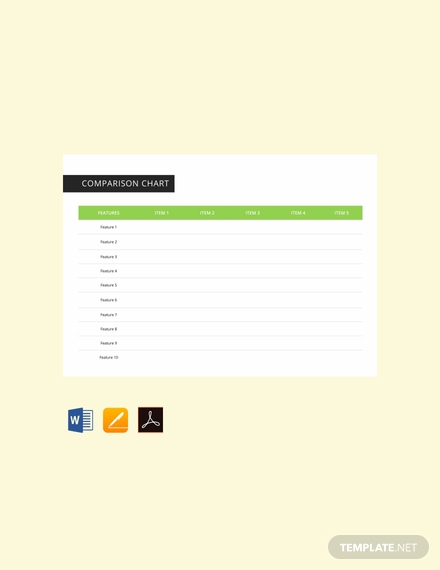
Blank Comparison Chart Template
How to Make a Chart
Now that you know what should go in a chart, next is for you to actually make one. Here are the steps that you will need to follow:
1. Open Google Docs: When making a chart in Google Docs, you’ll first have to learn how to access it. This can be done by simply opening up your Google account. If you don’t already have one, then you can make it by going to Google’s main site and registering there. Once you have it, then here’s what you’ll need to do:
- Open your Gmail account.
- Search for the Docs icon and click it.
- Select “Blank” if you want to start from scratch or you may go through the template gallery until you can find the right chart template.
Know that the same process can also be used to create other types of documents via Google Docs.
2. Make your chart: Next is for you to finally start putting in the information that the chart needs. Here’s what you’ll need to do:
- Know the audience who you’ll be presenting the data to: As soon as you start on the chart’s creation, you’ll need to better understand the people that will be viewing your chart. This should be able to help you in terms of knowing the best way to show them the data that you’ve gathered, as well as what it is that you have to show them.
- Search for different sources: If you want to make sure that you’ve compiled accurate information into the chart, then you’ll want to look at more than just one source of data. That way, you can compare all of them to ensure that you’ll only be presenting facts.
Tips for Making a Chart
- Make sure that the data is relevant and that there are no inconsistencies: This is especially important for business-related ones such as Sales Excess Charts as they require nothing but accurate figures. Always check to see that you didn’t put in any data that are obsolete and that there are no mistakes in terms of the information you’ve collected and shared.
- Color code the information you’re going to share: The best way of ensuring that people can easily interpret what it is that chart is trying to tell them is by assigning colors to different pieces of information. For example, the different bars in a bar graph each have different colors as each bar is assigned to its own particular subject matter. This will make it so much easier for people to understand what it is that the chart is trying to show them.
Types of Professional Charts
- Vertical bar charts: Best used for comparing data that is grouped by different categories.
- Horizontal bar charts: Similar to a vertical bar chart but is only used when the number of categories is large or if each category has long labels that need to be displayed.
- Pie charts: The easiest to understand. Used for understanding the parts of a whole.
- Funnel charts: Often used to represent how something moves through different stages in a process
- Bullet charts: Used typically to display performance data relative to a goal.
Should you wish to learn about other types of charts, then you may go through our site to find articles with the different chart templates that can give you the information you need.
Chart FAQs
Is Google Docs the easiest way to make a chart?
Using Google Docs is one of the quicker ways of creating one, but there are other programs that are just as easy to use; a few good examples would be Microsoft Word or even Microsoft Excel. It’s all a matter of personal preference as to which one you’ll end up choosing.
What kind of chart should I use?
This will depend entirely on how you wish to present whatever information you’ve collected. Check out the list of the different types of charts to give you an idea as to how you should share whatever data you wish to present.
Be sure to properly go through this article so that you’ll be able to make any type of chart document whenever you need to.


