Free Performance Dashboard Outline HR
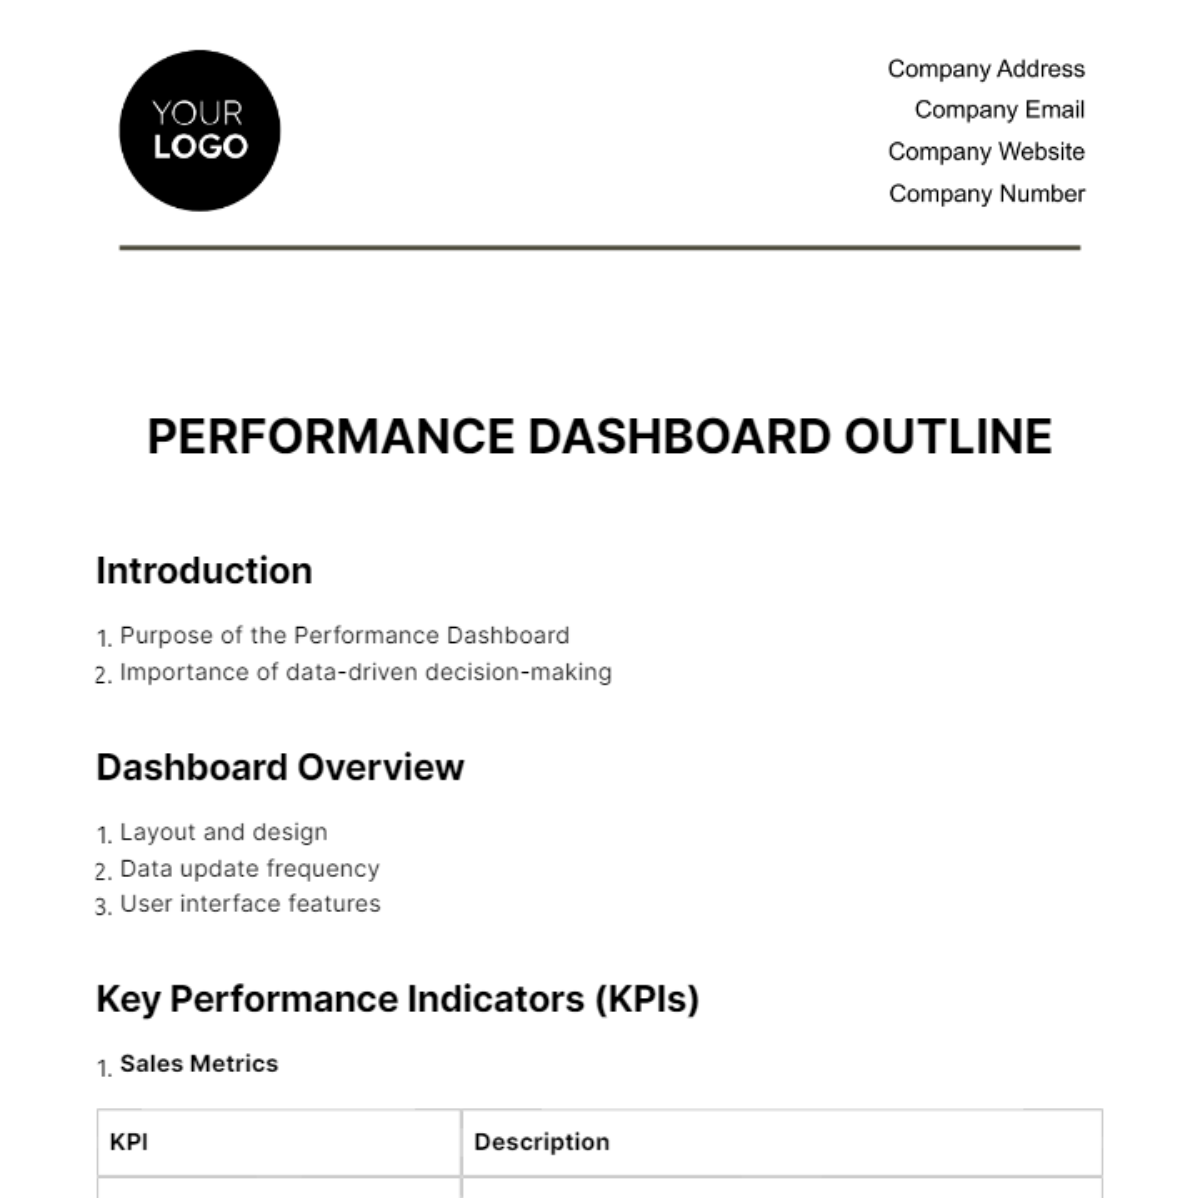
Introduction
Purpose of the Performance Dashboard
Importance of data-driven decision-making
Dashboard Overview
Layout and design
Data update frequency
User interface features
Key Performance Indicators (KPIs)
Sales Metrics
KPI | Description |
Monthly Sales | Total sales revenue for the month |
New Client Acquisition | Number of new clients added |
Client Retention Rate | Percentage of clients from the previous month |
Marketing Metrics
KPI | Description |
Campaigns Launched | Number of marketing campaigns initiated |
Social Media Engagement | Percentage of followers interacting with posts |
Website Traffic | Number of unique visitors to the company website |
Operations Metrics
KPI | Description |
Inventory Levels | Number of products in stock |
Operational Efficiency | The ratio of output to operational costs |
Product Return Rate | Percentage of sold products returned |
HR Metrics
KPI | Description |
New Hires | Number of employees onboarded in the month |
Employee Turnover | Number of employees who left the company |
Average Training Hours | Average hours of training provided to employees |
Finanacial Metrics
KPI | Description |
Monthly Revenue | Total earnings before expenses |
Operating Costs | Total expenditure on business operations |
Net Profit Margin | The ratio of net profit to total revenue |
Dashboard Functionalities
Interactive Elements: Dropdowns, sliders, and date pickers
Data Filters: By date, department, or specific metric
Data Visualization: Graphs, pie charts, and histograms
Notification System: Alerts for significant changes or anomalies
Conclusion
Reiteration of the significance of the Performance Dashboard
Encouragement for frequent usage and engagement
Annexure
Glossary of terms
Data source references
User manual for dashboard navigation
- 100% Customizable, free editor
- Access 1 Million+ Templates, photo’s & graphics
- Download or share as a template
- Click and replace photos, graphics, text, backgrounds
- Resize, crop, AI write & more
- Access advanced editor
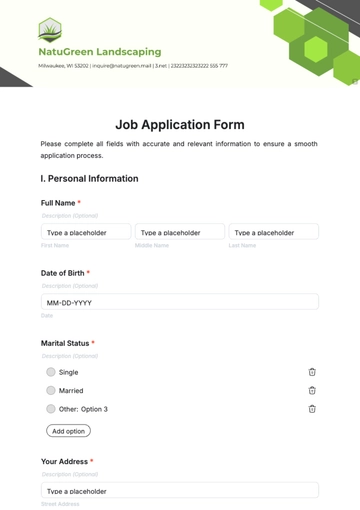
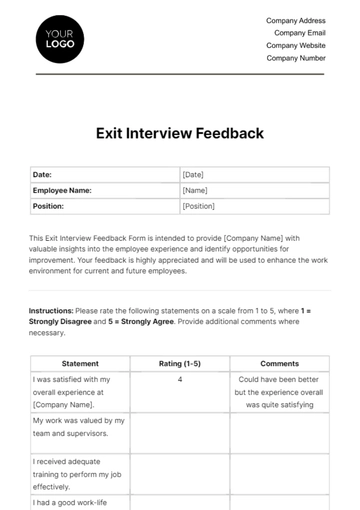
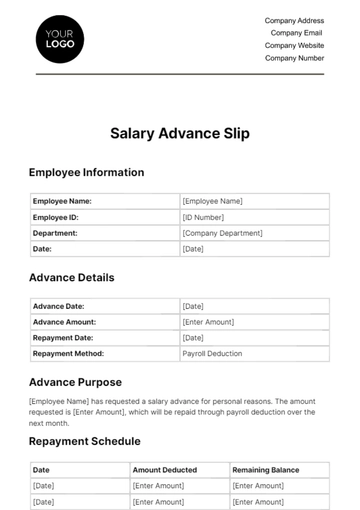
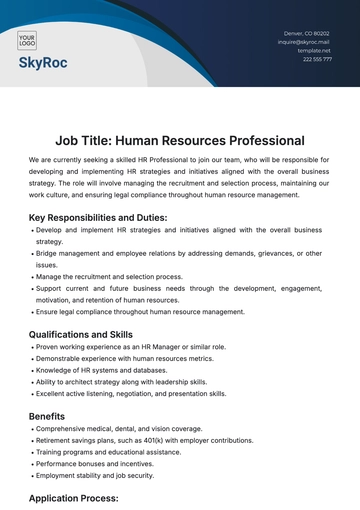
Visualize success in your mind and make it a reality! Our Performance Dashboard Outline HR Template offers a blueprint for creating a dynamic display of performance metrics. With an emphasis on clarity and actionable insights, it's the dashboard every manager needs for quick, informed decisions. Download our fully customizable template today!


