
I. Introduction
Welcome to the [Your Company Name] Sales Reporting Software User Guide! This guide is tailored to equip sales professionals with the essential knowledge and tools to harness the full potential of our cutting-edge reporting software.
Our reporting software serves as a powerful ally, designed to streamline your reporting tasks and enhance your decision-making capabilities. With its intuitive interface and robust features, you can effortlessly generate comprehensive sales reports, visualize data, and collaborate seamlessly with your team.
A. Target Audience and Prerequisites
This guide is specifically crafted for sales professionals within [Your Company Name]. Whether you're a seasoned sales expert or just starting in the field, this user-friendly guide will assist you in utilizing our reporting software effectively. To begin your journey, ensure you have an active [Your Company Name] account. Let's embark on the path of data-driven sales excellence together!
II. Getting Started
Before you dive into the world of sales reporting with [Your Company Name] Reporting Software, it's essential to ensure that your system meets the necessary requirements and to understand how to install and configure the software. This section provides a comprehensive guide to get you started seamlessly.
A. System Requirements
To guarantee smooth operation of the software, please ensure that your system complies with the following requirements:
Hardware: A modern computer or laptop with at least a dual-core processor, 8GB of RAM, and a high-resolution display.
Operating System: Windows 10 or later, macOS 10.13 or later, or a compatible Linux distribution.
Web Browser: The latest version of Google Chrome, Mozilla Firefox, Microsoft Edge, or Safari.
Internet Connection: A stable broadband internet connection is required for real-time data updates and collaboration features.
B. Installation Instructions
Download
1.1. Visit [Your Company Website] and log in to your [Your Company Name] account using your credentials.
1.2. Locate the software download section, select the appropriate version for your operating system, and click 'Download.'
Installation
2.1. Once the download is complete, run the installer.
2.2. Follow the on-screen instructions to install the software, accepting the default settings unless you have specific preferences.
Configuration
3.1. After installation, launch the software and log in with your [Your Company Name] account credentials.
3.2. If necessary, customize your user settings and preferences to match your workflow.
Congratulations! You are now ready to harness the full potential of [Your Company Name] Reporting Software for streamlined sales reporting and data-driven decision-making.
III. User Account Setup
This section will guide you through the steps of setting up your account and managing your password for added security.
A. Creating Your Account
Visit [Your Company Website] and click on the "Sign Up" or "Create Account" button.
Fill out the registration form with your details, including your full name, email address, and any other required information.
Choose a strong and unique password. We recommend a combination of letters, numbers, and special characters for maximum security.
Review our Terms of Service and Privacy Policy, and if you agree, check the box to confirm your acceptance.
Click "Create Account" to complete the registration process.
B. Password Management and Security
To maintain the security of your account, we recommend regularly updating your password.
Use a unique password for your [Your Company Name] account, separate from passwords used for other services.
Avoid sharing your password with anyone and be cautious of phishing attempts.
If you forget your password, click the "Forgot Password" link on the login page to initiate the password reset process.
For additional security, enable two-factor authentication (2FA) in your account settings.
IV. Dashboard Overview
The [Your Company Name] Reporting Software's dashboard is your central hub for accessing and visualizing critical sales data. In this section, we'll explore the main elements of the dashboard, including its layout, widgets, charts, and data panels.
A. Dashboard Interface
Our dashboard is designed for simplicity and efficiency. Upon logging in, you'll find a clean and intuitive interface with the following key components:
Navigation Menu | Located on the left side, it provides access to various sections of the software, including reports, data sources, and settings. |
Header | At the top, it displays your user profile, notifications, and quick access to account settings. |
Main Content Area | This central space showcases widgets, charts, and data panels to present your sales data visually. |
B. Widgets, Charts, and Data Panels
Widgets | These are customizable data summaries that offer at-a-glance insights. You can select and arrange widgets based on your preferences, such as Sales Totals, Top Performers, or Sales Funnel. |
Charts | Our software provides a wide range of chart types, including bar charts, pie charts, and line graphs, allowing you to visualize data trends and comparisons. |
Data Panels | These panels offer detailed information, often in tabular form, allowing you to drill down into specific data points and explore data in-depth. |
V. Data Import and Integration
In this section, we'll guide you through the process of importing and integrating your data, along with the supported file formats and data connection methods.
A. Importing Data
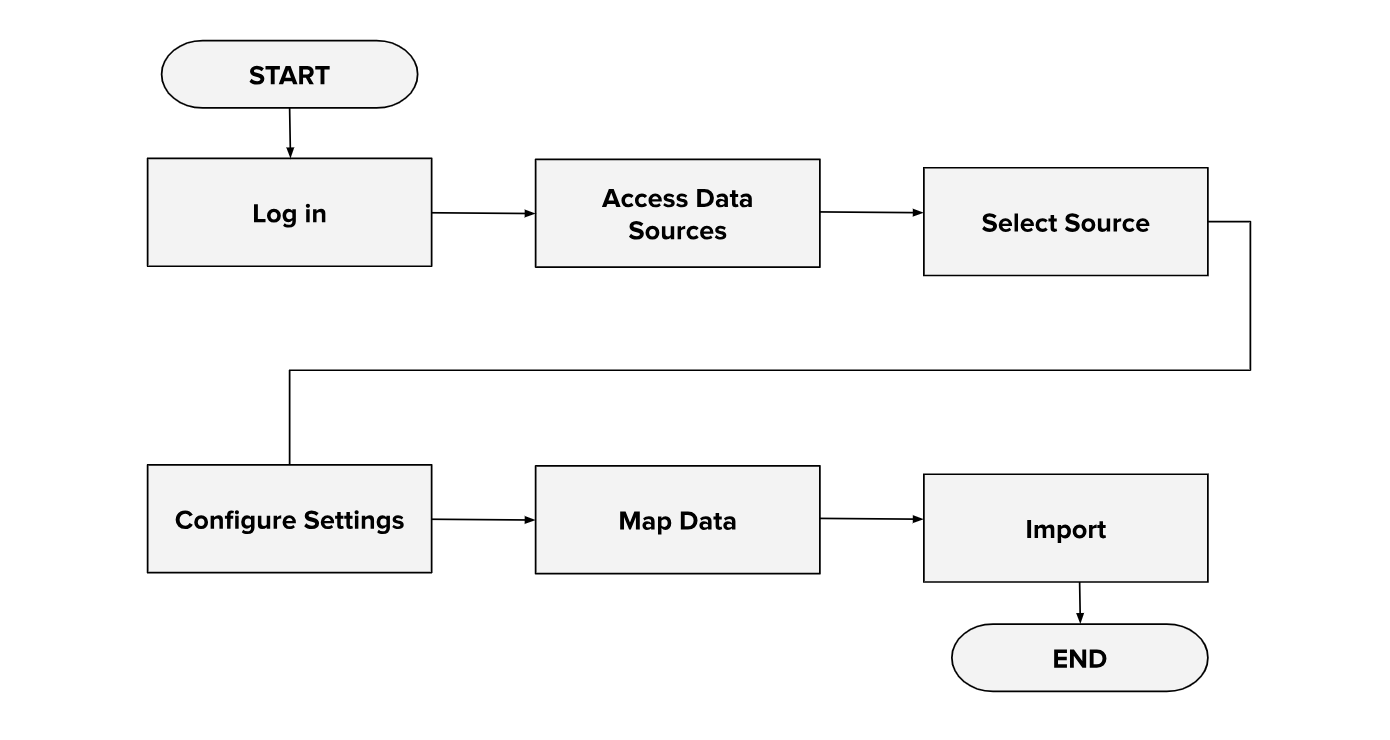
B. Supported File Formats and Data Connection Methods
File Formats: [Your Company Name] Reporting Software supports common file formats, including CSV, Excel (XLSX), and JSON. You can directly upload these files for data import.
Data Connection: For more dynamic data integration, you can connect your software to databases like SQL, MySQL, or cloud services such as Google Sheets or Salesforce. Use the provided connectors or follow the setup instructions for specific integrations.
VI. Creating Reports
Creating and customizing reports is at the heart of efficient sales analysis with [Your Company Name] Reporting Software. In this section, we'll walk you through the steps to create, customize, and save reports, along with valuable examples and best practices.
A. Creating Reports
Access Report Builder: From the main menu, select "Create Report" or a similar option to enter the Report Builder interface.
Choose Data Source: Select the data source you want to use for your report.
Select Fields: Pick the relevant data fields to include in your report, such as sales figures, customer names, or product categories.
Design Layout: Customize the layout by adding charts, tables, or graphs to present your data visually.
Apply Filters: Apply filters to focus on specific data subsets, like a particular time frame or geographic region.
B. Customization and Saving
Customize report aesthetics with color schemes and fonts.
Add headers, footers, and logos for branding.
Save your report template for future use.
C. Best Practices
Define clear objectives for your report to ensure it aligns with your sales goals.
Keep reports concise and organized for easy consumption.
Use graphical elements for visual appeal and clarity.
Regularly update and review reports to track performance and identify trends.
VII. Data Visualization
[Your Company Name] Reporting Software offers a variety of powerful data visualization tools to help you transform complex sales data into meaningful insights. Here's an overview of the available options and some tips for effective chart and graph creation:
A. Visualization Tools and Options
Our software provides a wide range of tools, including bar charts, line graphs, pie charts, scatter plots, and heat maps. You can select the most suitable visualization method for your data type and reporting objectives.
B. Creating Effective Visuals
Choose the right chart type for your data, ensuring it effectively conveys the message.
Keep visuals simple and uncluttered to enhance readability.
Use labels, legends, and titles to provide context and clarity.
Utilize color coding and highlighting to emphasize key data points.
Incorporate interactive elements for deeper data exploration.
VIII. Filtering and Sorting Data
Efficiently filtering and sorting data is crucial for pinpointing specific information and gaining deeper insights within [Your Company Name] Reporting Software. Here's how to master these functions:
A. Basic Filtering and Sorting
Select Data Set: Access the data set or report you want to work with.
Filter Data: Apply filters by selecting criteria such as date ranges, product categories, or specific sales reps. This narrows down the data displayed.
Sort Data: Arrange data in ascending or descending order based on a chosen field (e.g., sales volume or date).
B. Advanced Filtering (if applicable)
Utilize advanced filter options, such as conditional filtering, which allows you to create complex rules for data selection.
Explore interactive dashboards for dynamic filtering, providing real-time updates as criteria change.
IX. Sharing and Collaboration
Effortless sharing and collaboration within [Your Company Name] Reporting Software enhance teamwork and decision-making. Here's a guide on how to share reports and collaborate effectively:
A. Sharing Reports
Sharing reports within [Your Company Name] Reporting Software is a straightforward process that fosters collaboration. Here are the six steps to get you started:

B. Permission Settings and Sharing Options
View-Only: Recipients can view the report but not make changes.
Edit Access: Allows collaborators to make modifications and updates.
Link Sharing: Share a link to the report with others, controlling their level of access.
Email Notifications: Opt to receive notifications when collaborators make changes.
X. Troubleshooting and Support
A. Common Issues and Solutions
In your journey with [Your Company Name] Reporting Software, you may encounter occasional challenges. To assist you, we've compiled a table of common issues and solutions, along with essential support contact information below:
Common Issue | Solution |
Login difficulties | Reset your password or contact IT for assistance. |
Data not updating | Check your internet connection and refresh the page. |
Report errors | Review data sources, filters, and chart configurations. |
Missing data | Ensure data sources are correctly imported and integrated. |
Slow performance | Close unnecessary browser tabs and clear cache. |
B. Support Contact Information
Customer Support Email | [Your Company Email] |
IT Helpdesk Phone | [Your Company Number] |
Free Sales User Guide for New Reporting Software
 Describe to generate with AI in seconds
- Edit & Download in pdf, Word, Google Docs, Zoho writer, Notion, Wordpress
Say hello to this customizable Sales User Guide for New Reporting Software Template from Template.net designed to help your customers get the most out of your reporting software! It’s editable, allowing you to tailor it to your software’s features! Save time with our intuitive AI Editor Tool! Access right away!
You may also like


- Sales Report
- Daily Report
- Project Report
- Business Report
- Weekly Report
- Incident Report
- Annual Report
- Report Layout
- Report Design
- Progress Report
- Marketing Report
- Company Report
- Monthly Report
- Audit Report
- Status Report
- School Report
- Reports Hr
- Management Report
- Project Status Report
- Handover Report
- Health And Safety Report
- Restaurant Report
- Construction Report
- Research Report
- Evaluation Report
- Investigation Report
- Employee Report
- Advertising Report
- Weekly Status Report
- Project Management Report
- Finance Report
- Service Report
- Technical Report
- Meeting Report
- Quarterly Report
- Inspection Report
- Medical Report
- Test Report
- Summary Report
- Inventory Report
- Valuation Report
- Operations Report
- Payroll Report
- Training Report
- Job Report
- Case Report
- Performance Report
- Board Report
- Internal Audit Report
- Student Report
- Monthly Management Report
- Small Business Report
- Accident Report
- Call Center Report
- Activity Report
- IT and Software Report
- Internship Report
- Visit Report
- Product Report
- Book Report
- Property Report
- Recruitment Report
- University Report
- Event Report
- SEO Report
- Conference Report
- Narrative Report
- Nursing Home Report
- Preschool Report
- Call Report
- Customer Report
- Employee Incident Report
- Accomplishment Report
- Social Media Report
- Work From Home Report
- Security Report
- Damage Report
- Quality Report
- Internal Report
- Nurse Report
- Real Estate Report
- Hotel Report
- Equipment Report
- Credit Report
- Field Report
- Non Profit Report
- Maintenance Report
- News Report
- Survey Report
- Executive Report
- Law Firm Report
- Advertising Agency Report
- Interior Design Report
- Travel Agency Report
- Stock Report
- Salon Report
- Bug Report
- Workplace Report
- Action Report
- Investor Report
- Cleaning Services Report
- Consulting Report
- Freelancer Report
- Site Visit Report
- Trip Report
- Classroom Observation Report
- Vehicle Report
- Final Report
- Software Report