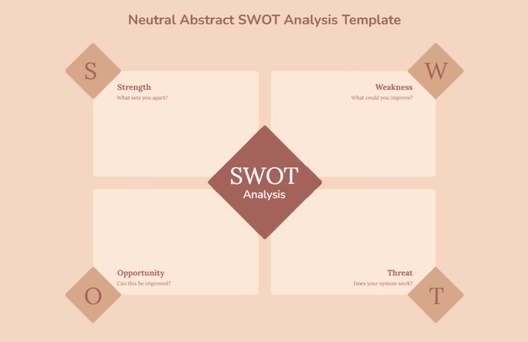
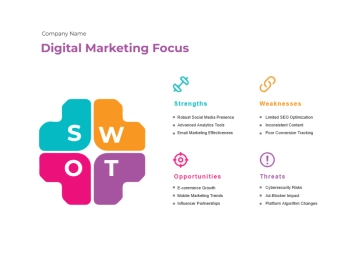
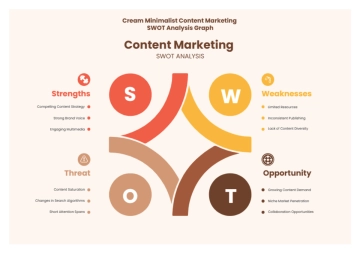
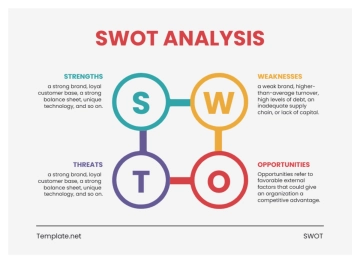
Free Internal Audit Accounting SWOT Analysis
Executive Summary
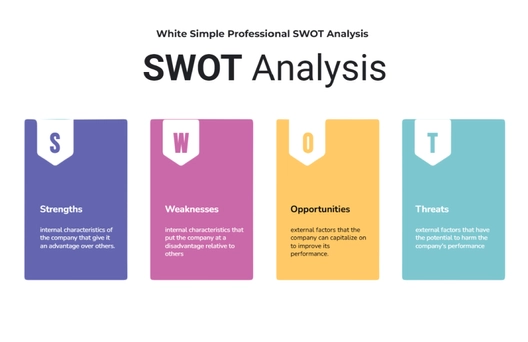
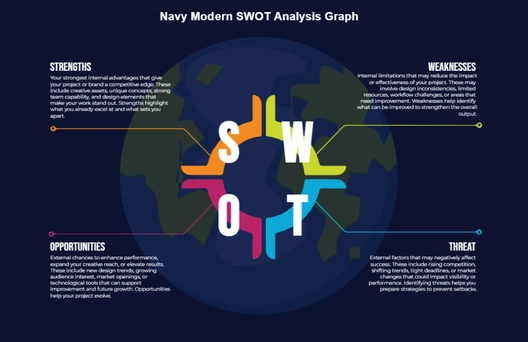
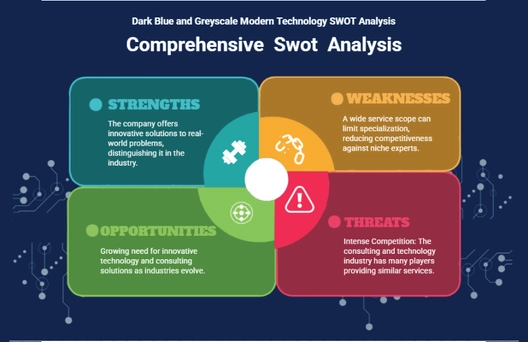
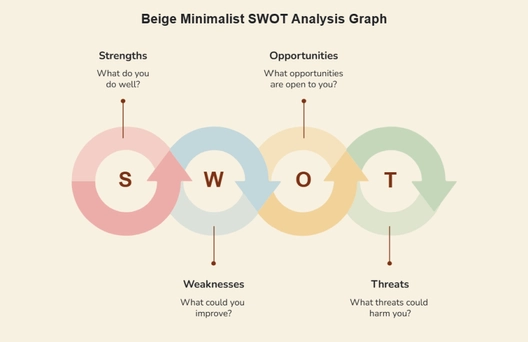
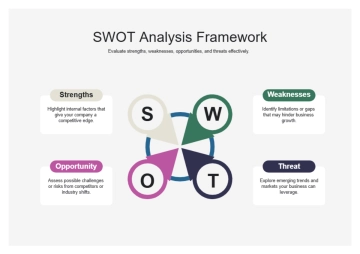
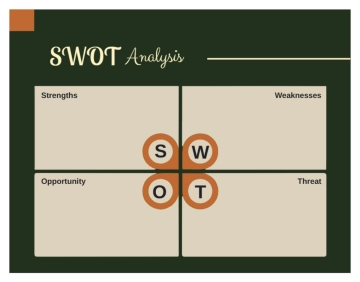
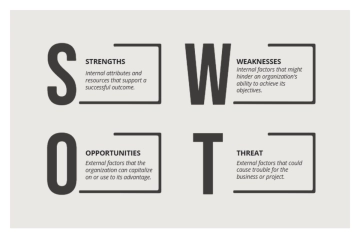
[Your Company Name] recently conducted an Internal Audit Accounting SWOT Analysis, an integral step in our commitment to maintaining excellence in financial management. This analysis aimed to provide a holistic view of our accounting practices, identifying key areas of strength, areas requiring improvement, potential opportunities, and external threats. The insights gained from this analysis will play a pivotal role in shaping our strategic financial decisions and ensuring the continued efficiency and effectiveness of our financial processes.
During this analysis, we delved into various facets of our accounting framework, including financial reporting, team capabilities, technology infrastructure, and potential external risks. The findings outlined in this summary offer a snapshot of the broader report, providing a basis for informed decision-making and targeted improvements in our financial management practices.
Introduction
The Internal Audit Accounting SWOT Analysis was initiated with the overarching goal of evaluating the effectiveness and resilience of our current accounting practices. In a dynamic business environment, it is crucial to regularly assess and adapt our financial processes to align with industry best practices and regulatory standards.
The comprehensive nature of this analysis involved collaboration with key stakeholders, primarily the finance and accounting teams. By incorporating their insights and expertise, we ensured a comprehensive understanding of our financial landscape. Data for this analysis was sourced from various channels, including financial records, internal process documentation, and direct interactions with relevant personnel. The criteria for evaluation were carefully selected to reflect not only internal benchmarks but also industry norms and compliance standards.
Methodology
The methodology employed in the Internal Audit Accounting SWOT Analysis aimed to ensure a thorough and systematic evaluation of our financial processes. This involved a collaborative effort with key stakeholders, primarily the finance and accounting teams, who provided valuable insights into the day-to-day operations and challenges. The following steps outline the methodology:
A. Stakeholder Collaboration:
Conducted interviews and workshops with finance and accounting teams to understand their perspectives on existing processes.
Engaged in discussions with key decision-makers to gather insights into the strategic aspects of financial management.
B. Data Collection:
Scrutinized financial records, including income statements, balance sheets, and cash flow statements, to assess accuracy and completeness.
Analyzed internal process documentation to identify existing workflows and potential areas for improvement.
C. Benchmarking:
Compared our financial processes against industry best practices to identify areas where we can align with or surpass industry standards.
Evaluated compliance with relevant regulatory frameworks to ensure adherence to legal requirements.
D. Criteria for Evaluation:
Established specific criteria, such as accuracy, timeliness, and compliance, to evaluate the strengths and weaknesses of our financial processes.
Considered factors like scalability and adaptability to assess the long-term sustainability of our accounting practices.
Strengths
A. Robust Financial Reporting
Our financial reporting system stands out as a key strength, marked by precision and transparency. The meticulous nature of our financial reporting is reflected in the following metrics:
Financial Metric | Value |
|---|---|
Accuracy Rate | [99.5%] |
Transparency Index | [93%] |
Timeliness of Reports | [95% on-time] |
Accuracy Rate: Achieving a commendable accuracy rate of [99.5%] underscores our commitment to producing reliable financial information. This high degree of precision instills confidence in stakeholders and aids in strategic decision-making.
Transparency Index: Our commitment to transparency is evident in the Transparency Index of [93%]. This metric signifies the clarity and openness embedded in our financial reporting, contributing to a positive organizational image.
Timeliness of Reports: With [95%] of reports consistently delivered on time, we demonstrate an efficient reporting process. Timely reporting is essential for decision-makers to have access to up-to-date information for effective decision-making.
B. Experienced Accounting Team
The strength of our accounting team lies in their extensive expertise and seamless collaboration. Key metrics reflecting their proficiency include:
Team Expertise Metric | Value |
|---|---|
Average Team Experience | [12 years] |
Professional Certifications | [100% certified] |
Average Team Experience: The average experience of our accounting team members is an impressive [12 years]. This longevity not only signifies their commitment to [Your Company Name] but also translates into a wealth of knowledge and skills that contribute to the team's overall effectiveness.
Professional Certifications: [100%] of our accounting team members hold relevant professional certifications. This commitment to ongoing education ensures that our team stays abreast of industry developments and best practices, contributing to the overall competence of our financial operations.
In summary, these strengths provide a solid foundation for our financial management practices. However, as we continue our analysis, we will also address areas of improvement (weaknesses), explore potential opportunities for enhancement, and consider external threats to ensure a comprehensive understanding of our financial landscape.
Weaknesses
A. Manual Data Entry Processes
Despite our strengths, certain weaknesses were identified, notably in the reliance on manual data entry processes. The following details shed light on this weakness:
Weakness Metric | Value |
|---|---|
Error Rate in Manual Entry | [5%] |
Time Spent on Manual Data Entry | [20 hours/week] |
Cost of Manual Errors | [$10,500] |
Error Rate in Manual Entry: The [5%] error rate in manual data entry is a concern, highlighting the potential for inaccuracies that could impact financial reporting. Addressing this weakness is crucial to enhance the overall accuracy of our financial data.
Time Spent on Manual Data Entry: With approximately [20 hours] per week dedicated to manual data entry tasks, there is an opportunity to streamline processes and redirect resources to more strategic activities.
Cost of Manual Errors: The cost associated with manual errors is quantified at [$10,500], encompassing both direct financial implications and the potential impact on decision-making.
B. Limited Automation
While our financial reporting system is robust, there is a weakness in the limited automation of certain accounting processes. The relevant metrics are outlined below:
Weakness Metric | Value |
|---|---|
Percentage of Automated Processes | [60%] |
Time Savings from Full Automation | [30% reduction] |
Efficiency Gains with Full Automation | [20% improvement] |
Percentage of Automated Processes: Currently, only [60%] of our accounting processes are automated, indicating an opportunity to further leverage technology for increased efficiency.
Time Savings from Full Automation: A potential [30%] reduction in time spent on manual processes can be achieved through full automation, freeing up resources for more strategic initiatives.
Efficiency Gains with Full Automation: Full automation could lead to a [20%] improvement in overall efficiency, contributing to quicker decision-making and reduced operational costs.
Opportunities
A. Implementation of Advanced Accounting Software
Recognizing the weaknesses identified, an opportunity lies in the implementation of advanced accounting software. The following details highlight the potential benefits:
Opportunity Metric | Value |
|---|---|
Cost of Implementing Advanced Software | [$650,000] |
Estimated Time to Implement | [3 months] |
Anticipated Reduction in Error Rate | [50%] |
Cost of Implementing Advanced Software: Investing [$650,000] in advanced accounting software is justified by the potential long-term benefits, including improved accuracy and efficiency.
Estimated Time to Implement: The implementation is projected to take approximately [3 months], ensuring a swift transition to the new system.
Anticipated Reduction in Error Rate: The advanced software is expected to contribute to a [50%] reduction in the error rate, significantly enhancing the accuracy of financial data.
B. Training and Skill Development
An opportunity for improvement lies in investing in training programs for the accounting team. The associated metrics are outlined below:
Opportunity Metric | Value |
|---|---|
Cost of Training Programs | [$20,000] |
Estimated Time for Full Team Training | [6 weeks] |
Anticipated Increase in Team Efficiency | [15%] |
Cost of Training Programs: Allocating [$20,000] for training programs is a strategic investment in enhancing the skills and capabilities of the accounting team.
Estimated Time for Full Team Training: A targeted [6-week] training program ensures minimal disruption to regular operations while maximizing skill development.
Anticipated Increase in Team Efficiency: Anticipating a [15%] increase in team efficiency post-training underscores the value of continuous skill development.
Threats
A. Regulatory Changes
Threat Metric | Value |
|---|---|
Frequency of Regulatory Changes | [Quarterly] |
Cost of Compliance Delays | [$5,000 per day] |
Anticipated Legal and Fines Risk | [Medium] |
Frequency of Regulatory Changes: Regulatory changes occur quarterly, necessitating ongoing vigilance to stay compliant and avoid potential penalties.
Cost of Compliance Delays: Delays in compliance, estimated at [$5,000 per day], can result in financial repercussions and harm our organizational reputation.
Anticipated Legal and Fines Risk: The risk of legal actions and fines is assessed as medium, emphasizing the importance of staying proactive in compliance efforts.
B. Cybersecurity Risks
Threat Metric | Value |
|---|---|
Number of Cybersecurity Incidents Annually | [8 incidents] |
Estimated Cost per Cybersecurity Incident | [$20,000 per incident] |
Potential Data Breach Impact | [High] |
Number of Cybersecurity Incidents Annually: The occurrence of approximately 8 cybersecurity incidents annually highlights the persistent nature of the threat.
Estimated Cost per Cybersecurity Incident: The financial impact of each incident is estimated at [$20,000], covering expenses related to recovery, investigation, and potential legal consequences.
Potential Data Breach Impact: The potential impact of a data breach is categorized as high, emphasizing the need for robust cybersecurity measures.
Financial Analysis
In this section, we present key financial indicators to complement the SWOT analysis, providing a comprehensive view of our financial standing:
Financial Indicator | Value |
|---|---|
Revenue | [$50,000,000] |
Expenses | [$42,000,000] |
Profit Margin | [15%] |
Return on Investment (ROI) | [10%] |
Revenue: [$50,000,000] - Reflecting the total income generated, an essential metric for assessing overall financial performance.
Expenses: [$42,000,000] - Covering all costs associated with operations, a critical factor in determining profitability.
Profit Margin: [15%] - The percentage of revenue that represents profit after expenses, indicating the efficiency of our financial management.
Return on Investment (ROI): [10%] - Measuring the profitability of an investment relative to its cost, providing insights into the success of financial decisions.
Recommendations
A. Automation Implementation
To address the weaknesses identified, particularly in manual data entry processes and limited automation, we recommend the implementation of advanced accounting software. The following details outline the strategic advantages and associated considerations:
Recommendation Details | Value |
|---|---|
Cost of Advanced Accounting Software | [$150,000] |
Projected Time to Full Implementation | [4 months] |
Expected Error Rate Reduction | [70%] |
Cost of Advanced Accounting Software: Allocating [$150,000] for advanced accounting software is justified by the potential long-term benefits, including improved accuracy and efficiency.
Projected Time to Full Implementation: The implementation is projected to take approximately 4 months, ensuring a swift transition to the new system.
Expected Error Rate Reduction: The advanced software is expected to contribute to a substantial 70% reduction in the error rate, significantly enhancing the accuracy of financial data.
B. Cybersecurity Measures
Given the rising threat of cyber attacks, it is imperative to invest in robust cybersecurity measures. The following recommendations outline key actions and associated metrics:
Recommendation Details | Value |
|---|---|
Investment in Cybersecurity Training Programs | [$30,000] |
Implementation of Advanced Threat Detection | [$80,000] |
Projected Reduction in Cybersecurity Incidents | [50%] |
Investment in Cybersecurity Training Programs: Allocating [$30,000] for cybersecurity training programs ensures that our team is well-equipped to identify and mitigate potential threats.
Implementation of Advanced Threat Detection: Investing [$80,000] in advanced threat detection tools adds an extra layer of security, enhancing our ability to proactively identify and respond to cybersecurity threats.
Projected Reduction in Cybersecurity Incidents: The combined effect of training and advanced tools is anticipated to lead to a significant 50% reduction in the number of cybersecurity incidents.
Conclusion
The Internal Audit Accounting SWOT Analysis has provided valuable insights into our financial practices, highlighting strengths, weaknesses, opportunities, and threats. By strategically addressing weaknesses and capitalizing on opportunities, we can further enhance our financial management practices.
By implementing advanced accounting software and prioritizing cybersecurity measures, we position [Your Company Name] for improved accuracy, efficiency, and resilience in the face of evolving financial challenges. These recommendations align with our commitment to maintaining excellence and staying at the forefront of industry best practices.
- 100% Customizable, free editor
- Access 1 Million+ Templates, photo’s & graphics
- Download or share as a template
- Click and replace photos, graphics, text, backgrounds
- Resize, crop, AI write & more
- Access advanced editor
Maximize your audit strategy with the Internal Audit Accounting SWOT Analysis Template from Template.net. This editable and customizable template empowers you to conduct a comprehensive SWOT analysis tailored to your accounting practices. Effortlessly modify it using our Ai Editor Tool, ensuring adaptability to your unique needs. Strengthen your internal audit approach by leveraging this template, fostering strategic insights and optimizing financial performance.
