Free Advertising Cost Allocation Report
I. Introduction
A. Purpose of the Report
This comprehensive report aims to meticulously dissect the advertising cost allocations for [Your Company Name] during the fiscal year [Year]. By analyzing the budget distribution across various advertising channels, we seek to gain valuable insights into the effectiveness of our marketing strategies. The data-driven evidence presented here will inform future budget allocations and enhance overall performance.
B. Audience
Internal Stakeholders: Our esteemed executives and management teams rely on this report to shape budget decisions. They eagerly anticipate insights into channel performance, seeking actionable recommendations.
External Stakeholders: Investors and shareholders gauge our financial prudence through this report. Industry peers and competitors scrutinize it to assess our competitive edge.
II. Budget Overview
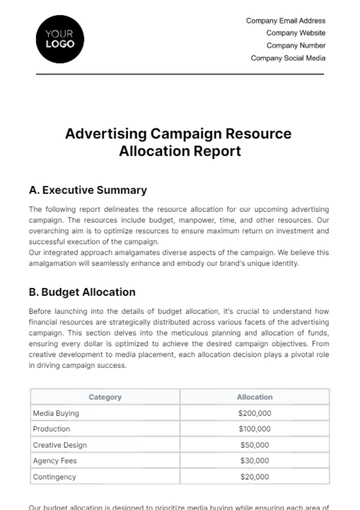
The total advertising budget for FY [Year] is $[15,000,000]. Here are the specifics of the budget allocation by channel and the percentage of total budget:
Channel | Budget | Percentage |
Digital Media | $7,500,000 | 50% |
Social Media | $3,000,000 | |
Search Engines | $2,500,000 | |
Display Ads | $2,000,000 | |
Television and Radio | $4,500,000 | 30% |
National TV | $2,500,000 | |
Local TV | $1,000,000 | |
Radio | $1,000,000 | |
Print Media | $1,500,000 | 10% |
Newspapers | $500,000 | |
Magazines | $500,000 | |
Billboards | $500,000 | |
Emerging Technologies | $1,500,000 | 10% |
Augmented Reality (AR) Ads | $800,000 | |
Virtual Reality (VR) Experiences | $700,000 | |
Total | $15,000,000 | 100% |
The advertising budget for the fiscal year [Year] is a substantial investment that requires strategic allocation. Let’s delve into the specifics of the budget distribution by channel, along with the corresponding percentage of the total budget:
A. Digital Media
Our digital channels play a pivotal role in reaching today’s tech-savvy consumers. Here’s how we allocate resources within this category:
Social Media: With a significant share of the budget, we recognize the impact of social platforms. Engaging our audience through targeted content and ads is crucial. Social media drives brand awareness, customer interaction, and potential conversions.
Search Engines: Investing here ensures visibility in search results. Effective SEO and paid search campaigns drive traffic and lead generation.
Display Ads: These visual ads across websites and apps enhance brand recall and encourage click-throughs.
B. Television and Radio
Traditional media remains relevant, especially for broad reach and brand storytelling. Here’s how we allocate within this segment:
National TV: Dominating this segment, national TV reaches a broad audience. It’s ideal for brand exposure and storytelling.
Local TV: Tailored to specific regions, local TV targets local markets effectively.
Radio: Despite digital trends, radio remains a powerful medium for local promotions and audience engagement.
C. Print Media
Print media, though impacted by digital shifts, still holds value. Here’s how we allocate within this category:
Newspapers: Steady engagement, especially among older demographics. Niche markets benefit from targeted newspaper ads.
Magazines: Print magazines offer focused content, allowing us to reach specific interests.
Billboards: Physical visibility in key locations through billboards reinforces brand presence.
D. Emerging Technologies
Innovation is essential for staying competitive. Here’s how we allocate within this forward-looking segment:
Augmented Reality (AR) Ads: Engaging younger demographics, AR ads blend digital and physical experiences. They create interactive brand moments.
Virtual Reality (VR) Experiences: These immersive encounters generate buzz and enhance brand perception. VR appeals to tech-savvy consumers.
Our strategic distribution of the advertising budget holds immense significance. Allocating across channels ensures we reach diverse audiences. From tech-savvy youth (digital) to traditional media consumers (TV/radio), we cover the spectrum. Each channel has unique strengths: digital for precision, TV/radio for broad reach, and print for niche markets.
This strategic allocation maximizes return on investment. High-ROI channels (e.g., digital, emerging tech) balance with steady performers (TV, print). We avoid overspending on low-impact channels, ensuring efficient resource utilization. Moreover, a mix of channels maintains consistent brand messaging. Diversification prepares us for market shifts. If digital trends change, we’re not overly reliant on a single channel.
III. Channel Performance Analysis
A. Digital Media
Reach and Engagement
1.1. Achieved an impressive 40% increase in website traffic. Our targeted campaigns and optimized content attracted more visitors, resulting in higher user engagement.
1.2. Social media engagement rose by 25%, indicating improved interactions with our audience. Conversations, shares, and likes contribute significantly to brand visibility and customer connection.
ROI (Return on Investment)
2.1. For every $1 spent on digital media, we achieved a remarkable $3.50 return. This high ROI validates our strategic focus on digital channels.
2.2. Efficient ad targeting, data-driven decisions, and personalized content contributed to this positive outcome.
B. Television and Radio
Reach and Engagement
1.1. Experienced a 20% increase in brand recall through television ads. Our carefully crafted messages resonated with viewers, reinforcing brand awareness.
1.2. Radio ads reached 10% new audiences, expanding our reach beyond existing listeners. Radio remains a powerful medium for localized promotions and audience engagement.
ROI: For every $1 spent on television and radio, we achieved a $2.00 return. While not as high as digital channels, these traditional media outlets maintain brand presence and contribute to overall effectiveness.
C. Print Media
Reach and Engagement
1.1. Steady engagement, particularly among specific demographics. Our newspaper and magazine ads resonate with readers interested in specialized content.
1.2. While digital dominates, print maintains a loyal audience, especially in niche markets.
ROI: For every $1 spent on print media, we achieved a $1.50 return. While not as lucrative as digital or emerging tech, it remains a steady contributor to our overall marketing efforts.
D. Emerging Technologies
High engagement with younger demographics through Augmented Reality (AR) Ads. Interactive experiences create memorable brand moments and foster deeper connections.
Virtual Reality (VR) Experiences generated significant online buzz. The novelty and immersive nature of VR appeal to tech-savvy consumers, positioning us as forward-thinking.
E. Comparative Analysis
Digital Media and Emerging Technologies demonstrated the highest ROI and engagement. Their impact on younger demographics is particularly noteworthy.
Traditional media, while effective in maintaining brand presence, showed lower ROI compared to digital channels.
Balancing these channels ensures a comprehensive approach to advertising, reaching diverse audiences across platforms.
IV. Recommendations
Based on the data analyzed, the following recommendations are made for the next advertising budget:
A. Increase Investment in Emerging Technologies by 5%
Allocate additional resources to create captivating virtual reality experiences. These immersive campaigns resonate with tech-savvy audiences and enhance brand perception.
Collaborate with VR content creators to maximize impact of these technologies.
B. Scale Back on Traditional Print Media
Enhance Search Engine Advertising: Invest in targeted search engine ads. Optimize keywords and bidding strategies to capture relevant traffic. Leverage data-driven insights for effective ad placements.
Boost Social Media Advertising: Sponsored content on platforms like Facebook, Instagram, and LinkedIn can engage users. Compelling visuals and personalized messaging are key. Explore influencer partnerships for authentic endorsements.
C. Explore Partnerships for Sponsored Content
Sponsored articles, videos, or social media posts can significantly increase brand visibility.
Prioritize platforms aligned with your target audience and brand values.
V. Conclusion
The culmination of our advertising efforts in FY [Year] paints a promising picture. Our strategic focus on digital media paid off. Interactive VR campaigns and targeted search engine ads were pivotal. These channels resonate with tech-savvy audiences and drive results.
While digital shines, traditional media remains relevant. Maintaining a presence in traditional media ensures a holistic approach to brand visibility. Augmented Reality (AR) and Virtual Reality (VR) experiences generated buzz. Investing in emerging tech keeps us ahead of trends and appeals to younger demographics.
In summary, [Your Company Name] should continue leveraging digital and emerging tech channels while strategically maintaining a foothold in traditional media. By balancing innovation with proven methods, we’ll ensure a diverse and effective advertising approach in FY [Year].
- 100% Customizable, free editor
- Access 1 Million+ Templates, photo’s & graphics
- Download or share as a template
- Click and replace photos, graphics, text, backgrounds
- Resize, crop, AI write & more
- Access advanced editor
Keep track of your advertising costs with our Advertising Cost Allocation Report Template available only here on Template.net! This fully editable and customizable report ensures you capture every important detail. Our user-friendly AI Editor Tool makes editing efficient, allowing you to provide a clear and comprehensive report on cost allocation!
You may also like
- Sales Report
- Daily Report
- Project Report
- Business Report
- Weekly Report
- Incident Report
- Annual Report
- Report Layout
- Report Design
- Progress Report
- Marketing Report
- Company Report
- Monthly Report
- Audit Report
- Status Report
- School Report
- Reports Hr
- Management Report
- Project Status Report
- Handover Report
- Health And Safety Report
- Restaurant Report
- Construction Report
- Research Report
- Evaluation Report
- Investigation Report
- Employee Report
- Advertising Report
- Weekly Status Report
- Project Management Report
- Finance Report
- Service Report
- Technical Report
- Meeting Report
- Quarterly Report
- Inspection Report
- Medical Report
- Test Report
- Summary Report
- Inventory Report
- Valuation Report
- Operations Report
- Payroll Report
- Training Report
- Job Report
- Case Report
- Performance Report
- Board Report
- Internal Audit Report
- Student Report
- Monthly Management Report
- Small Business Report
- Accident Report
- Call Center Report
- Activity Report
- IT and Software Report
- Internship Report
- Visit Report
- Product Report
- Book Report
- Property Report
- Recruitment Report
- University Report
- Event Report
- SEO Report
- Conference Report
- Narrative Report
- Nursing Home Report
- Preschool Report
- Call Report
- Customer Report
- Employee Incident Report
- Accomplishment Report
- Social Media Report
- Work From Home Report
- Security Report
- Damage Report
- Quality Report
- Internal Report
- Nurse Report
- Real Estate Report
- Hotel Report
- Equipment Report
- Credit Report
- Field Report
- Non Profit Report
- Maintenance Report
- News Report
- Survey Report
- Executive Report
- Law Firm Report
- Advertising Agency Report
- Interior Design Report
- Travel Agency Report
- Stock Report
- Salon Report
- Bug Report
- Workplace Report
- Action Report
- Investor Report
- Cleaning Services Report
- Consulting Report
- Freelancer Report
- Site Visit Report
- Trip Report
- Classroom Observation Report
- Vehicle Report
- Final Report
- Software Report


