Free Travel Agency Financial Evaluation
Date: [Date of Evaluation]
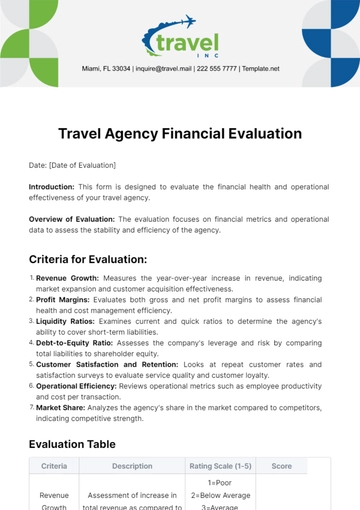
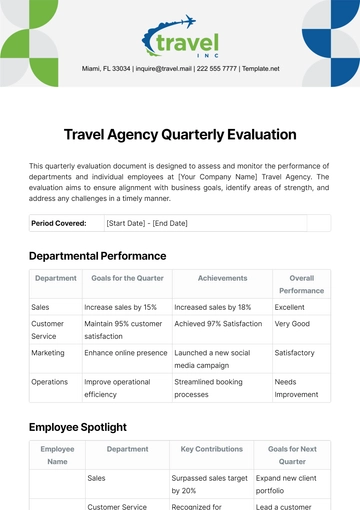
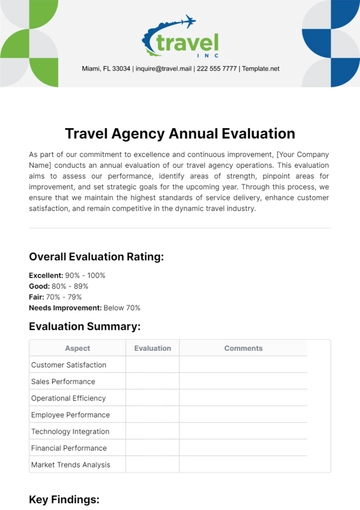
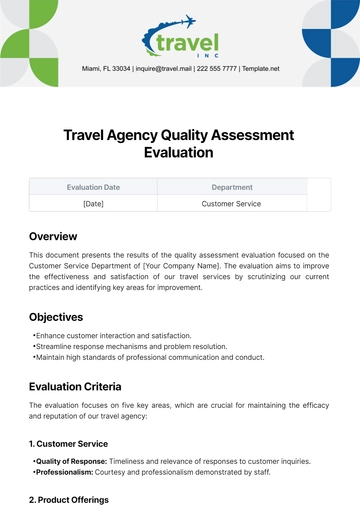
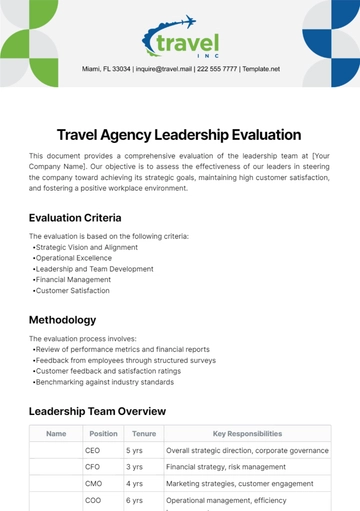
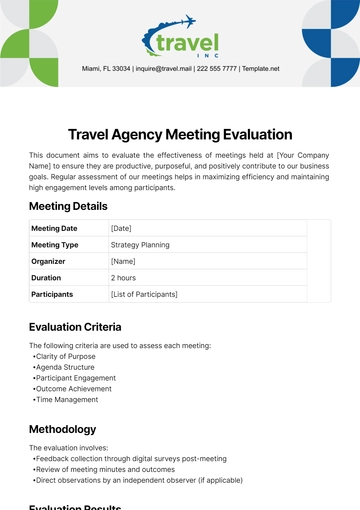
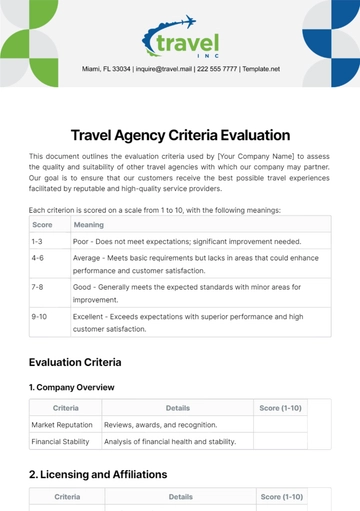
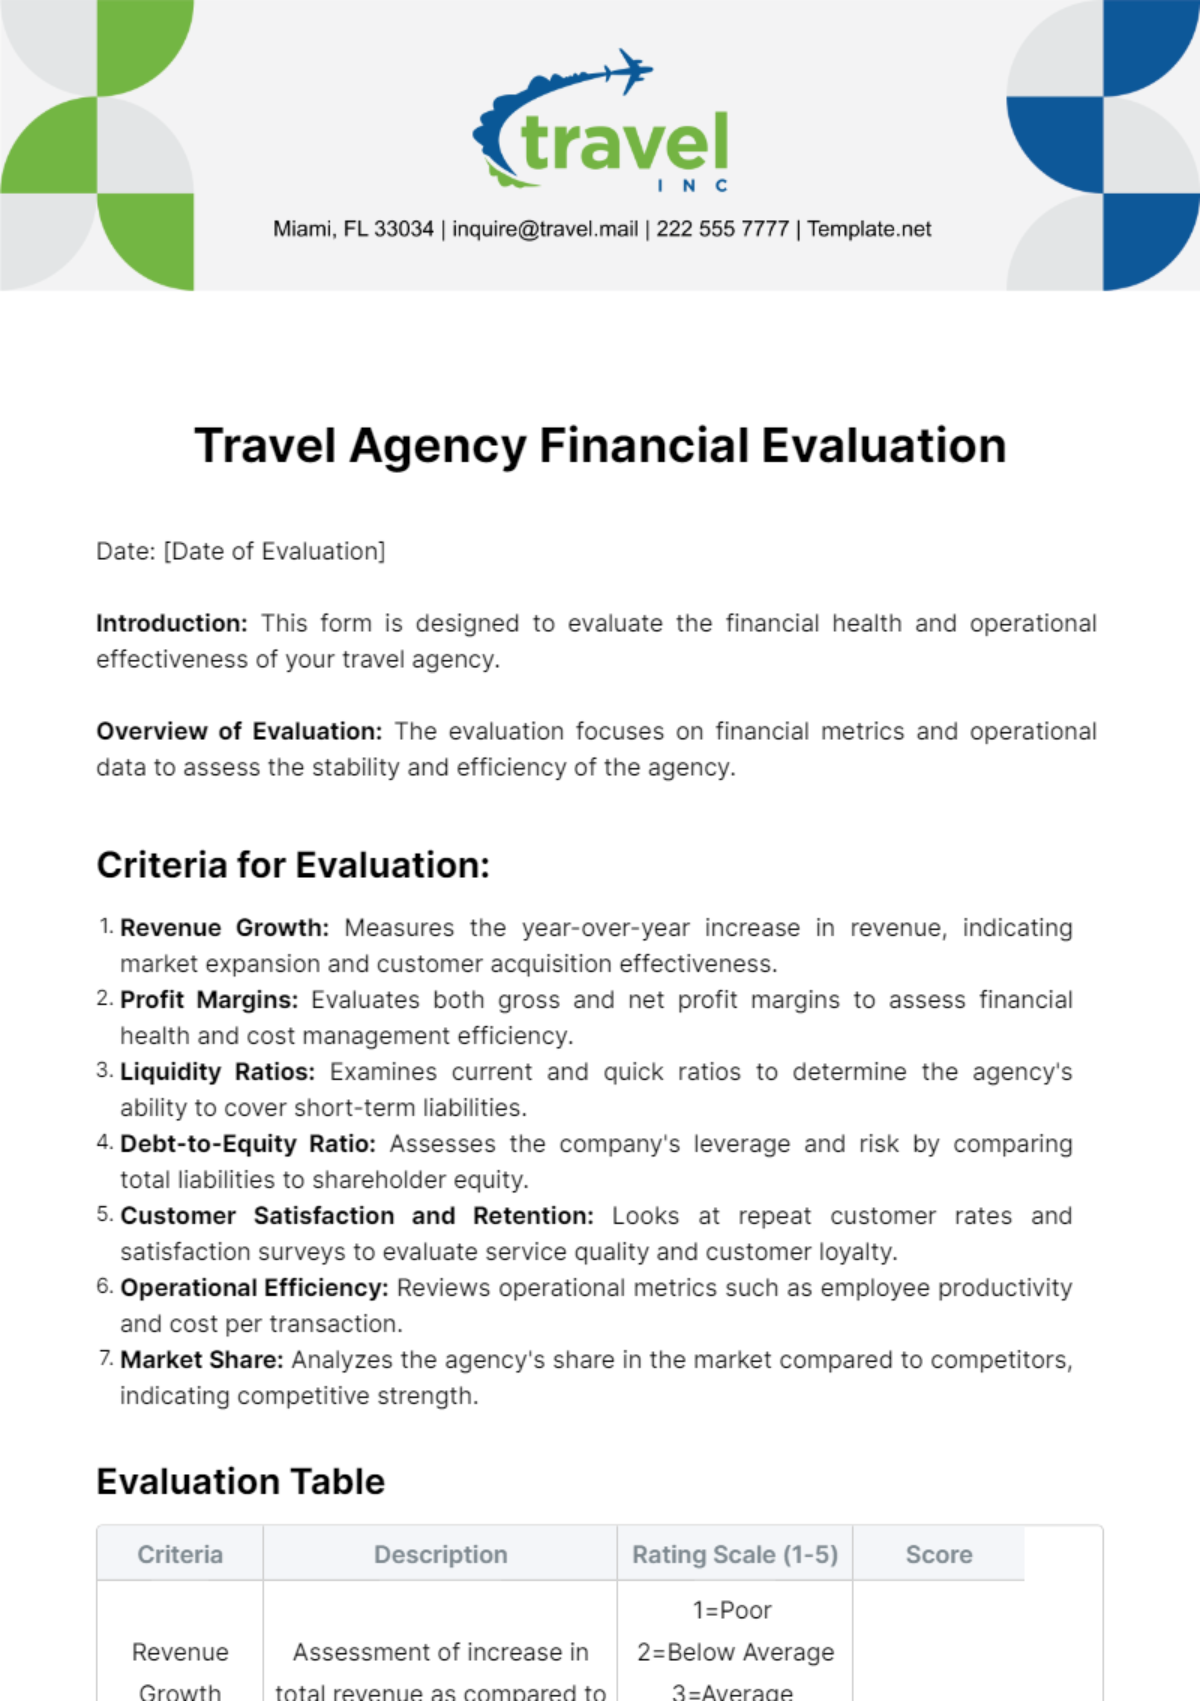
Introduction: This form is designed to evaluate the financial health and operational effectiveness of your travel agency.
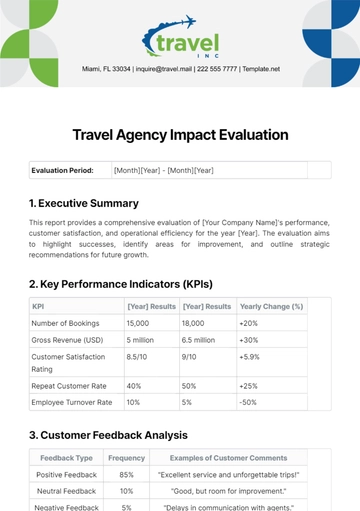
Overview of Evaluation: The evaluation focuses on financial metrics and operational data to assess the stability and efficiency of the agency.
Criteria for Evaluation:
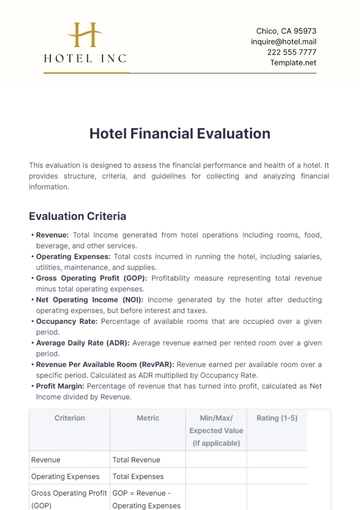
Revenue Growth: Measures the year-over-year increase in revenue, indicating market expansion and customer acquisition effectiveness.
Profit Margins: Evaluates both gross and net profit margins to assess financial health and cost management efficiency.
Liquidity Ratios: Examines current and quick ratios to determine the agency's ability to cover short-term liabilities.
Debt-to-Equity Ratio: Assesses the company's leverage and risk by comparing total liabilities to shareholder equity.
Customer Satisfaction and Retention: Looks at repeat customer rates and satisfaction surveys to evaluate service quality and customer loyalty.
Operational Efficiency: Reviews operational metrics such as employee productivity and cost per transaction.
Market Share: Analyzes the agency's share in the market compared to competitors, indicating competitive strength.
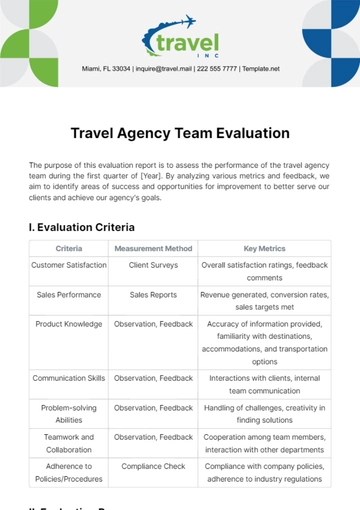
Evaluation Table
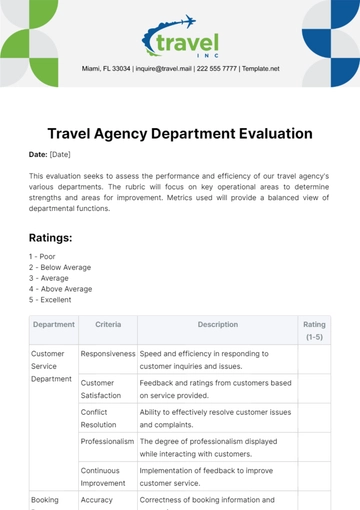
Criteria | Description | Rating Scale (1-5) | Score |
|---|---|---|---|
Revenue Growth | Assessment of increase in total revenue as compared to the previous fiscal year. | 1=Poor 2=Below Average 3=Average 4=Above Average 5=Excellent | |
Profit Margins | Evaluation of gross and net margins to understand profitability. | 1=Poor 2=Below Average 3=Average 4=Above Average 5=Excellent | |
Liquidity Ratios | Analysis of current and quick ratios to measure short-term financial stability. | 1=Very Low 2=Low 3=Moderate 4=High 5=Very High | |
Debt-to-Equity Ratio | Comparison of total debt to shareholders' equity to understand financial leverage. | 1=Very High Risk 2=High Risk 3=Average Risk 4=Low Risk 5=Very Low Risk | |
Customer Satisfaction and Retention | Measure of repeat customers and results from satisfaction surveys. | 1=Very Poor 2=Poor 3=Fair 4=Good 5=Excellent | |
Operational Efficiency | Examination of productivity per employee and operational costs per transaction. | 1=Poor 2=Below Average 3=Average 4=Above Average 5=Excellent | |
Market Share | Analysis of the agency’s market position relative to competitors. | 1=Poor 2=Below Average 3=Average 4=Above Average 5=Dominant |
Additional Comments and Notes:
- 100% Customizable, free editor
- Access 1 Million+ Templates, photo’s & graphics
- Download or share as a template
- Click and replace photos, graphics, text, backgrounds
- Resize, crop, AI write & more
- Access advanced editor
Initiate a thorough financial assessment with Template.net's Travel Agency Financial Evaluation Template. This meticulously crafted document simplifies the analysis of your agency's financial performance. Customize key metrics, performance indicators, and analysis effortlessly with our AI editor tool. Gain valuable insights to optimize financial strategies and drive growth in the travel industry, ensuring your agency remains financially resilient and competitive.
