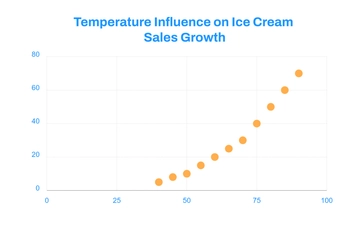
A clean graph for showing how temperature relates to ice cream sales, professionally designed by Template.net, with a scatter plot, orange data points and a bold chart title in bright blue, orange and white.
A clean graph for showing how temperature relates to ice cream sales, professionally designed by Template.net, with a scatter plot, orange data points and a bold chart title in bright blue, orange and white.