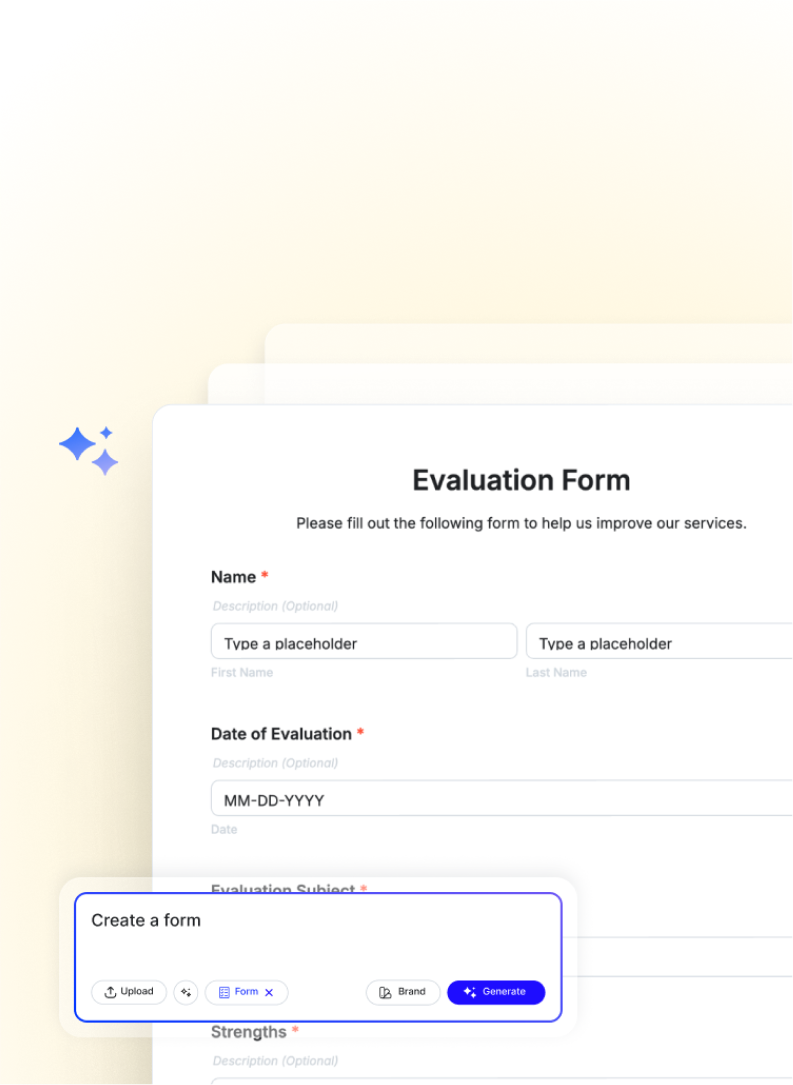
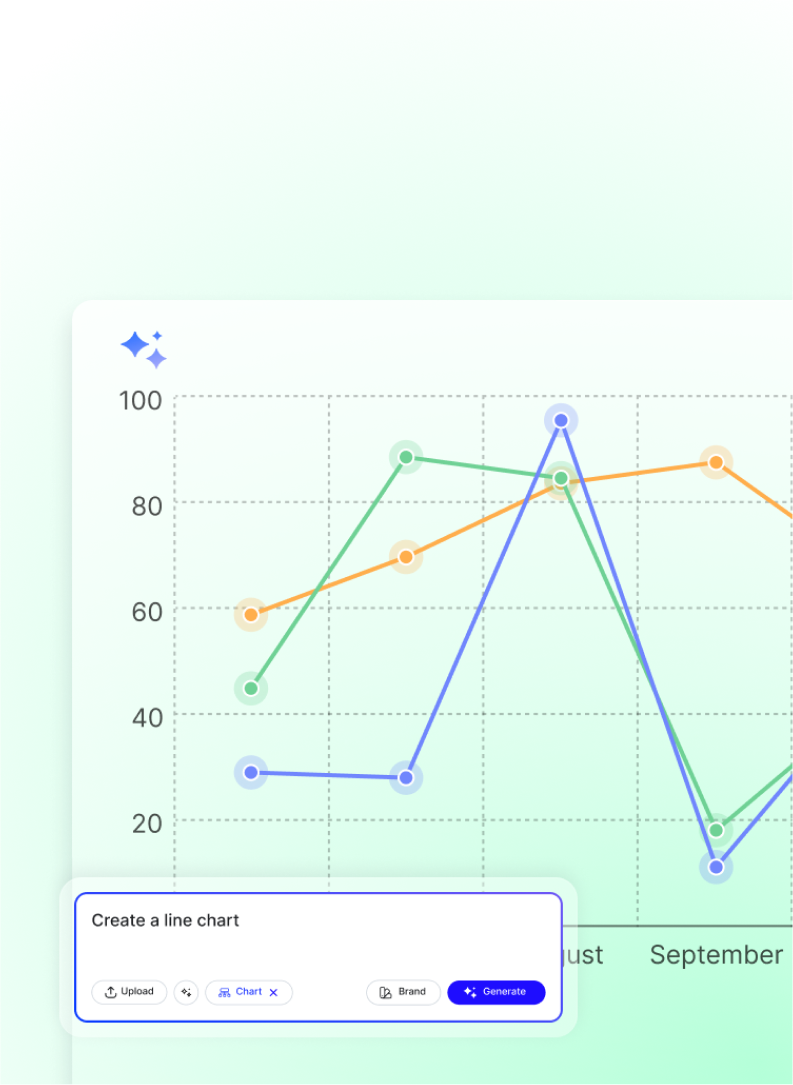
Make Charts, Edit Online with AI-Powered Editor
Template.net’s Free AI Chart Maker turns raw data and prompts into stunning, editable charts. Upload a file, paste a table, or describe your goal and AI will select the best chart format, such as bar charts for comparisons, pie charts for proportions, line charts for trends, or column charts for performance tracking. Then, use the drag-and-drop editor to style, annotate, and brand your chart effortlessly.
Free AI Chart Maker Online
Create Custom Editable Charts For Free
Everything you need to turn numbers into insights editable, exportable, and easy to understand.
Prompt-Based Chart Generation
Use voice or text to describe what you want, like “sales comparison across 4 stores in Q2,” and AI will suggest the most effective chart type bar, line, pie, column, or radar and generate the layout for editing.
Upload or Input Data Instantly
Input data directly into smart tables or upload CSV, Excel, or Google Sheets. AI reads the structure, highlights key metrics, and builds a visually aligned chart in seconds.
Choose from Pre-Designed Chart Templates
Access a wide range of chart templates for business, marketing, education, sales, finance, and HR. Customize fonts, shapes, colors, and data values to match your content.
Drag-and-Drop Editing Tools
Edit labels, axes, legends, titles, shapes, and data points visually. Resize elements and rearrange chart components using simple drag-and-drop tools.
Smart Layouts and AI Chart Suggestions
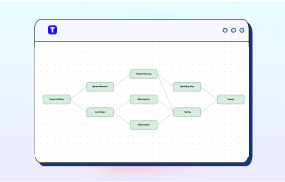
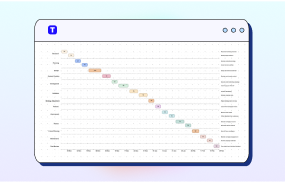
Let AI analyze your data and recommend the most suitable chart structure whether it's a stacked bar, pie breakdown, timeline, or performance graph. Charts auto-format with visual balance and readability.
Brand Integration and Styling
Add your logo, select brand fonts, and apply custom color palettes. Save branded templates for quick reuse across reports or presentations.
Responsive, Multilingual Output
Create charts in 20+ supported languages: English, Spanish, Hindi, Arabic, Chinese, French, German, Portuguese, Japanese, Russian, Korean, Italian, Turkish, Vietnamese, Urdu, Persian, Bengali, Polish, Thai, and Punjabi. Charts also adapt to various screen sizes for presentations or mobile previews.
Download and Share Anywhere
Export charts in PDF, PNG, or CSV. Share via public link, QR code, or embed into reports, presentations, or websites. Export to Google Slides, PowerPoint, OneDrive, Google Drive, Dropbox, WordPress, Notion, or Excel.
Smart Workspaces for Teams and Projects
Organize charts into folders by client, department, or topic. Assign access, rename files, star favorites, and track versions all within your collaborative workspace.
Create Charts in Seconds, Just Add Your Data or Prompt
Template.net makes chart creation faster and more effective whether you're building bar charts for comparisons, pie charts for category breakdowns, line charts for tracking trends, or column charts for performance summaries. Use simple prompts or upload your data to generate powerful visuals for meetings, reports, class projects, or campaigns without switching tools or formatting manually.
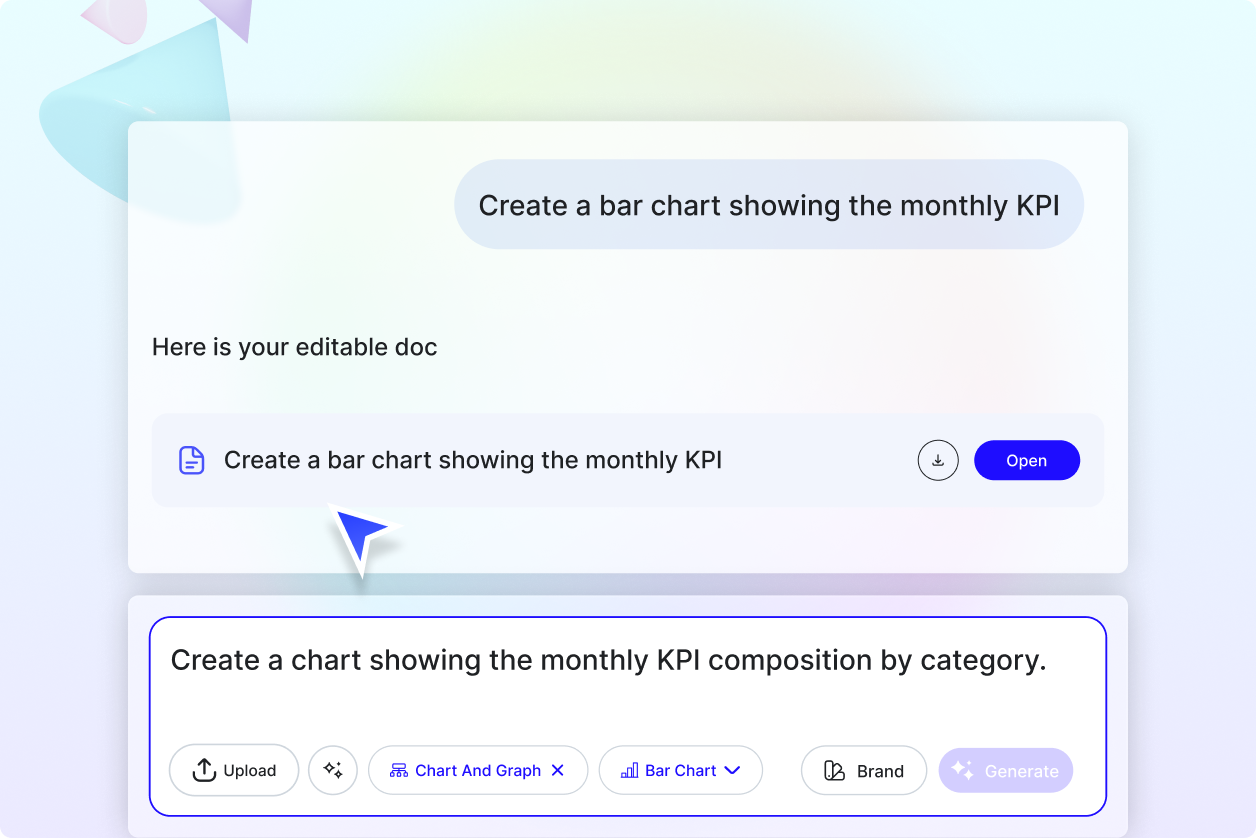
Generate Charts That Match Your Brand
Keep your data visuals consistent with your brand. Upload your logo, apply custom fonts and colors, and save each chart layout as a branded template you can reuse across all reports and presentations.
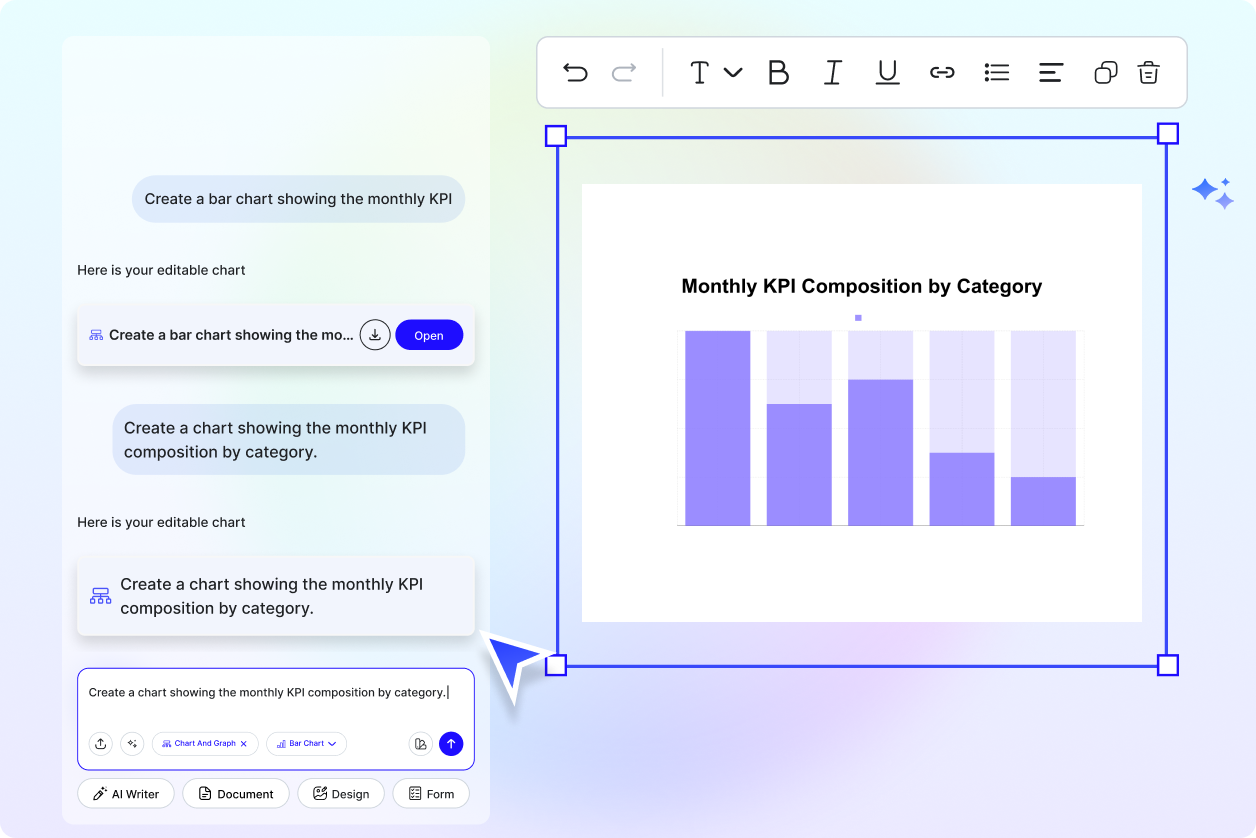
Customize and Repurpose Easily
Update your chart’s data or switch between chart types like turning a bar chart into a line graph or a pie chart into a stacked column view. Whether you're preparing a financial summary, marketing dashboard, or academic report, reuse and adapt your charts with just a few clicks.
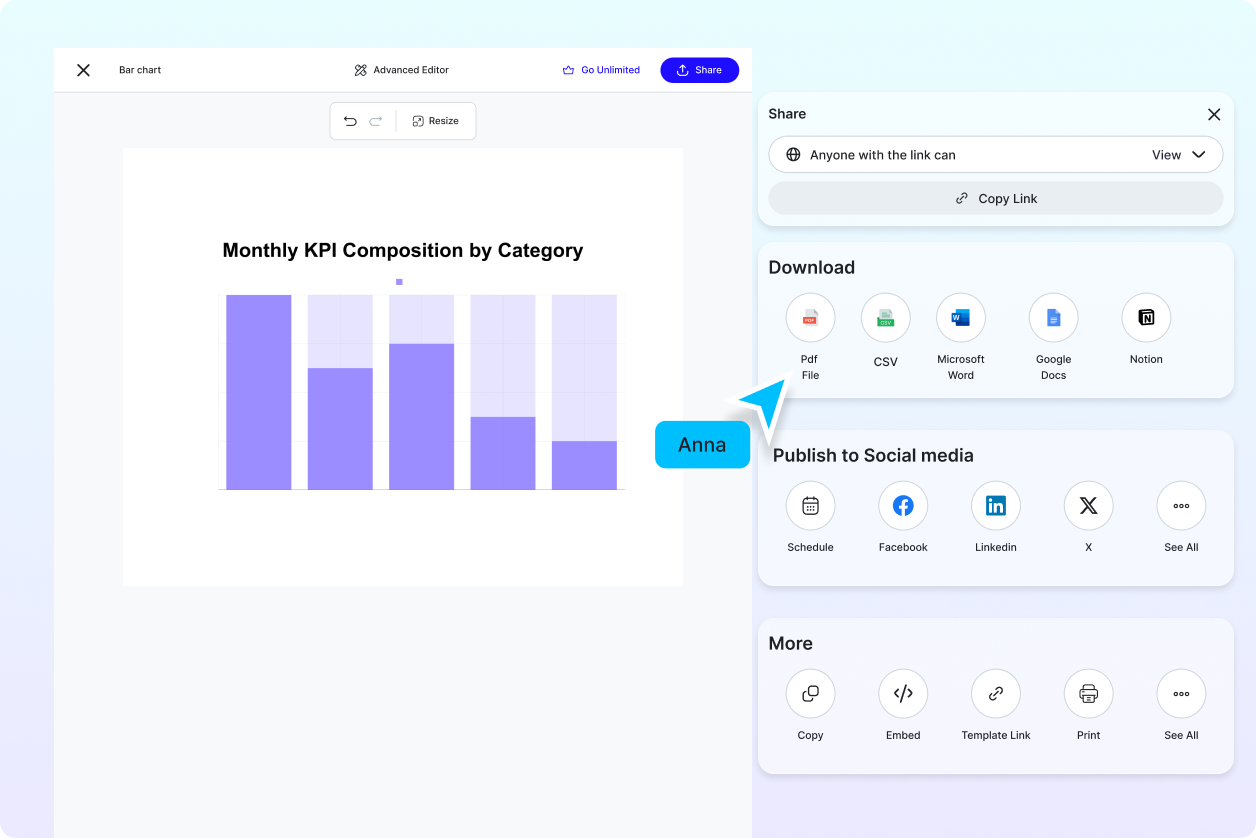
Share and Present with Ease
Download your charts in PNG, PDF, or CSV formats. Or share via public link, QR code, or direct export to Google Slides, PowerPoint, WordPress, Notion, Dropbox, or OneDrive ready for any platform.
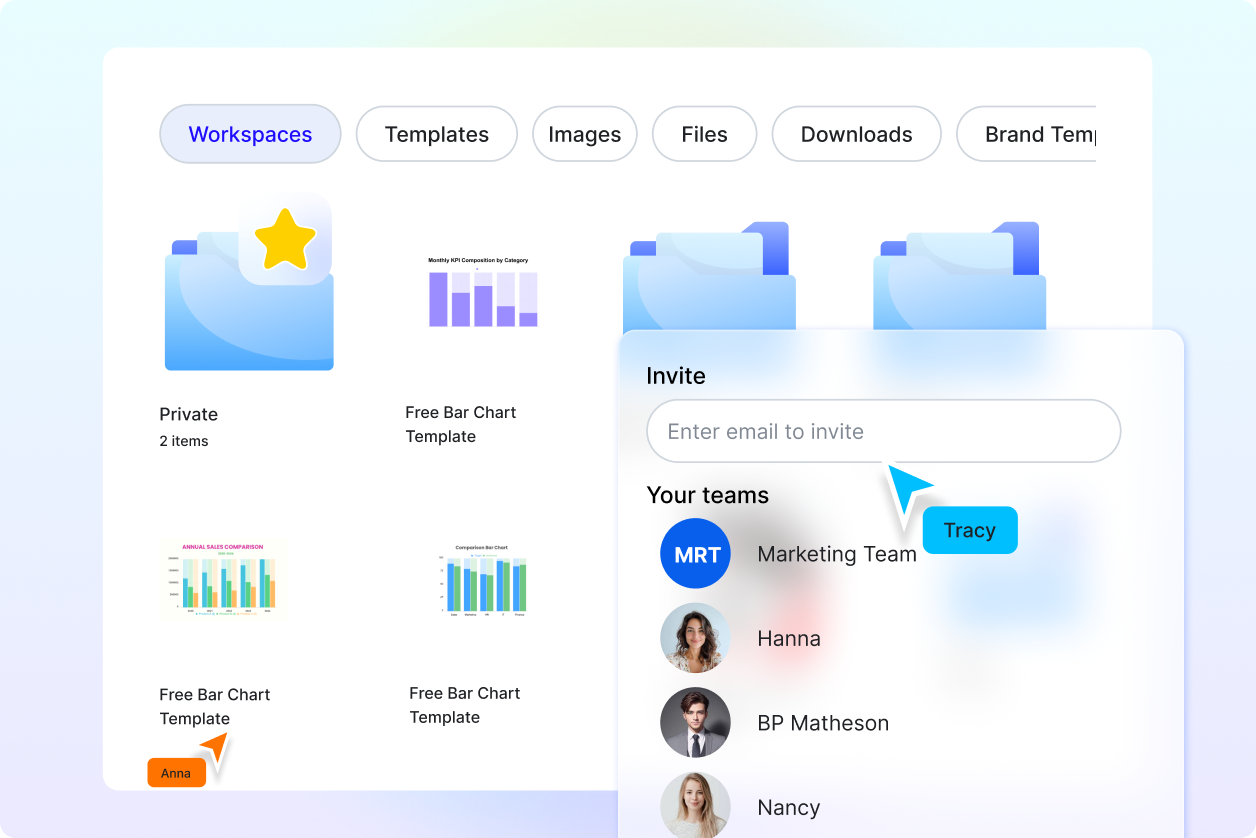
Manage Everything in Smart Workspaces
Stay organized with folders, tags, version tracking, and permissions. Group your charts by project, team, or report type, and streamline collaboration within a centralized workspace.
AI Chart Maker FAQ
What is a chart, definition?
A chart is a visual representation of data, helping readers understand comparisons, trends, and relationships. With Template.net’s AI Chart Editor, you can instantly generate editable charts using data or prompts no technical experience needed.
What types of charts can I create?
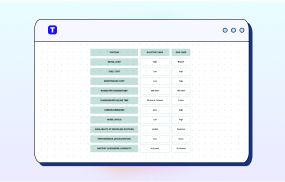
You can generate bar charts, pie charts, line graphs, area charts, column charts, radar charts, timelines, stacked charts, and comparison visuals for any purpose.
Can I input or upload my own data?
Yes. You can upload data through CSV, Excel, or Google Sheets, or type/paste values directly into editable smart tables in the editor.
Does it support real-time collaboration?
Yes. You can co-edit charts, manage access through shared folders, comment live, and collaborate on visuals in a shared workspace.
Which file formats can I export my charts in?
You can download your charts in PNG, PDF, or CSV formats. You can also export directly to Google Slides, PowerPoint, Notion, WordPress, OneDrive, Dropbox, or Google Drive.
Can I apply my brand styling to charts?
Yes. You can apply logos, brand fonts, and color palettes to your charts, and save them as branded templates for future use.
Is Template.net’s AI Chart Editor free to use?
Yes. All chart generation, editing, downloading, and sharing features are free no account or subscription required.


