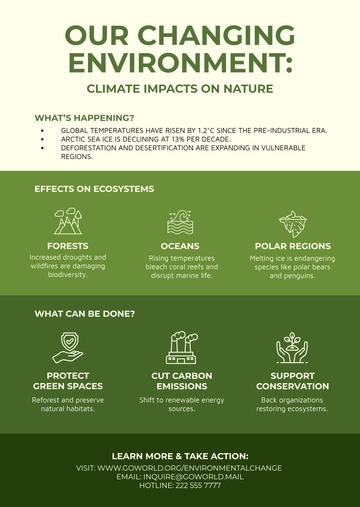
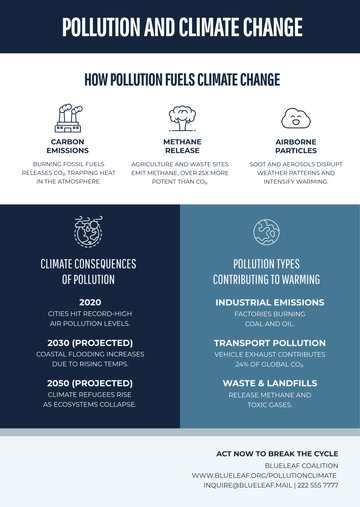
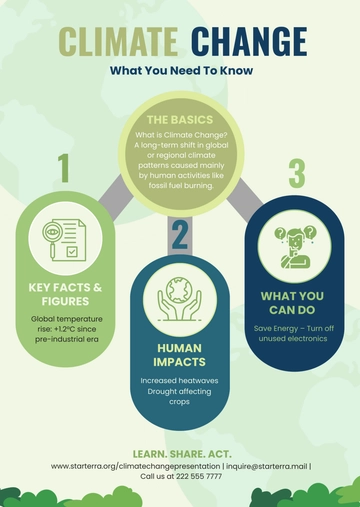
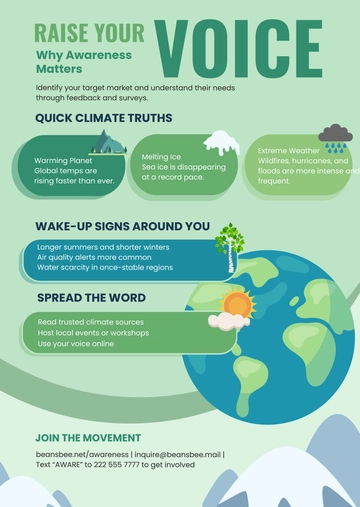
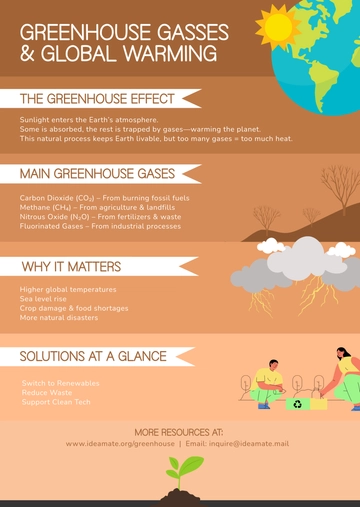
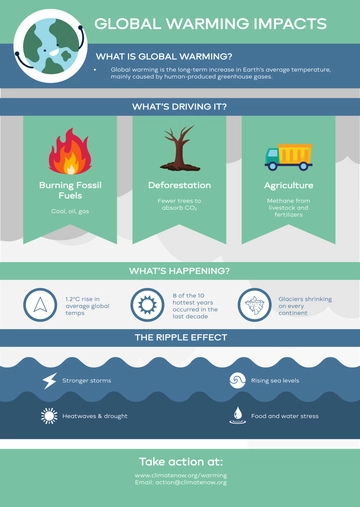
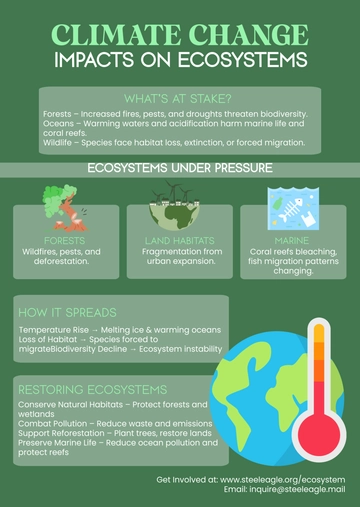
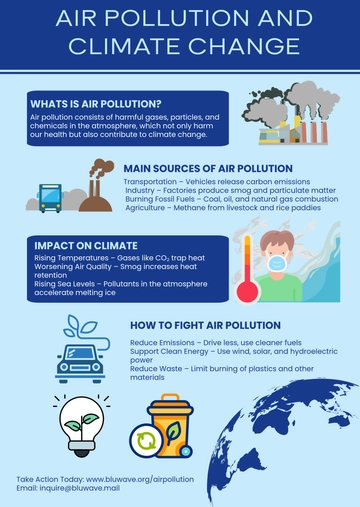
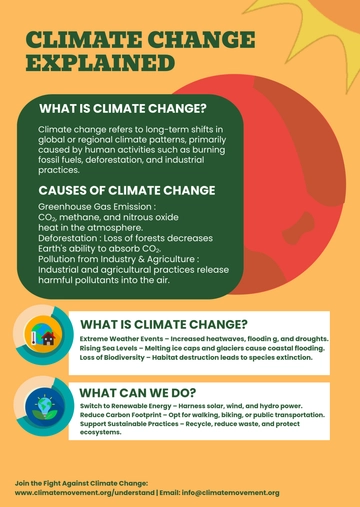
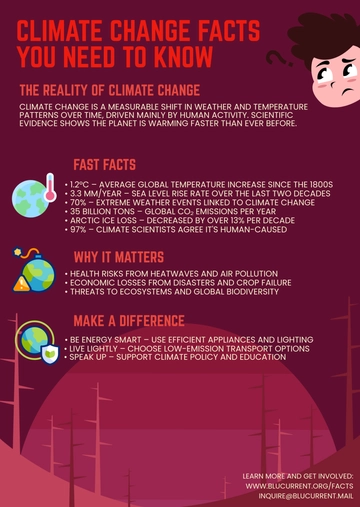
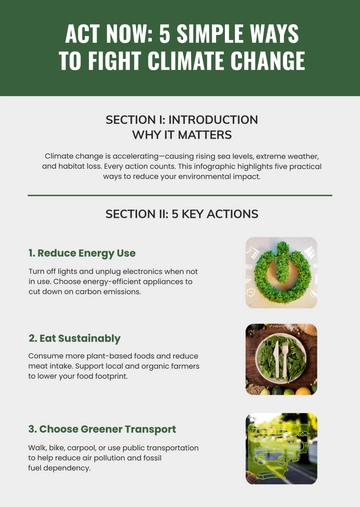
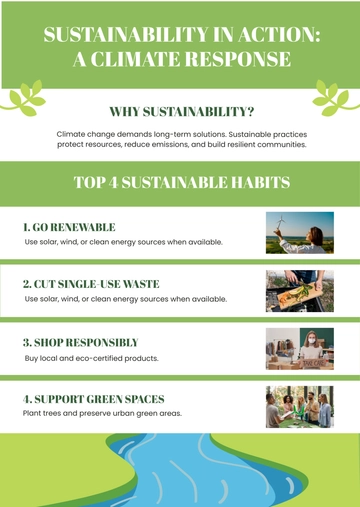
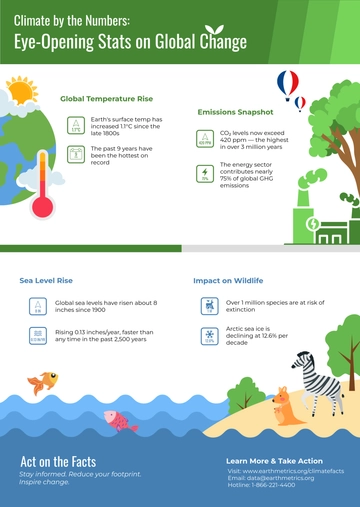
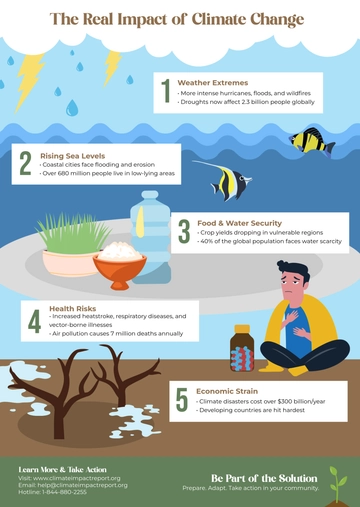
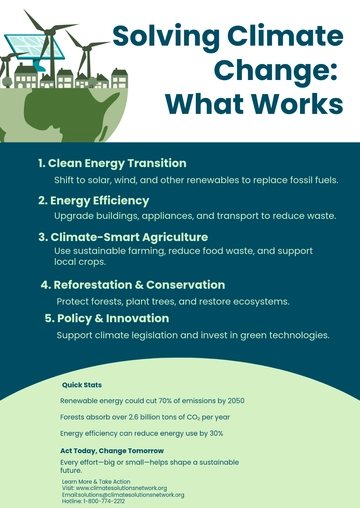
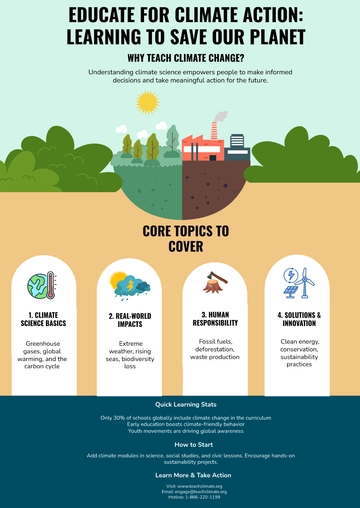
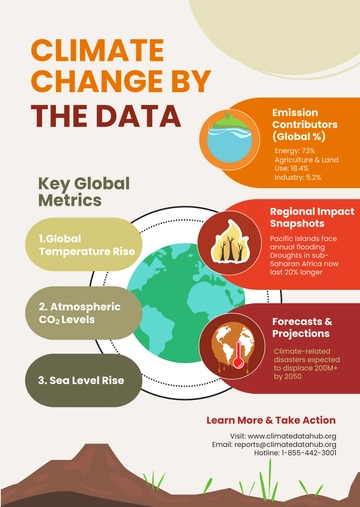
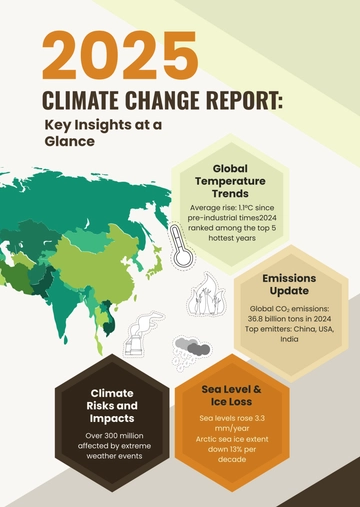
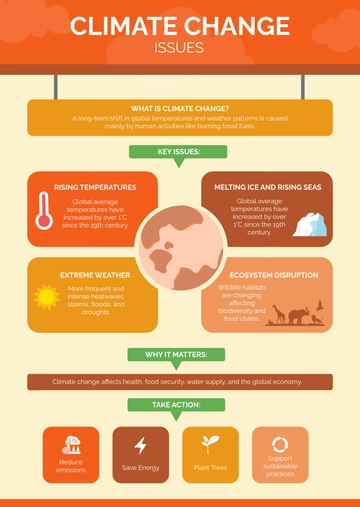
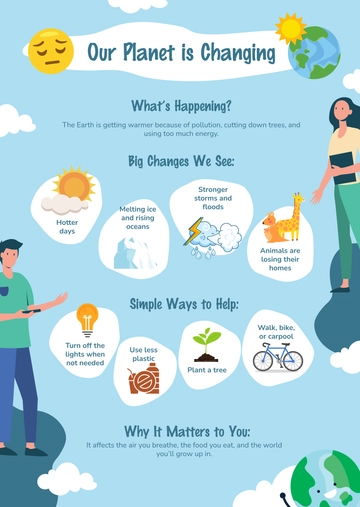
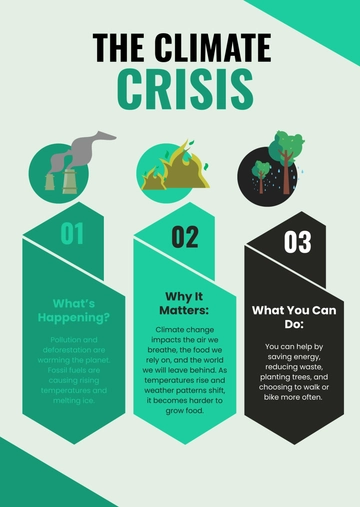
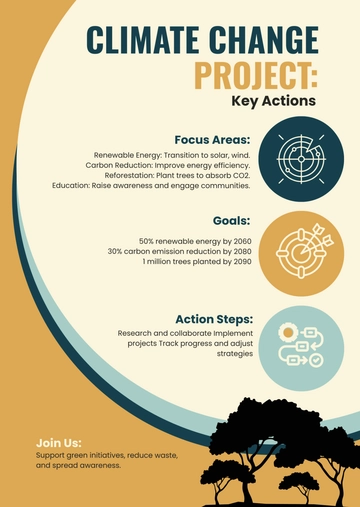
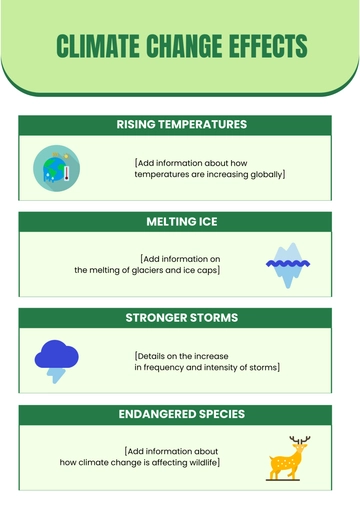
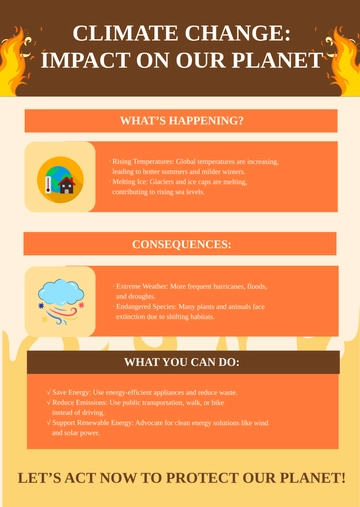
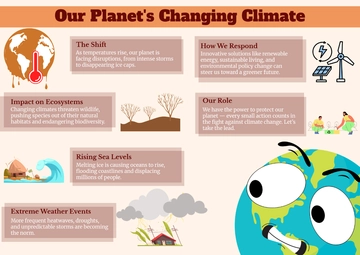
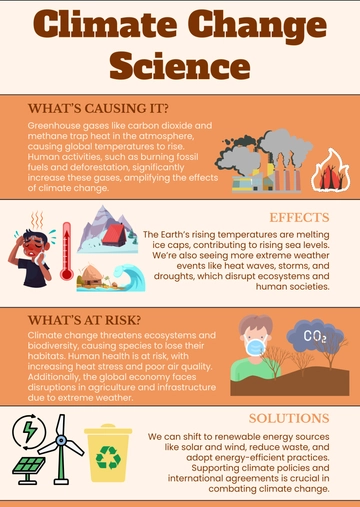
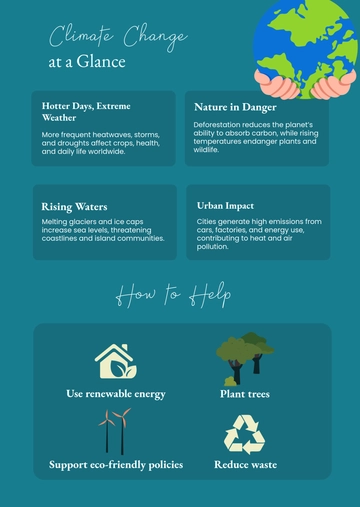
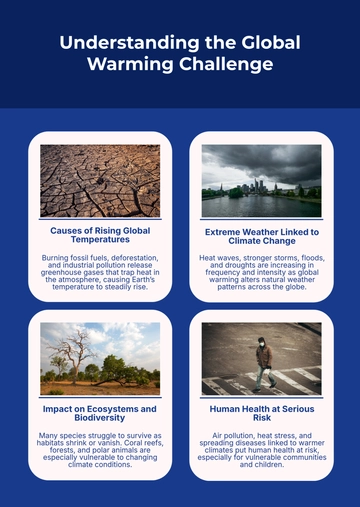
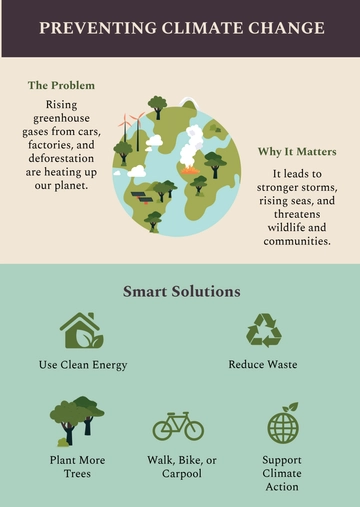
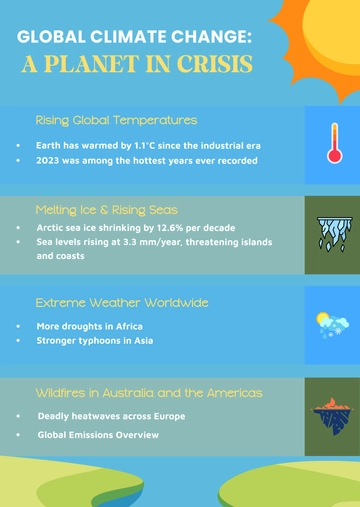
An informative infographic for explaining climate change, professionally designed by Template.net, with a red globe, a dark green text panel and donut chart icons in warm orange, dark green and red.
An informative infographic for explaining climate change, professionally designed by Template.net, with a red globe, a dark green text panel and donut chart icons in warm orange, dark green and red.