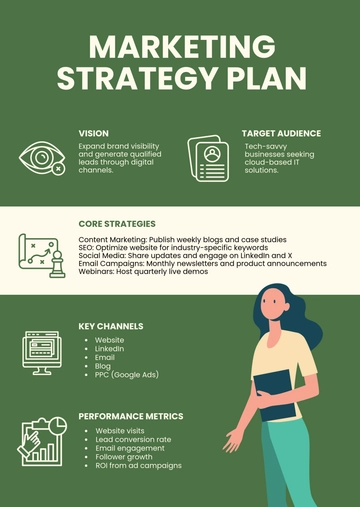
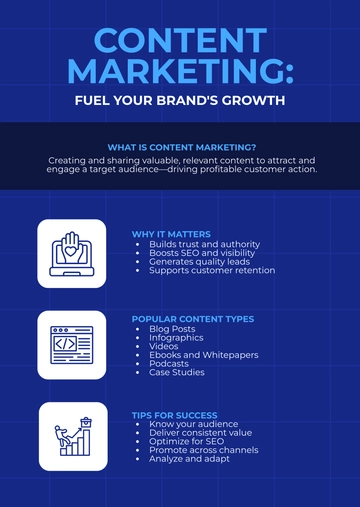
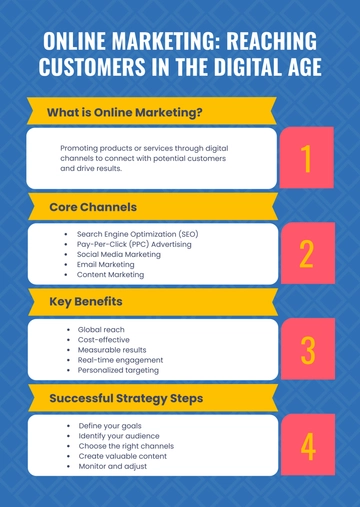
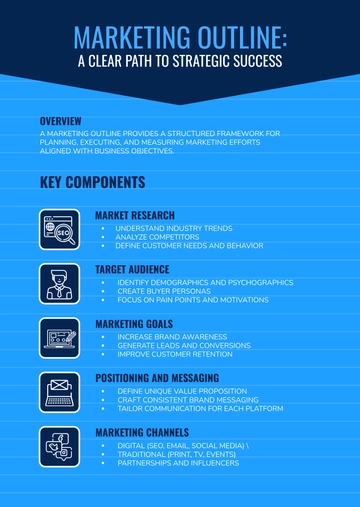
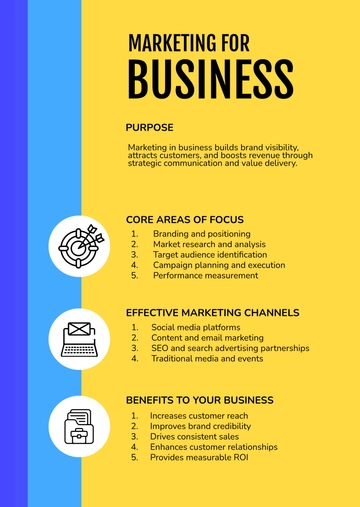
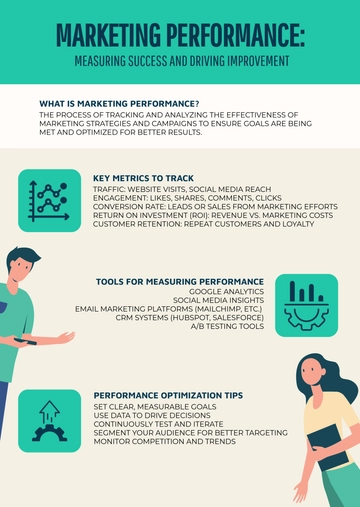
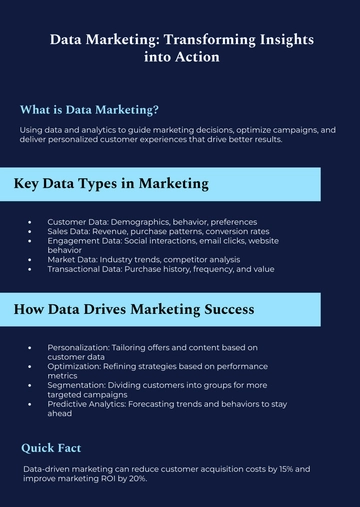
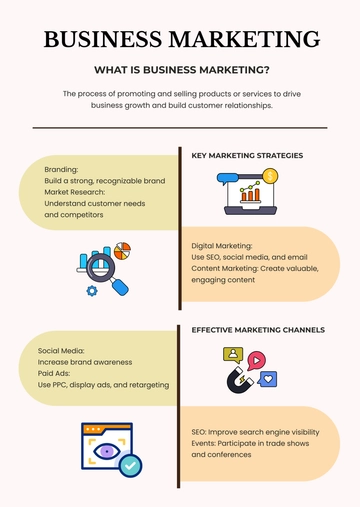
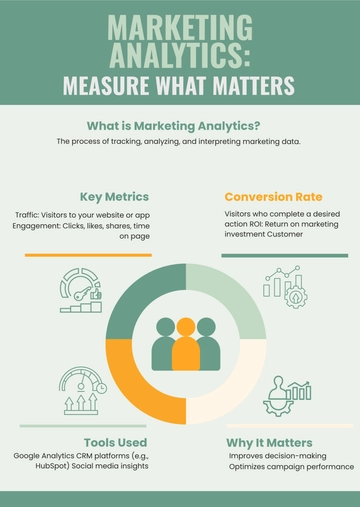
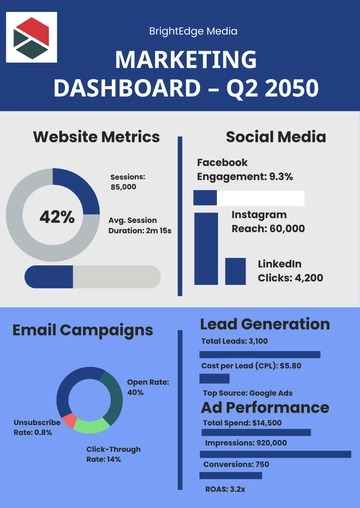
A professional marketing infographic for presenting quarterly dashboard results, professionally designed by Template.net, with a donut chart, bar graphs and four metric sections in navy blue, periwinkle blue and light gray.
A professional marketing infographic for presenting quarterly dashboard results, professionally designed by Template.net, with a donut chart, bar graphs and four metric sections in navy blue, periwinkle blue and light gray.