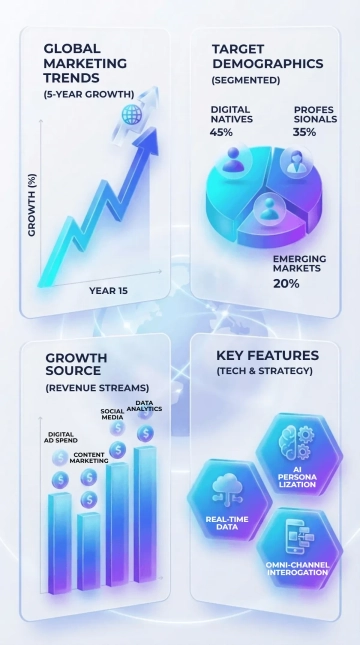
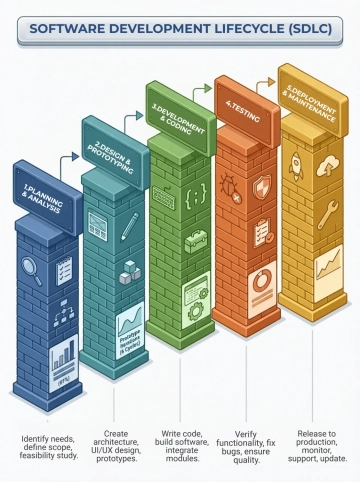
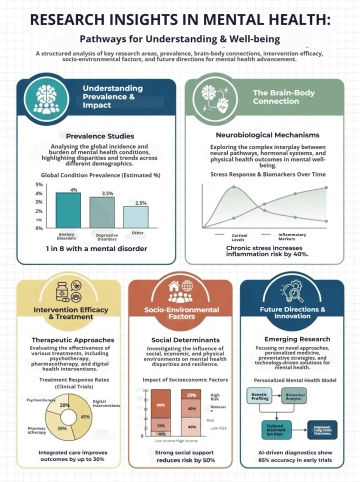
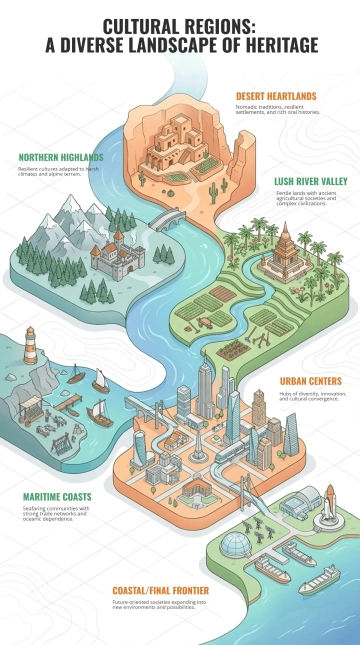
Data Analytics Visualization Infographic Template with a donut chart, three comparison columns and a growth line graph

Data Analytics Visualization Infographic Template is a professional 3:4 infographic for presenting data analytics insights, professionally designed by Template.net, with a donut chart, three comparison columns and a growth line graph in royal blue, fresh teal and soft purple.


Customize it in two ways:

  • Editable with AI Replace the text with [text_input], change to relevant elements while keeping similar style, composition and background.
  • Easily edit it manually: customize the content, elements, photos, colors and fonts.

Free Data Analytics Visualization Infographic Template

By Template.net

Open Editor
Infographics Generator