Get Access to World’s largest Template Library & Tools

How to Make a Histogram in Microsoft Excel

Microsoft Excel makes creating histograms a breeze, even for 7th-grade students. Perfect your data visualization skills effortlessly with our straightforward instructions. Let’s dive in!


How to Make a Histogram in Microsoft Excel


Histograms are powerful tools for visualizing the distribution of data in Microsoft Excel. Whether you’re analyzing test scores, survey responses, or other numbers, histograms can provide valuable insights. In this guide, we’ll walk you through the simple steps to create a histogram in Excel.

  • Step 1. Organize Your Data

    Arrange your data into a single column in Excel. Each cell should contain a single value representing the data point you want to include in your histogram.

  • Step 2. Insert a Chart

    step 2 insert a chart

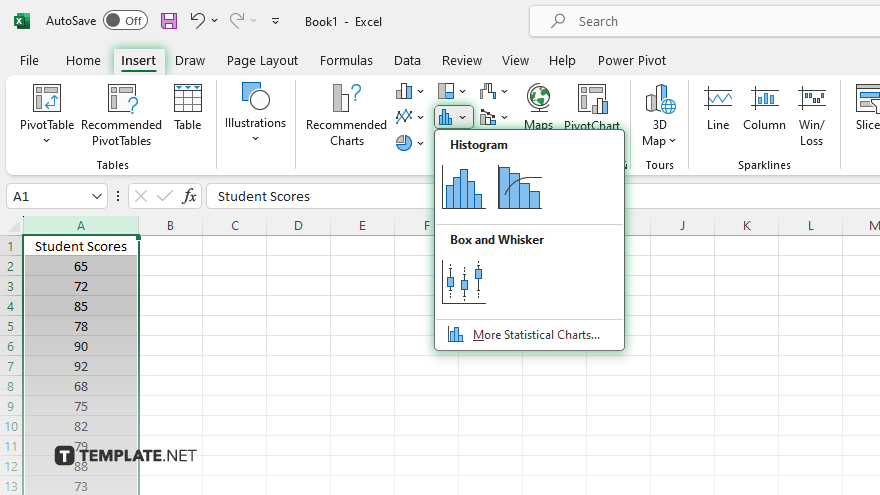
    Select your data range, then go to the “Insert” tab and click the “Insert Statistic Chart” button. Choose the histogram chart type from the options provided.

  • Step 3. Customize Your Histogram

    step 3 customize your histogram

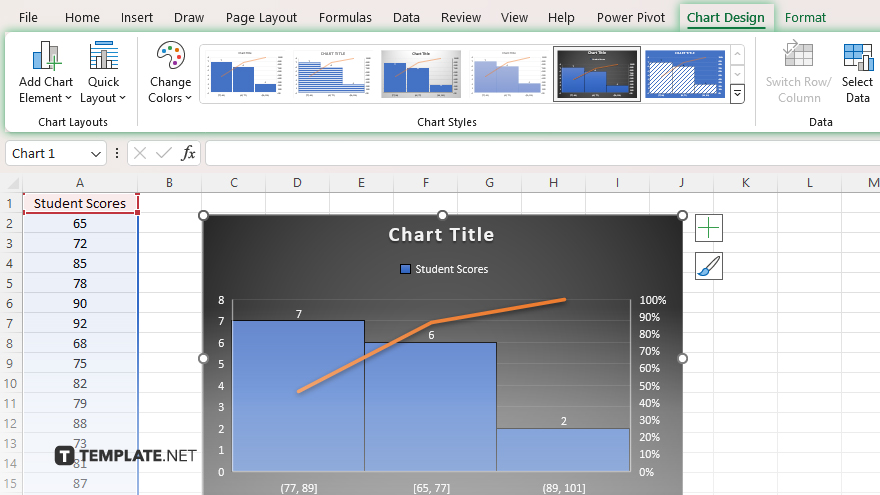
    Excel will automatically generate a basic histogram based on your data. You can customize the appearance of the histogram by adjusting the axis labels, bin width, and other formatting options.

  • Step 4. Add Titles and Labels

    step 4 add titles and labels

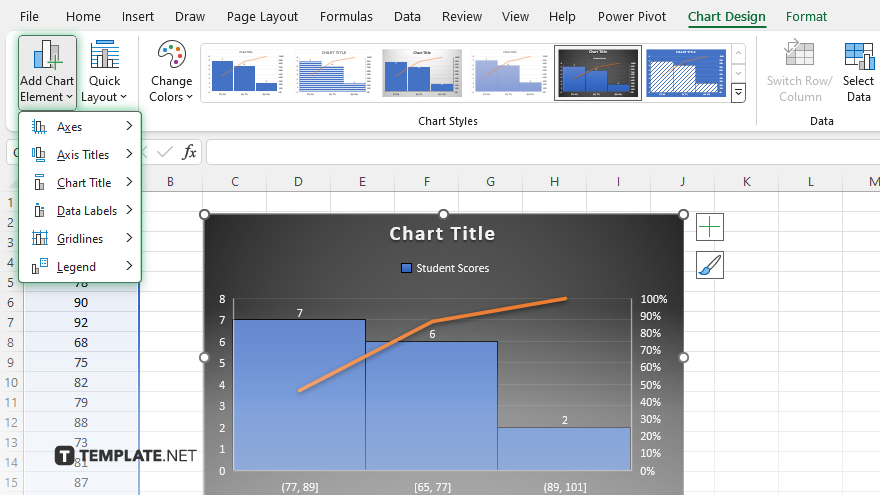
    Make your histogram easy to understand by adding a title and labeling the axes. Indicate what the histogram represents and provide any necessary context for interpreting the data.

  • Step 5. Analyze and Interpret

    Once your histogram is complete, take some time to analyze the distribution of your data. Look for patterns, outliers, and other trends that can help you draw meaningful conclusions.

You may also find valuable insights in the following articles offering tips for Microsoft Excel:

note iconNote

Unlock Your Productivity with Over 100,000 Microsoft Excel Templates! Exclusively Available at Template.net – Download Now and Transform Your Data Handling Experience!

FAQs

What is a histogram?

A histogram is a graphical representation of the distribution of numerical data.

How do I interpret a histogram?

The bars on a histogram represent the frequency or count of data values within each interval.

What is the purpose of a histogram?

Histograms help visualize the shape, center, and spread of a dataset.

Can I customize the appearance of a histogram?

Yes, you can customize axis labels, bin widths, colors, and other visual elements in a histogram.

How do I decide on the number of bins for my histogram?

A common rule of thumb is to start with 5-20 bins and adjust based on the clarity and insights needed from the data.

More in Excel

How to Make Comparison Charts in Microsoft ExcelHow to Code in Microsoft Excel
How to Write a Paragraph in Microsoft ExcelHow to Find on Microsoft Excel
How to Select All Rows in Microsoft ExcelHow to Create a Weekly Schedule in Microsoft Excel
How To Add 2 Columns in Microsoft ExcelHow to Export Microsoft Excel to PDF
How to Add Vertical Lines in an Excel GraphHow to Wrap a Cell in Microsoft Excel
How to Add Dates in Microsoft Excel AutomaticallyHow to Create a Flowchart in Microsoft Excel
How to Change the Y Axis in Microsoft ExcelHow to Add Cells Together in Microsoft Excel
How to Switch Axes in Microsoft ExcelHow to Compare Two Tabs in Microsoft Excel
How to Make a Scatter Plot on Microsoft ExcelHow to Remove Autofilter in Microsoft Excel
How to Do a Line Graph in Microsoft ExcelHow to Convert Date to Month in Microsoft Excel
How to Make a Balance Sheet in Microsoft ExcelHow to Refresh Microsoft Excel Formulas
How to Do a Histogram in Microsoft ExcelHow to Change the Microsoft Excel Theme
How to Learn Microsoft Excel for FreeHow to Create Address Labels in Microsoft Excel
How to Sort a Table in Microsoft ExcelHow to Find the Mean, Median, and Mode in Microsoft Excel
How to Sum Random Cells in Microsoft ExcelHow to Add a Whole Column in Microsoft Excel
How to Make a Copy of a Microsoft Excel WorkbookHow to Subtract a Column in Microsoft Excel
How to Remove Parentheses in Microsoft ExcelHow to Fix Rows in Microsoft Excel
How to Make a Timesheet in Microsoft ExcelHow to Create a Flow Chart in Microsoft Excel
How to Make Square Cells in Microsoft ExcelHow to Apply a Filter in Microsoft Excel
How to Insert a Note in Microsoft ExcelHow to Make a Graph in Microsoft Excel With Data
How to Create a Sparkline in Microsoft ExcelHow to Set Margins in Microsoft Excel
How to Copy Filtered Data in Microsoft ExcelHow to Set Default Font in Microsoft Excel
How to Edit Footer in Microsoft ExcelHow to Unhide All Sheets in Microsoft Excel
How to Get Rid of Spaces in Microsoft ExcelHow to Calculate Columns in Microsoft Excel
How to Change a Formula to a Value in Microsoft ExcelHow to Flip Rows and Columns in Microsoft Excel
How to Make a Box in Microsoft ExcelHow to Use NPV in Microsoft Excel
How to Make a List of Numbers in Microsoft ExcelHow to Make a Sensitivity Table in Microsoft Excel
How to Keep 0 in Front of a Number in Microsoft ExcelHow to Do an Absolute Reference in Microsoft Excel
How to Put a Drop Down in Microsoft ExcelHow to Change a Negative Number to Positive in Excel
How to Combine Tables in Microsoft ExcelHow to Highlight Blank Cells in Microsoft Excel
How to Save a Macro in Microsoft ExcelHow to Sort by Month in Microsoft Excel
How to Do a Percentage Increase in Microsoft ExcelHow to Apply Filter in Microsoft Excel
How to Delete Multiple Sheets in Microsoft ExcelHow to Create a Slicer in Microsoft Excel
How to Turn Microsoft Excel Data Into a GraphHow to Move a Page Break in Microsoft Excel
How to Clear Table Format in Microsoft ExcelHow to Extract the Year From a Date in Microsoft Excel
How to Do a Bar Graph in Microsoft ExcelHow to Change Theme in Microsoft Excel
How to Calculate Cells in Microsoft ExcelHow to Label X and Y Axis on Microsoft Excel
How to Change Print Area in Microsoft ExcelHow to Add 2 Cells in Microsoft Excel
How to Write Vertically in Microsoft ExcelHow to Display All Formulas in Microsoft Excel
How to Change the Chart Style in Microsoft ExcelHow to Enter Bullet Points in Microsoft Excel
How to Change a Microsoft Excel File from Read OnlyHow to Show the Ribbon in Microsoft Excel
How to Make a Clustered Column Chart in ExcelHow to See Duplicates in Microsoft Excel
How to Trim in Microsoft ExcelHow to Do a Scatter Plot in Microsoft Excel
How to Switch Cells in Microsoft ExcelHow to Calculate Workdays in Microsoft Excel
How to Make a Macro in Microsoft ExcelHow to Create a Sensitivity Table in Microsoft Excel
How to Calculate a Percentage in Microsoft ExcelHow to Freeze 2 Rows in Microsoft Excel
How to Import a File Into Microsoft ExcelHow to Email a Microsoft Excel Sheet
How to Create Labels in Word From Microsoft ExcelHow to Auto-Adjust Row Height in Microsoft Excel
How to Combine Tabs in Microsoft ExcelHow to Wrap Text in a Microsoft Excel Cell
How to Autofill the Date in Microsoft ExcelHow to Fix a Circular Reference in Microsoft Excel
bottom banner