Get Access to World’s largest Template Library & Tools

How to Make an X-Y Graph in Microsoft Excel


Microsoft Excel is an invaluable tool for creating X-Y graphs, offering a clear window into your data’s behavior and trends. Ideal for professionals, researchers, and students alike, master the process of plotting data points on an X-Y (scatter) graph to visualize complex datasets.
How to Make an X-Y Graph in Microsoft Excel


Crafting an X-Y graph in Microsoft Excel is a straightforward process that brings your data to life. This guide outlines the steps to create a dynamic X-Y (scatter) graph, making your data analysis both comprehensive and engaging.

  • Step 1. Prepare Your Data

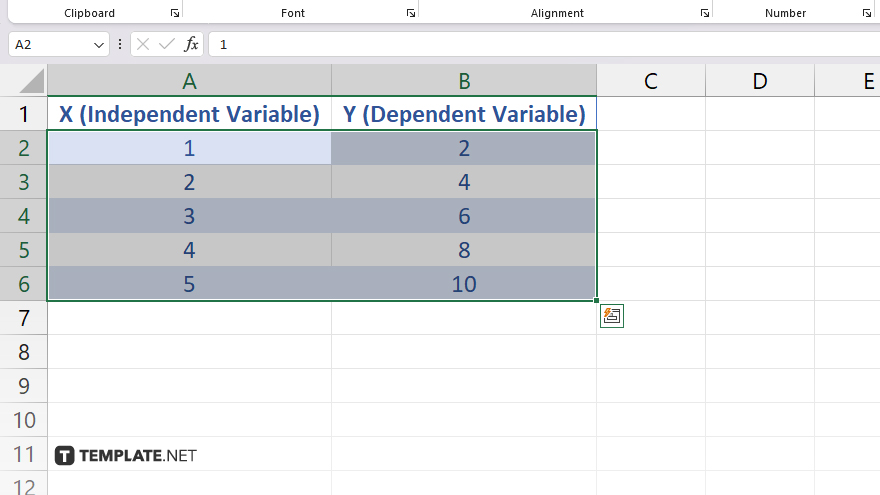
    Begin by organizing your data into two columns on an Excel sheet: one for the X values (independent variable) and one for the Y values (dependent variable). Ensure your data is clean and accurately entered for the most precise graphing results.

  • Step 2. Select Your Data

    step 2 select your data

    Highlight the data range for both X and Y columns. Make sure to include all the data points you want to plot, but exclude any headers or labels to prevent them from being interpreted as data points.

  • Step 3. Insert an X-Y Graph

    step 3 insert an x y graph

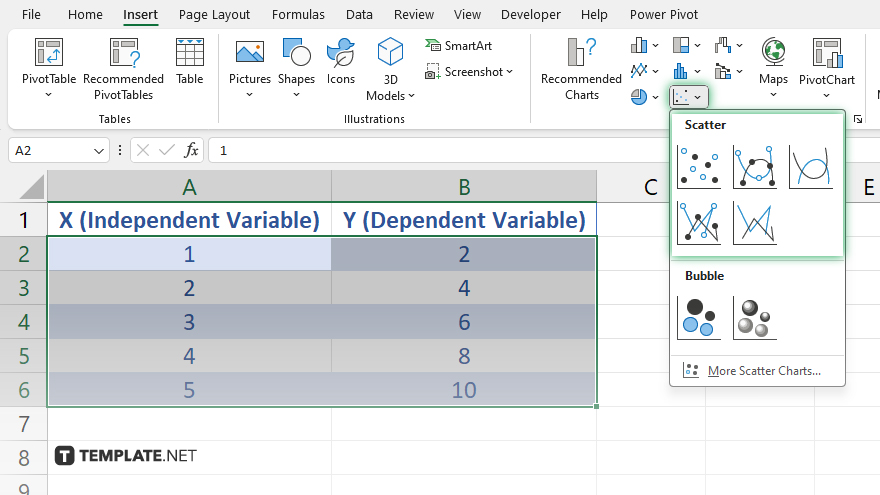
    With your data selected, navigate to the “Insert” tab on the Excel ribbon. Click on the “Scatter” icon (which may also be labeled as “X-Y (Scatter)”) in the “Charts” group. Choose your preferred scatter plot style from the drop-down menu. For a basic plot, select the first option, which displays just the markers without connecting lines.

  • Step 4. Customize Your Graph

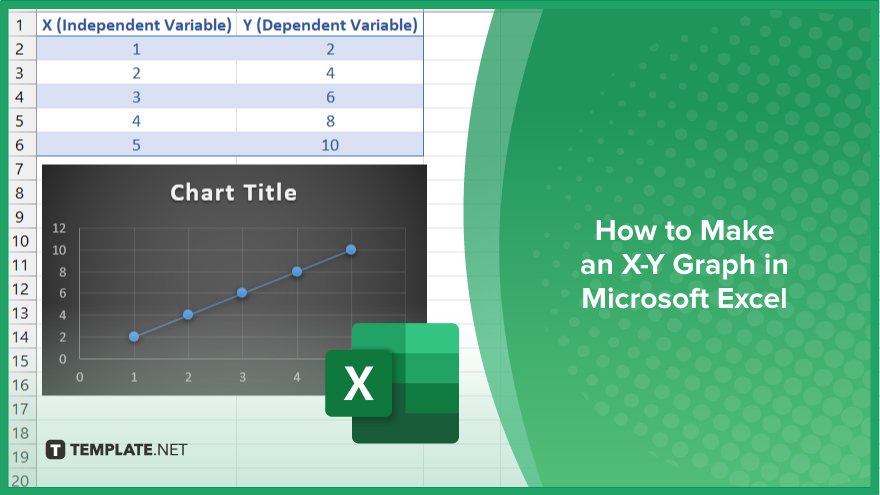
    After inserting the graph, Excel will automatically generate the X-Y graph based on your selected data. From here, you can customize the graph to fit your needs. Use the “Chart Tools Design and Format” tabs to add chart elements like titles, axis labels, and legends. You can also adjust the style and colors of your graph through these menus.

  • Step 5. Analyze and Interpret

    With your X-Y graph created, take the time to analyze the plotted data points. Look for patterns, trends, and correlations within your data. This visual analysis can provide valuable insights that are not immediately apparent from raw data.

You may also find valuable insights in the following articles offering tips for Microsoft Excel:

note iconNote

Unlock Your Productivity with Over 100,000 Microsoft Excel Templates! Exclusively Available at Template.net – Download Now and Transform Your Data Handling Experience!

FAQs

Can I add a trendline to my X-Y graph in Excel?

Yes, you can add a trendline by clicking on a data series and selecting “Add Trendline” from the chart options.

How do I label individual data points on an X-Y graph?

Right-click a data point, select “Add Data Labels,” then again right-click and choose “Format Data Labels” to customize, including using values from cells as labels.

Is it possible to create an X-Y graph with multiple data series?

Yes, you can plot multiple data series on the same X-Y graph by selecting additional data ranges during the initial graph setup or by using the “Select Data” option on the chart menu.

Can I change the scale of the axes in an X-Y graph?

Yes, you can manually adjust the scale of the X and Y axes by right-clicking on the axis and selecting “Format Axis,” where you can set the axis bounds and units.

How do I change the appearance of the markers in an X-Y graph?

Right-click on a data series and choose “Format Data Series,” then navigate to the “Marker” options to change the marker style, size, and color.

More in Excel

How to Clear Table Format in Microsoft ExcelHow to Extract the Year From a Date in Microsoft Excel
How to Do a Bar Graph in Microsoft ExcelHow to Change Theme in Microsoft Excel
How to Calculate Cells in Microsoft ExcelHow to Label X and Y Axis on Microsoft Excel
How to Change Print Area in Microsoft ExcelHow to Add 2 Cells in Microsoft Excel
How to Write Vertically in Microsoft ExcelHow to Display All Formulas in Microsoft Excel
How to Change the Chart Style in Microsoft ExcelHow to Enter Bullet Points in Microsoft Excel
How to Change a Microsoft Excel File from Read OnlyHow to Show the Ribbon in Microsoft Excel
How to Make a Clustered Column Chart in ExcelHow to See Duplicates in Microsoft Excel
How to Trim in Microsoft ExcelHow to Do a Scatter Plot in Microsoft Excel
How to Switch Cells in Microsoft ExcelHow to Calculate Workdays in Microsoft Excel
How to Make a Macro in Microsoft ExcelHow to Create a Sensitivity Table in Microsoft Excel
How to Calculate a Percentage in Microsoft ExcelHow to Freeze 2 Rows in Microsoft Excel
How to Import a File Into Microsoft ExcelHow to Email a Microsoft Excel Sheet
How to Create Labels in Word From Microsoft ExcelHow to Auto-Adjust Row Height in Microsoft Excel
How to Combine Tabs in Microsoft ExcelHow to Wrap Text in a Microsoft Excel Cell
How to Autofill the Date in Microsoft ExcelHow to Fix a Circular Reference in Microsoft Excel
How to Add a Label to an Axis in Microsoft ExcelHow to Select a Row in Microsoft Excel
How to Lock Cells in Microsoft Excel for ScrollingHow to Get Microsoft Excel to Round Up
How to Start a New Paragraph in Microsoft ExcelHow to Insert Check Boxes in Microsoft Excel
How to Change Horizontal Axis Values in Microsoft ExcelHow to Enable the Developer Tab in Microsoft Excel
How to Copy a Row in Microsoft ExcelHow to Delete Extra Pages in Microsoft Excel
How to Change a CSV File to Microsoft ExcelHow to Share and Edit Microsoft Excel Files
How to Find a P-Value in Microsoft ExcelHow to Compare Two Microsoft Excel Sheets for Duplicates
How to Delete a Chart in Microsoft ExcelHow to Put Dates in Order on Microsoft Excel
How to Freeze Both Rows and Columns in Microsoft ExcelHow to Recover a Corrupted Microsoft Excel File
How to Save a Microsoft Excel File as a CSVHow to Unprotect a Microsoft Excel Spreadsheet
How to Add Rows in Microsoft Excel Using a ShortcutHow to Do a Count in Microsoft Excel
How to Find the Sum of a Column in Microsoft ExcelHow to Make a Note in Microsoft Excel
How to Find the Slope on a Microsoft Excel GraphHow to Remove #DIV/0 in Microsoft Excel
How to Insert Symbols in Microsoft ExcelHow to Budget With Microsoft Excel
How to Reorder Rows in Microsoft ExcelHow to Calculate the Total in Microsoft Excel
How to Search a Microsoft Excel DocumentHow to Autofit Cells in Microsoft Excel
How to Get the Total in Microsoft ExcelHow to Get Rid of Dashed Lines in Excel
How to Find the P-Value in Microsoft ExcelHow to Sort by Alphabetical Order in Microsoft Excel
How to Make Sequential Numbers in Microsoft ExcelHow to Add Boxes in Microsoft Excel
How to Graph Using Microsoft ExcelHow to Change the Default Font in Microsoft Excel
How to Add Today's Date in Microsoft ExcelHow to Move Rows Up in Microsoft Excel
How to Delete a Tab in Microsoft ExcelHow to Freeze the First Two Rows in Microsoft Excel
How to Separate Words in Excel Using a FormulaHow to Rename a Microsoft Excel File
How to Budget on Microsoft ExcelHow to Budget in Microsoft Excel
How to Fix a Row in Microsoft ExcelHow to Extract Data From PDF to Microsoft Excel
How to Create Column Headers in Microsoft ExcelHow to Filter by Date in Microsoft Excel
How to Make a Grid in Microsoft ExcelHow to Total Columns in Microsoft Excel
How to Create a Rule in Microsoft ExcelHow to Fill Every Other Row in Microsoft Excel
How to Convert Currency in Microsoft ExcelHow to Do a Subtraction Formula in Microsoft Excel
How to Embed a Document in Microsoft ExcelHow to Delete Infinite Columns in Microsoft Excel
How to Insert an Arrow in Microsoft ExcelHow to Sign in in Microsoft Excel
How to Expand Rows in Microsoft ExcelHow to Enter in an Excel Cell
How to Anchor Cells in Microsoft ExcelHow to Plot a Graph in Microsoft Excel
How To Multiply 2 Cells in Microsoft ExcelHow to Make Microsoft Excel Files Smaller
bottom banner