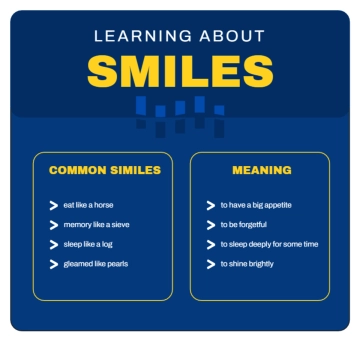
An educational T chart for comparing causes and effects, professionally designed by Template.net, with two columns of rounded gradient boxes and a bold title in vibrant orange, blue and yellow.
An educational T chart for comparing causes and effects, professionally designed by Template.net, with two columns of rounded gradient boxes and a bold title in vibrant orange, blue and yellow.