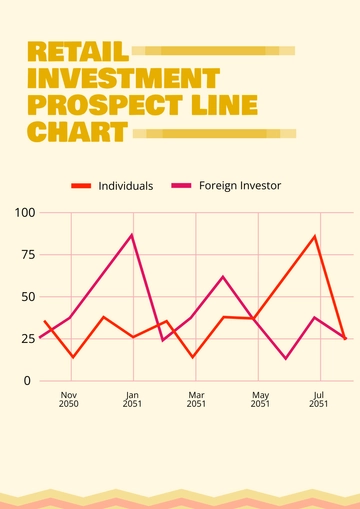
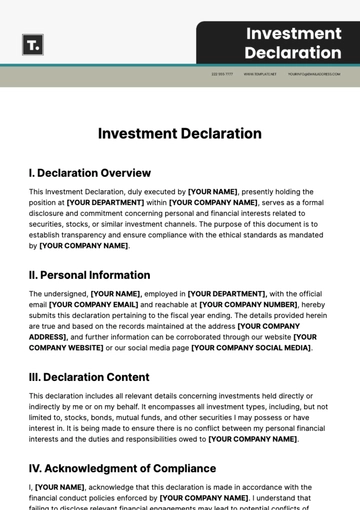
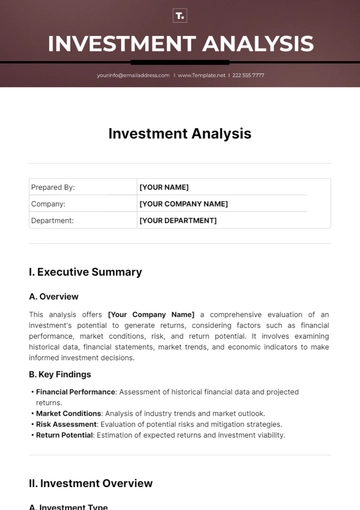
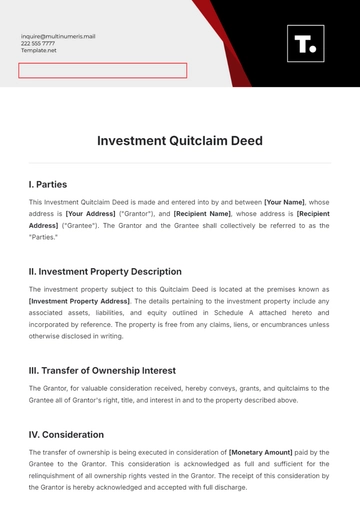
A professional 9:16 chart for presenting US green energy investment by state from 2020 to 2025, professionally designed by Template.net, with a grouped bar chart, a legend and a circular building photo in green, light green and white.
A professional 9:16 chart for presenting US green energy investment by state from 2020 to 2025, professionally designed by Template.net, with a grouped bar chart, a legend and a circular building photo in green, light green and white.