Get Access to World’s largest Template Library & Tools

How to Calculate the P-Value in Microsoft Excel


Microsoft Excel serves as a powerful tool for conducting statistical analyses, including the calculation of the P-value, a crucial metric in determining the significance of your research results. Whether you’re a professional conducting data analysis or a student tackling coursework, understanding how to calculate the P-value in Excel is essential.
How to Calculate the P-Value in Microsoft Excel


Calculating the P-value in Microsoft Excel is critical to providing insights into the significance of your findings. This guide outlines the essential steps to accurately determine the P-value, enhancing your ability to interpret research outcomes.

  • Step 1. Enter Your Data

    Start by entering your dataset into Excel, and organizing your data into two columns if you’re performing a two-sample test or a single column for a one-sample test. Label each column clearly to keep track of your variables.

  • Step 2. Use the Data Analysis ToolPak

    step 2 use the data analysis toolpak

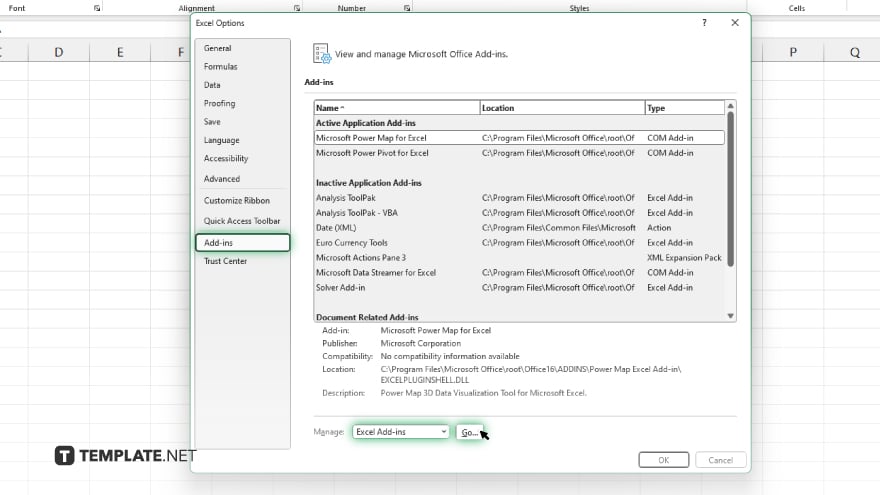
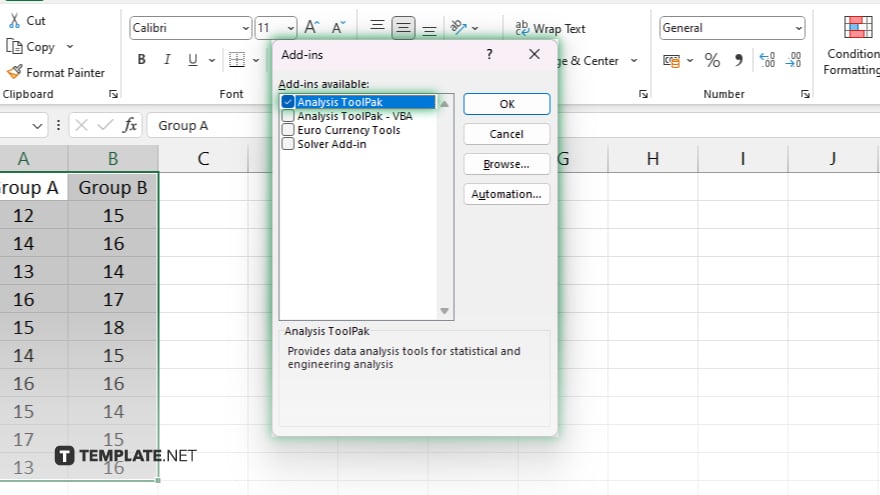
    To calculate the P-value, you’ll need to use Excel’s Data Analysis ToolPak. If it’s not already enabled, activate it by going to “File” > “Options” > “Add-Ins.” Choose “Excel Add-ins,” click “Go,”
    step 2 use the data analysis toolpak in microsoft excel

    then check the “Analysis ToolPak.” Finally, click “OK.”

  • Step 3. Select the Appropriate Statistical Test
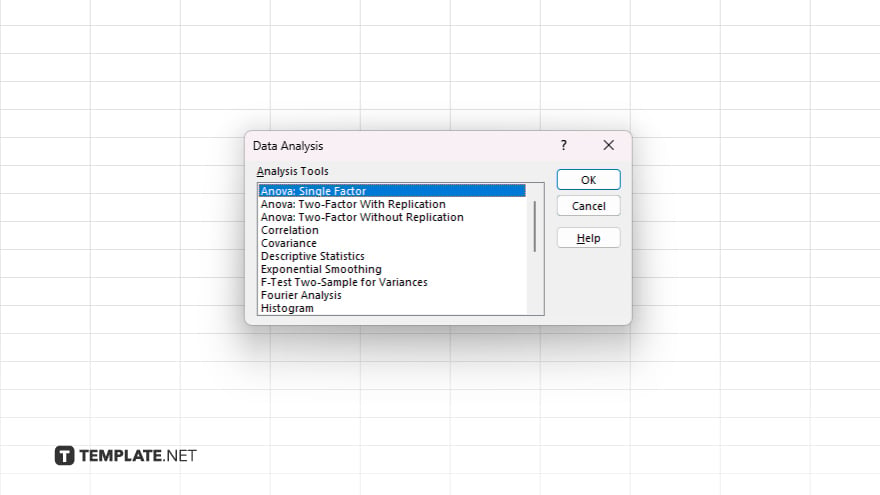
    step 3 select the appropriate statistical test

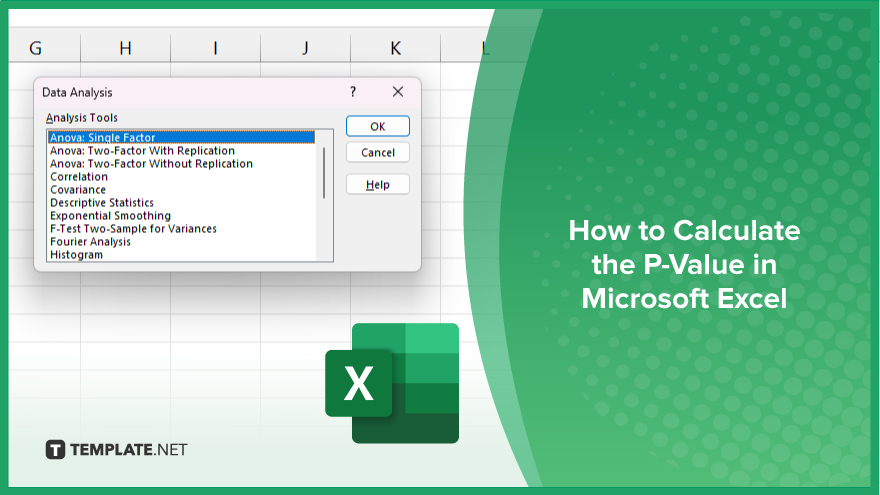
    Click on the “Data” tab, then “Data Analysis.” Choose the statistical test that corresponds to your data type and research question, such as T-test, ANOVA, or chi-square test, from the list provided by ToolPak.

  • Step 4. Input Your Data Range

    step 4 input your data range

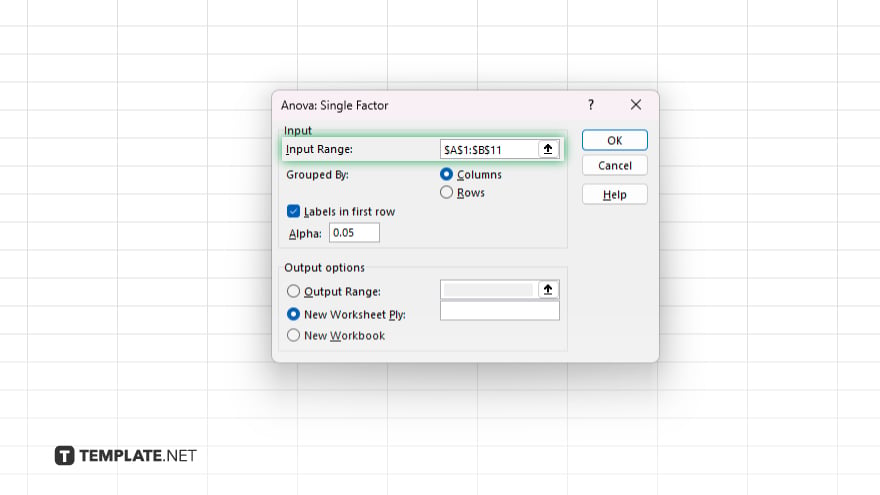
    In the dialogue box that appears after selecting your test, input the range of your data into the appropriate fields. Ensure you include label columns if they’re part of your data range and select the output range or new worksheet option for the results.

  • Step 5. Interpret the Results

    Once the analysis is complete, Excel will display the results, including the P-value, in the chosen output location. A P-value less than 0.05 typically indicates statistical significance, suggesting that the observed data are unlikely under the null hypothesis.

You may also find valuable insights in the following articles offering tips for Microsoft Excel:

note iconNote

Unlock Your Productivity with Over 100,000 Microsoft Excel Templates! Exclusively Available at Template.net – Download Now and Transform Your Data Handling Experience!

FAQs

What is the first step in calculating the P-value in Excel?

Enter your dataset into Excel, organizing it clearly in columns.

How do I activate the Data Analysis ToolPak in Excel?

Go to “File” > “Options” > “Add-Ins,” select “Excel Add-ins,” click “Go,” then check “Analysis ToolPak” and click “OK.”

Which statistical test should I choose to calculate the P-value?

Select a statistical test that matches your data type and research question, such as a T-test or ANOVA, from the Data Analysis ToolPak options.

Where do I input my data range for statistical analysis in Excel?

In the dialogue box for your chosen statistical test, input your data range into the fields provided.

How do I interpret the P-value in Excel?

A P-value less than 0.05 typically suggests your results are statistically significant, indicating a low probability that the observed findings occurred under the null hypothesis.

More in Excel

How to Clear the Microsoft Excel CacheHow to Ungroup in Microsoft Excel
How to Merge Tables in Microsoft ExcelHow to Run a Correlation in Microsoft Excel
How to Make a Row a Header in Microsoft ExcelHow to Count Highlighted Cells in Microsoft Excel
How To Move to Next Line in Microsoft ExcelHow to Insert Cells in Microsoft Excel
How to Copy Numbers in Excel Without the FormulaHow to Create an Invoice in Microsoft Excel
How to Find the Payback Period in Microsoft ExcelHow to Add a Secondary Vertical Axis in Microsoft Excel
How to Delete a Comment in Microsoft ExcelHow to Extend a Table in Microsoft Excel
How to Edit a Pivot Table in Microsoft ExcelHow to Compare Columns in Microsoft Excel
How to Run a Multiple Regression in Microsoft ExcelHow To Add Title to a Chart in Microsoft Excel
How to Merge Cells in Microsoft Excel on MacHow to Use a Slicer in Microsoft Excel
How to Edit a Graph in Microsoft ExcelHow to Delete Comments in Microsoft Excel
How to View Macros in Microsoft ExcelHow to Add Trend Lines in Microsoft Excel
How to Create a Balance Sheet in Microsoft ExcelHow to Copy and Paste a Formula in Microsoft Excel
How to Drag Numbers Down in Microsoft ExcelHow to Sort by Name in Microsoft Excel
How to Separate Addresses in Microsoft ExcelHow to Make a CSV File in Microsoft Excel
How to Wrap Cells in Microsoft ExcelHow to Show the Developer Tab in Microsoft Excel
How to Unfreeze Columns in Microsoft ExcelHow To Calculate Difference in Time in Excel
How To Read Excel Files in PythonHow to Switch Rows in Microsoft Excel
How To Go To the Next Line in an Excel CellHow to Make a Microsoft Excel Spreadsheet Shared
How to Use the TRIM Function in Microsoft ExcelHow to Add All Numbers in a Column in Excel
How to Remove Empty Rows in Excel at the BottomHow to Make Drop Downs in Microsoft Excel
How to Divide Columns in Microsoft ExcelHow to Freeze the Header Row in Microsoft Excel
How to Recover a Previous Version of an Excel FileHow to Pivot in Microsoft Excel
How to Use the INDIRECT Function in Microsoft ExcelHow to Copy Table from Microsoft Excel to Word
How to Make a Checkmark in Microsoft ExcelHow to Find and Remove Duplicates in Microsoft Excel
How to Freeze Columns and Rows in Microsoft ExcelHow To Enter to a New Line in Microsoft Excel
How To Do Pie Chart in Microsoft ExcelHow to Calculate Date Difference in Microsoft Excel
How To Multiply in Microsoft Excel FormulaHow To Find Duplicated Rows in Microsoft Excel
How To Compare 2 Columns in Microsoft ExcelHow to Make a Percentage Formula in Microsoft Excel
How to Unsort in Microsoft ExcelHow to Calculate CV in Microsoft Excel
How to Do a Chi-Square Test in Microsoft ExcelHow to Save a Microsoft Excel File
How to Make Microsoft Excel Read-OnlyHow To Put Excel in Alphabetical Order
How To Duplicate an Excel SpreadsheetHow To Add the Total of a Column in Microsoft Excel
How to Remove Auto Filters in Microsoft ExcelHow to Freeze the Second Row in Microsoft Excel
How to Auto-Sum in Microsoft ExcelHow to Unfreeze Microsoft Excel
How to Add Buttons in Microsoft ExcelHow to Set the Print Area in Microsoft Excel
How to Add a Macro in Microsoft ExcelHow to Add a Text Box in Microsoft Excel
How to Convert PDF to Microsoft Excel Without SoftwareHow to Make a Copy of an Excel Sheet
How to Create a Pivot Chart in Microsoft ExcelHow to Use Power Query in Microsoft Excel
How to Do Math in Microsoft ExcelHow to Apply Calculation Styles in Microsoft Excel
How to Make a Header Row in Microsoft ExcelHow to Read an Excel File in Python
How to Move Rows to Columns in Microsoft ExcelHow to Draw Lines in Microsoft Excel
How to Shift Columns in Microsoft ExcelHow to Convert a CSV File to Microsoft Excel
How to Hide a Worksheet in Microsoft ExcelHow to Count Values in Microsoft Excel
How to Use Microsoft Excel for BudgetingHow to Find Duplicate Values in Excel Using a Formula
How to Count the Number of Rows in Microsoft ExcelHow to Add Commas in Microsoft Excel
How to Automatically Number Rows in Microsoft ExcelHow to Return Within an Excel Cell
How to Get Rid of Blank Rows in Microsoft ExcelHow to Freeze Two Rows in Microsoft Excel
How to Make the Top Row in Microsoft Excel StayHow to Freeze Two Columns in Microsoft Excel
How to Adjust Page Breaks in Microsoft ExcelHow to Clear Formulas in Microsoft Excel
bottom banner