Get Access to World’s largest Template Library & Tools

How to Do a Scatter Plot in Microsoft Excel


Microsoft Excel is a powerful tool for visualizing data. One of its key features is the ability to create scatter plots, which display the relationship between two variables. In this guide, we’ll show you how to easily create scatter plots in Excel.
How to Do a Scatter Plot in Microsoft Excel


Whether you’re analyzing data for a school project or making business decisions, knowing how to create scatter plots can be incredibly useful. Here’s how:

  • Step 1. Prepare Your Data

    Ensure your data is organized with the independent variable (X-axis) in one column and the dependent variable (Y-axis) in another.

  • Step 2. Select Your Data

    Highlight the data you want to include in your scatter plot.

  • Step 3. Insert Scatter Plot

    step 3 insert scatter plot

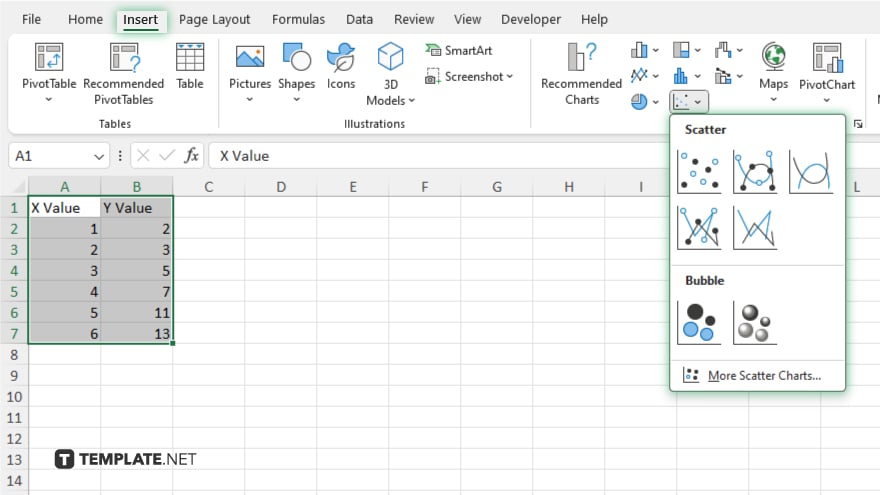
    Go to the “Insert” tab on the Excel ribbon and select “Scatter” from the Chart options.

  • Step 4. Choose Scatter Plot Type

    step 4 choose scatter plot type

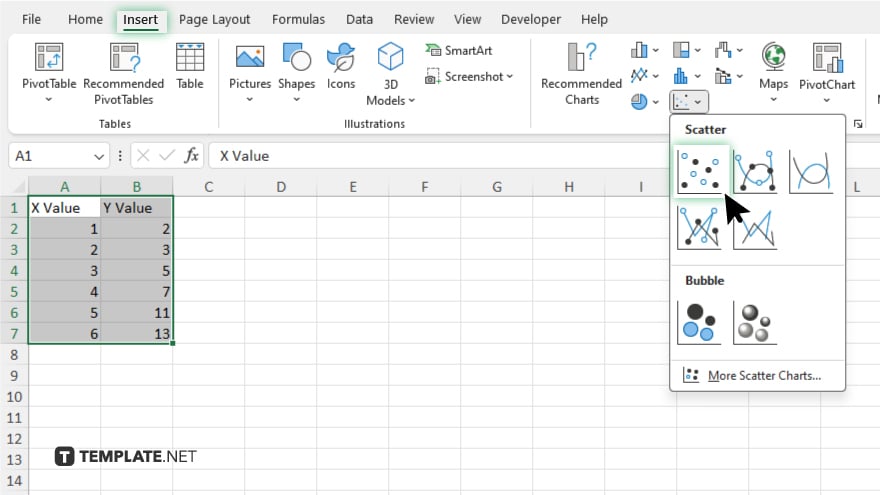
    Choose the scatter plot type that best fits your data. Options include simple scatter plots, scatter plots with smooth lines, or scatter plots with markers.

  • Step 5. Customize Your Plot

    step 5 customize your plot

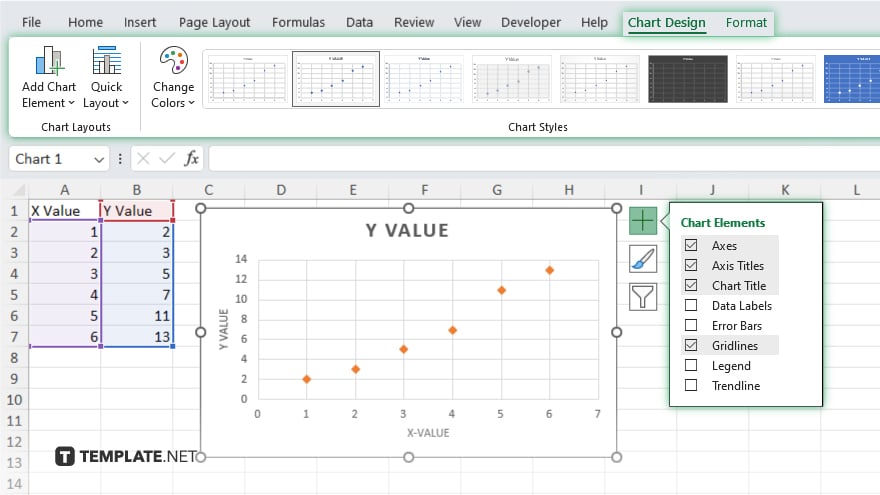
    Customize your scatter plot by adding titles, and labels, and adjusting the axis scales to make your data easier to interpret. Once satisfied with your scatter plot, finalize it by saving your Excel file or copying and pasting the plot into another document.

You may also find valuable insights in the following articles offering tips for Microsoft Excel:

note iconNote

Unlock Your Productivity with Over 100,000 Microsoft Excel Templates! Exclusively Available at Template.net – Download Now and Transform Your Data Handling Experience!

FAQs

How do I select data for a scatter plot in Excel?

Highlight the data you want to include in the plot.

Can I customize the appearance of my scatter plot?

You can add titles and labels and adjust axis scales to suit your preferences.

What if I have multiple sets of data for comparison?

Excel allows you to plot multiple data series on the same scatter plot for easy comparison.

Can I add trendlines to my scatter plot?

Yes, Excel allows adding trendlines to visualize trends in your data.

How do I save or share my scatter plot?

You can save your Excel file containing the scatter plot or copy and paste the plot into other documents or presentations.

More in Excel

How to Do Subtotals in Microsoft ExcelHow to Insert an Object in Microsoft Excel
How to Copy Rows in Microsoft ExcelHow to Get a Sum in Microsoft Excel
How to Put Exponents in Microsoft ExcelHow to Split Information in a Microsoft Excel Cell
How to Duplicate a Tab in Microsoft ExcelHow to Calculate R2 in Microsoft Excel
How to Consolidate Duplicates in Microsoft ExcelHow to Create Collapsible Rows in Microsoft Excel
How to Calculate the Coefficient of Variation in Microsoft ExcelHow to Insert a Microsoft Excel File in Word
How to Save a Microsoft Excel Sheet as PDFHow to Create a Box and Whisker Plot in Microsoft Excel
How to Disable Scroll Lock in Microsoft ExcelHow to Insert a Symbol in Microsoft Excel
How to Remove Minus Sign in Microsoft ExcelHow to Insert an Email into Microsoft Excel
How to Round in Microsoft Excel FormulaHow to Exit Header and Footer in Microsoft Excel
How to Add the Add-Ins in Microsoft ExcelHow to Find Blank Cells in Microsoft Excel
How to Shift Rows Up in Microsoft ExcelHow to Select a Range of Cells in Microsoft Excel
How to Get Solver on Microsoft ExcelHow to Create a Calculated Field in Microsoft Excel
How to Make a Paragraph in Microsoft ExcelHow to Create Mail Merge from Microsoft Excel
How to Use PV Function in Microsoft ExcelHow to Make an Org Chart in Microsoft Excel
How to Protect a Microsoft Excel WorksheetHow to Add a Vertical Line in Excel Graph
How to Add Macros in Microsoft ExcelHow to Convert a Formula to a Number in Microsoft Excel
How To Add the Total Column in Microsoft ExcelHow to Add an Equation in a Microsoft Excel Graph
How to Autofill Formulas in Microsoft ExcelHow to Get Unique Values in Microsoft Excel
How to Find Correlation on Microsoft ExcelHow to Pin the Top Row in Microsoft Excel
How to Insert a Row Below in Microsoft ExcelHow to Copy a Table in Microsoft Excel
How to Drag Columns in Microsoft ExcelHow to Download a Microsoft Excel Sheet
How to Apply Borders in Microsoft ExcelHow to Format a Microsoft Excel Sheet
How to Rename Tables in Microsoft ExcelHow to Duplicate Cells in Microsoft Excel
How to Calculate the Sum in Microsoft ExcelHow to Capitalize All Words in Microsoft Excel
How to Share a Document in Microsoft ExcelHow To Share a Microsoft Excel Spreadsheet
How to Unfreeze Cells in Microsoft ExcelHow to Find R in Microsoft Excel
How to Fix a Cell in Microsoft ExcelHow to 'Enter' to the Next Line in Microsoft Excel
How to Create Sparklines in Microsoft ExcelHow to Do Absolute Reference in Microsoft Excel
How to Copy a Microsoft Excel Formula Down a ColumnHow to Add Superscript in Microsoft Excel
How to Use INDIRECT in Microsoft ExcelHow to Add a Button in Microsoft Excel
How to Do Percentage Change in Microsoft ExcelHow to Add Drop-Down Options in Microsoft Excel
How to Separate Cells in Microsoft ExcelHow to Calculate Mortgage Payments in Microsoft Excel
How to Add a Percentage to a Number in ExcelHow to Create a Two Variable Data Table in Excel
How To Calculate Number of Days Between Dates in ExcelHow to Change Language in Microsoft Excel
How to Recover Lost Microsoft Excel FilesHow to Remove Space After Text in Microsoft Excel
How to Delete Unused Rows in Microsoft ExcelHow to Do Percent Change in Microsoft Excel
How to Find the Sum in Microsoft ExcelHow To Remove Watermarks from Microsoft Excel
How to Add Comments in Microsoft ExcelHow to Insert Exponents in Microsoft Excel
How to Do Calculations in Microsoft ExcelHow to Convert Uppercase to Lowercase in Microsoft Excel
How to Make a Microsoft Excel Sheet SharedHow to Clear a Microsoft Excel Clipboard
How to See a Formula in Microsoft ExcelHow to Delete Duplicate Names in Microsoft Excel
How to Import CSV to Microsoft ExcelHow to Combine Two Rows in Microsoft Excel
How to Count Letters in Microsoft ExcelHow to Duplicate Sheets in Microsoft Excel
How to Calculate Percentage Increase in Microsoft ExcelHow to Delete Charts in Microsoft Excel
How to Unpivot Data in Microsoft ExcelHow to Add a Legend to a Chart in Microsoft Excel
How to Use the Roundup Function in Microsoft ExcelHow to Create a Control Chart in Microsoft Excel
How to Close Headers and Footers in Microsoft ExcelHow to Calculate Percent Increase in Microsoft Excel
How to Put a Dropdown in Microsoft ExcelHow to Make a Control Chart in Microsoft Excel
How to Remove Zeros in Microsoft ExcelHow to Type Exponents in Microsoft Excel
bottom banner