Get Access to World’s largest Template Library & Tools

How to Do Multiple Regression in Microsoft Excel

Microsoft Excel facilitates advanced data analysis through multiple regression, a statistical method that predicts outcomes based on multiple variables. Learn how the process works to understand complex relationships within their data and make data-driven decisions effectively.
How to Do Multiple Regression in Microsoft Excel


Multiple regression in Microsoft Excel allows you to explore the relationship between one dependent variable and two or more independent variables. This technique is invaluable for predicting outcomes and understanding which factors significantly impact your results. Here’s how to conduct a multiple regression analysis in Excel.

  • Step 1. Prepare Your Data

    Organize your data in Excel with the dependent variable in one column and each independent variable in its column. Ensure there are no missing values and that your data is clean and formatted correctly.

  • Step 2. Enable the ‘Data Analysis ToolPak’

    To perform regression, you first enable the “Data Analysis ToolPak” if it’s not already active. Go to the “File” menu, select “Options,” then “Add-ins.” Choose “Excel Add-ins” in the “Manage” box, click “Go,” and then check “Analysis ToolPak” and click “OK.”

  • Step 3. Set Up the Regression Analysis
    step 3 set up the regression analysis

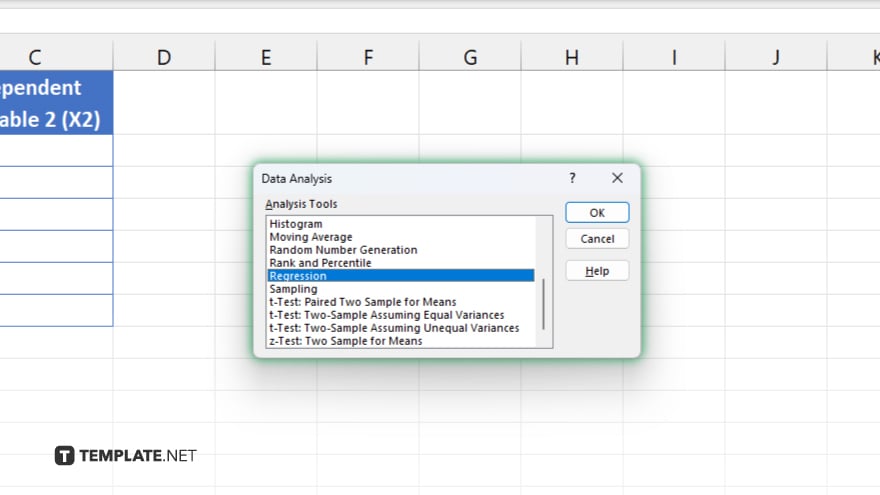
    Once the “Analysis ToolPak” is enabled, click on the “Data” tab on the ribbon, then select “Data Analysis.” Choose “Regression” from the list of analysis tools and click “OK.”

  • Step 4. Configure the ‘Regression’ Settings
    step 4 configure the regression settings

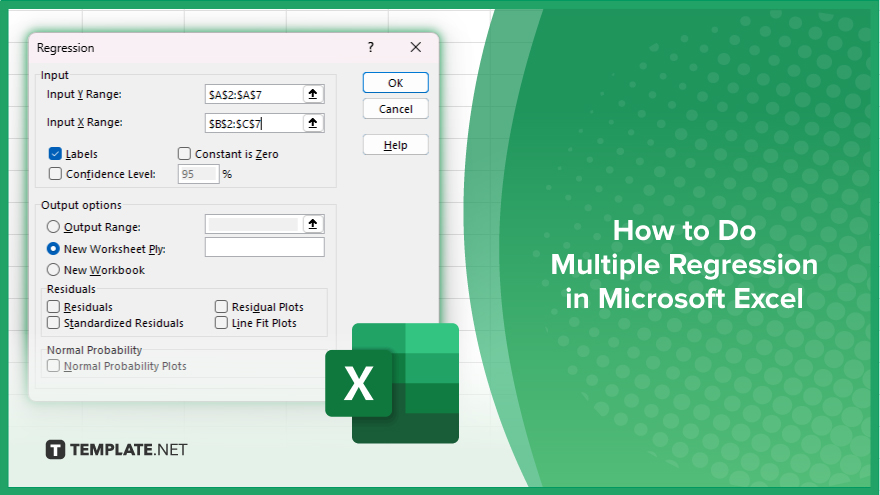
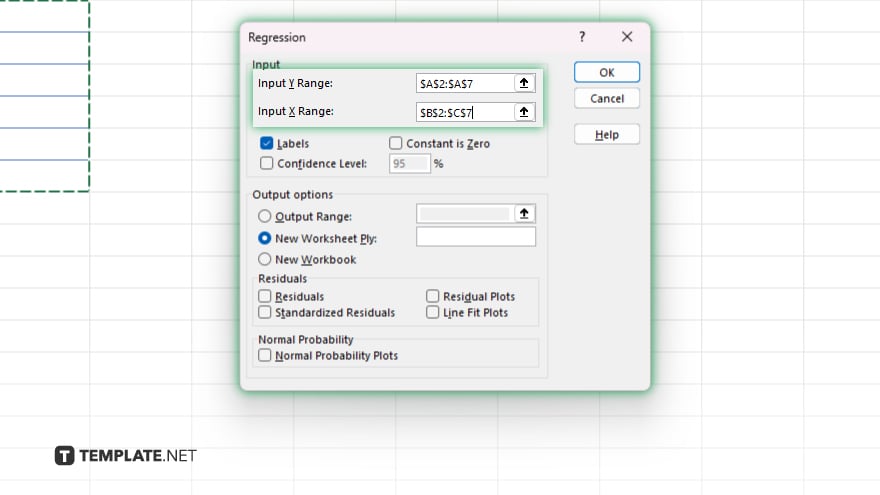
    In the “Regression” dialog box, input the cell range for your dependent variable in the “Y Range” box and the cell ranges for your independent variables in the “X Range” box. Ensure to select the “Labels” checkbox if your data range includes labels for easy identification.

  • Step 5. Run the Regression

    step 5 run the regression

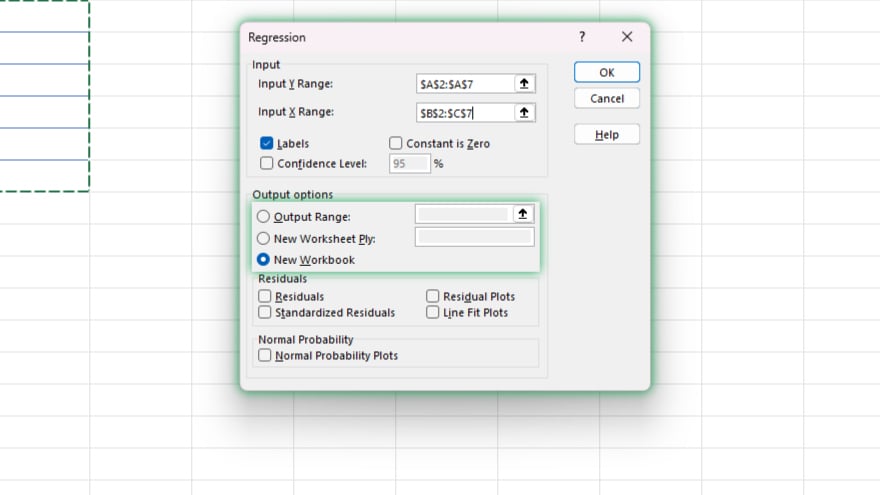
    Choose where you want the output displayed, either on a new worksheet or an existing one. Check additional options as needed, such as residuals or standardized residuals, to enhance your analysis. Click “OK” to run the regression, and Excel will display the regression analysis results, including coefficients, R-squared values, and other statistical data, allowing you to interpret the impact of each independent variable on the dependent variable.

You may also find valuable insights in the following articles offering tips for Microsoft Excel:

note iconNote

Unlock Your Productivity with Over 100,000 Microsoft Excel Templates! Exclusively Available at Template.net – Download Now and Transform Your Data Handling Experience!

FAQs

Can I use multiple regression in Excel for categorical variables?

Yes, but you need to convert categorical variables into numerical data through dummy coding before performing regression.

What is the maximum number of independent variables I can include in a multiple regression in Excel?

Excel can handle multiple regression analyses with up to 16 independent variables, though practical limits depend on data quality and spreadsheet size.

How do I interpret the R-squared value in multiple regression?

The R-squared value represents the proportion of variance in the dependent variable that is predictable from the independent variables.

Can multiple regression in Excel handle missing data?

Excel does not automatically handle missing data in regression; you must either fill in these gaps or exclude incomplete records before analysis.

Is it possible to perform logistic regression in Excel?

Yes. You can perform logistic regression in Excel using additional add-ins like the “Analysis ToolPak” or through more advanced methods involving Excel’s built-in functions.

More in Excel

How to Clear the Microsoft Excel CacheHow to Ungroup in Microsoft Excel
How to Merge Tables in Microsoft ExcelHow to Run a Correlation in Microsoft Excel
How to Make a Row a Header in Microsoft ExcelHow to Count Highlighted Cells in Microsoft Excel
How To Move to Next Line in Microsoft ExcelHow to Insert Cells in Microsoft Excel
How to Copy Numbers in Excel Without the FormulaHow to Create an Invoice in Microsoft Excel
How to Find the Payback Period in Microsoft ExcelHow to Add a Secondary Vertical Axis in Microsoft Excel
How to Delete a Comment in Microsoft ExcelHow to Extend a Table in Microsoft Excel
How to Edit a Pivot Table in Microsoft ExcelHow to Compare Columns in Microsoft Excel
How to Run a Multiple Regression in Microsoft ExcelHow To Add Title to a Chart in Microsoft Excel
How to Merge Cells in Microsoft Excel on MacHow to Use a Slicer in Microsoft Excel
How to Edit a Graph in Microsoft ExcelHow to Delete Comments in Microsoft Excel
How to View Macros in Microsoft ExcelHow to Add Trend Lines in Microsoft Excel
How to Create a Balance Sheet in Microsoft ExcelHow to Copy and Paste a Formula in Microsoft Excel
How to Drag Numbers Down in Microsoft ExcelHow to Sort by Name in Microsoft Excel
How to Separate Addresses in Microsoft ExcelHow to Make a CSV File in Microsoft Excel
How to Wrap Cells in Microsoft ExcelHow to Show the Developer Tab in Microsoft Excel
How to Unfreeze Columns in Microsoft ExcelHow To Calculate Difference in Time in Excel
How To Read Excel Files in PythonHow to Switch Rows in Microsoft Excel
How To Go To the Next Line in an Excel CellHow to Make a Microsoft Excel Spreadsheet Shared
How to Use the TRIM Function in Microsoft ExcelHow to Add All Numbers in a Column in Excel
How to Remove Empty Rows in Excel at the BottomHow to Make Drop Downs in Microsoft Excel
How to Divide Columns in Microsoft ExcelHow to Freeze the Header Row in Microsoft Excel
How to Recover a Previous Version of an Excel FileHow to Pivot in Microsoft Excel
How to Use the INDIRECT Function in Microsoft ExcelHow to Copy Table from Microsoft Excel to Word
How to Make a Checkmark in Microsoft ExcelHow to Find and Remove Duplicates in Microsoft Excel
How to Freeze Columns and Rows in Microsoft ExcelHow To Enter to a New Line in Microsoft Excel
How To Do Pie Chart in Microsoft ExcelHow to Calculate Date Difference in Microsoft Excel
How To Multiply in Microsoft Excel FormulaHow To Find Duplicated Rows in Microsoft Excel
How To Compare 2 Columns in Microsoft ExcelHow to Make a Percentage Formula in Microsoft Excel
How to Unsort in Microsoft ExcelHow to Calculate CV in Microsoft Excel
How to Do a Chi-Square Test in Microsoft ExcelHow to Save a Microsoft Excel File
How to Make Microsoft Excel Read-OnlyHow To Put Excel in Alphabetical Order
How To Duplicate an Excel SpreadsheetHow To Add the Total of a Column in Microsoft Excel
How to Remove Auto Filters in Microsoft ExcelHow to Freeze the Second Row in Microsoft Excel
How to Auto-Sum in Microsoft ExcelHow to Unfreeze Microsoft Excel
How to Add Buttons in Microsoft ExcelHow to Set the Print Area in Microsoft Excel
How to Add a Macro in Microsoft ExcelHow to Add a Text Box in Microsoft Excel
How to Convert PDF to Microsoft Excel Without SoftwareHow to Make a Copy of an Excel Sheet
How to Create a Pivot Chart in Microsoft ExcelHow to Use Power Query in Microsoft Excel
How to Do Math in Microsoft ExcelHow to Apply Calculation Styles in Microsoft Excel
How to Make a Header Row in Microsoft ExcelHow to Read an Excel File in Python
How to Move Rows to Columns in Microsoft ExcelHow to Draw Lines in Microsoft Excel
How to Shift Columns in Microsoft ExcelHow to Convert a CSV File to Microsoft Excel
How to Hide a Worksheet in Microsoft ExcelHow to Count Values in Microsoft Excel
How to Use Microsoft Excel for BudgetingHow to Find Duplicate Values in Excel Using a Formula
How to Count the Number of Rows in Microsoft ExcelHow to Add Commas in Microsoft Excel
How to Automatically Number Rows in Microsoft ExcelHow to Return Within an Excel Cell
How to Get Rid of Blank Rows in Microsoft ExcelHow to Freeze Two Rows in Microsoft Excel
How to Make the Top Row in Microsoft Excel StayHow to Freeze Two Columns in Microsoft Excel
How to Adjust Page Breaks in Microsoft ExcelHow to Clear Formulas in Microsoft Excel
bottom banner