Get Access to World’s largest Template Library & Tools

How To Do Sensitivity Analysis in Microsoft Excel

Microsoft Excel is an ideal tool for conducting sensitivity analysis, essential for assessing the impact of varying inputs on outputs in your models. Whether you’re evaluating business financials, engineering projects, or market research data, this type of analysis helps give a clear pathway to understanding how changes in assumptions affect your outcomes, enhancing your strategic planning and risk management.
How To Do Sensitivity Analysis in Microsoft Excel


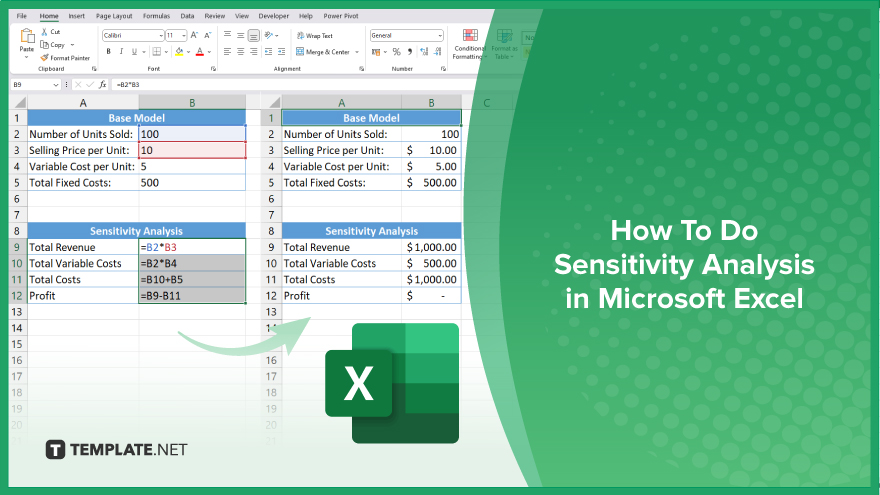
Sensitivity analysis in Microsoft Excel is a valuable technique to explore how different inputs affect outcomes. This method is crucial for financial modeling, risk assessment, and decision-making processes. Here’s how you can perform sensitivity analysis efficiently in Excel.

  • Step 1. Set Up Your Base Model

    step 1 set up your base model

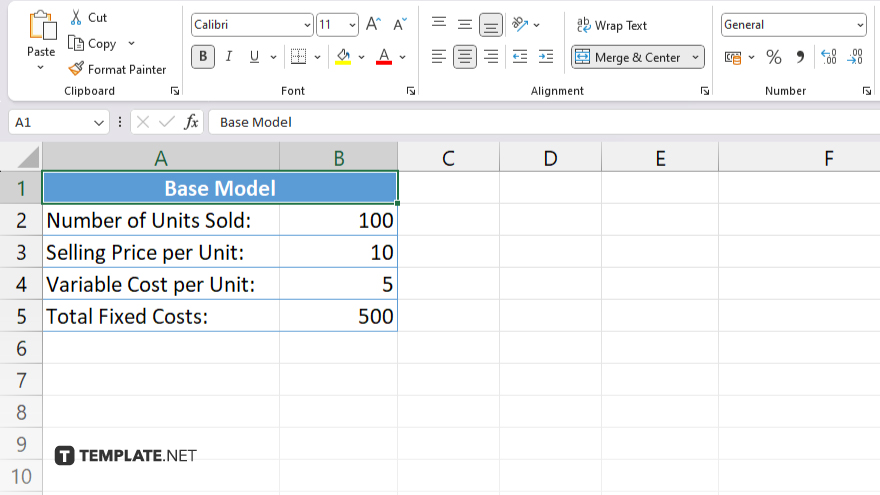
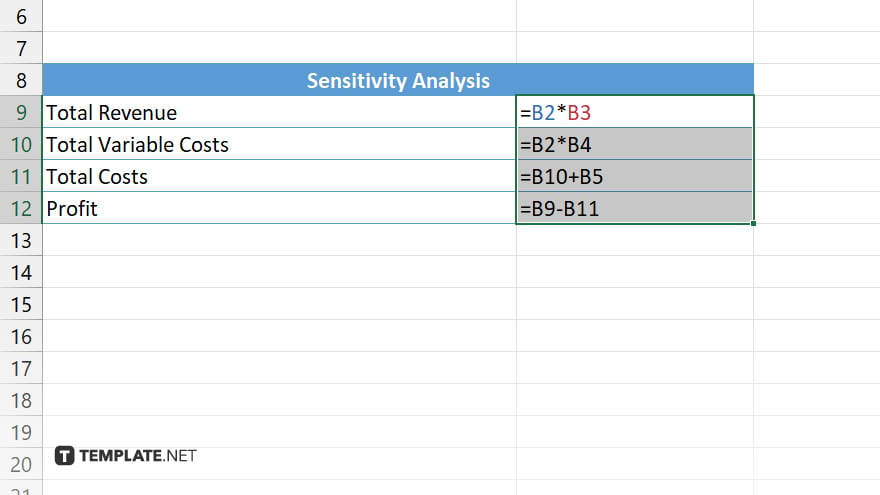
    Begin by setting up a base model in Excel. This model should include all relevant variables whose impact you wish to analyze. Ensure that your model is correctly formulated with formulas and inputs that accurately reflect the scenario you are examining.

  • Step 2. Identify Key Variables

    step 2 identify key variables

    Select the key variables for which you want to test sensitivity. These could be input costs, revenue assumptions, interest rates, or any other factors that significantly influence the output of your model.

  • Step 3. Create Data Tables

    Use Excel’s data table feature to perform sensitivity analysis. To set up a data table, go to the “Data” tab on the ribbon, click “What-If Analysis,” and select “Data Table.” Arrange your variable values in a row or column next to your base model for easy comparison.

  • Step 4. Configure the Data Table

    In the data table setup, link the row or column input cells to your key variables. This connection allows the data table to alter the values of these variables systematically. Specify the output cell where Excel will display the results of each input combination in your model.

  • Step 5. Analyze and Interpret Results

    Once your data table is complete, analyze the results to see how changes in the input variables affect the outcome. Look for trends or significant changes in the outputs, which will help you understand the sensitivity of your model to different variables.

You may also find valuable insights in the following articles offering tips for Microsoft Excel:

note iconNote

Unlock Your Productivity with Over 100,000 Microsoft Excel Templates! Exclusively Available at Template.net – Download Now and Transform Your Data Handling Experience!

FAQs

What is a data table in Excel and how is it used for sensitivity analysis?

A data table in Excel allows you to vary inputs for one or two variables and observe how those changes impact the outputs, making it ideal for sensitivity analysis.

Can I perform sensitivity analysis with more than two variables at once in Excel?

Excel’s built-in features limit sensitivity analysis to one or two variables at a time, but more complex scenarios may require advanced techniques or software.

How do I ensure accurate results in sensitivity analysis in Excel?

Ensure your base model is correctly set up with accurate formulas and that all variable inputs reflect realistic and relevant scenarios.

Is there a way to visualize the results of sensitivity analysis in Excel?

Yes. You can visualize the results using charts such as line graphs or scatter plots, which can help illustrate how outputs change with different inputs.

What should I do if my sensitivity analysis shows that the output is highly sensitive to certain inputs?

If your analysis indicates high sensitivity to certain inputs, consider further investigating those variables or implementing risk management strategies to mitigate potential impacts.

More in Excel

How to Remove Part of Text in an Excel CellHow to Add Strikethrough in Microsoft Excel
How to Add Drop Downs in Microsoft ExcelHow to Extract the Month from a Date in Microsoft Excel
How to Add a Zero in Front of a Number in Microsoft ExcelHow to Change Cell Color in Microsoft Excel
How to Add a Row in Microsoft Excel Using a ShortcutHow to Find R^2 in Microsoft Excel
How to Move to the Next Line in Microsoft ExcelHow to Calculate ROI in Microsoft Excel
How to Add a Tab in Microsoft ExcelHow to Create Lines in Microsoft Excel
How to Rotate Cells in Microsoft ExcelHow to Type Vertically in Microsoft Excel
How to Insert a Comma in Microsoft ExcelHow to Change Page Orientation in Microsoft Excel
How to Turn Off Read Only in Microsoft ExcelHow to Change to All Caps in Microsoft Excel
How to Download a Microsoft Excel FileHow to Share a Microsoft Excel File
How to Multiply 2 Columns in Microsoft ExcelHow to Get Rid of Empty Rows in Microsoft Excel
How to Find in Microsoft ExcelHow to Calculate Future Value in Microsoft Excel
How to Share a Microsoft Excel File with Multiple UsersHow to Make a Flow Chart in Microsoft Excel
How to Use If Then in Microsoft ExcelHow to Insert Numbers in Microsoft Excel
How to Draw a Line Through Text in Microsoft ExcelHow to Create a Forecast Sheet in Microsoft Excel
How to Resize Cells in Microsoft ExcelHow to Lock a Microsoft Excel File
How to AutoSum in Microsoft ExcelHow to Take Off Read Only in Microsoft Excel
How to Share Excel Files for Multiple Users Office 365How to Create Charts in Microsoft Excel
How to Start a New Line in Microsoft ExcelHow To Make a Map in Microsoft Excel
How to Remove a Table Microsoft ExcelHow to Join Cells in Microsoft Excel
How to Create a Microsoft Excel TemplateHow to Change the Date in Microsoft Excel
How to Turn Off Protected View in Microsoft ExcelHow to Add Numbers in a Microsoft Excel Column
How to Remove Duplicate Names in Microsoft ExcelHow to Fit a Microsoft Excel Sheet on One Page
How to Make an Interactive Calendar in Microsoft ExcelHow to Shrink Text to Fit Within Excel Cells
How to Clear the Microsoft Excel CacheHow to Ungroup in Microsoft Excel
How to Merge Tables in Microsoft ExcelHow to Run a Correlation in Microsoft Excel
How to Make a Row a Header in Microsoft ExcelHow to Count Highlighted Cells in Microsoft Excel
How To Move to Next Line in Microsoft ExcelHow to Insert Cells in Microsoft Excel
How to Copy Numbers in Excel Without the FormulaHow to Create an Invoice in Microsoft Excel
How to Find the Payback Period in Microsoft ExcelHow to Add a Secondary Vertical Axis in Microsoft Excel
How to Delete a Comment in Microsoft ExcelHow to Extend a Table in Microsoft Excel
How to Edit a Pivot Table in Microsoft ExcelHow to Compare Columns in Microsoft Excel
How to Run a Multiple Regression in Microsoft ExcelHow To Add Title to a Chart in Microsoft Excel
How to Merge Cells in Microsoft Excel on MacHow to Use a Slicer in Microsoft Excel
How to Edit a Graph in Microsoft ExcelHow to Delete Comments in Microsoft Excel
How to View Macros in Microsoft ExcelHow to Add Trend Lines in Microsoft Excel
How to Create a Balance Sheet in Microsoft ExcelHow to Copy and Paste a Formula in Microsoft Excel
How to Drag Numbers Down in Microsoft ExcelHow to Sort by Name in Microsoft Excel
How to Separate Addresses in Microsoft ExcelHow to Make a CSV File in Microsoft Excel
How to Wrap Cells in Microsoft ExcelHow to Show the Developer Tab in Microsoft Excel
How to Unfreeze Columns in Microsoft ExcelHow To Calculate Difference in Time in Excel
How To Read Excel Files in PythonHow to Switch Rows in Microsoft Excel
How To Go To the Next Line in an Excel CellHow to Make a Microsoft Excel Spreadsheet Shared
How to Use the TRIM Function in Microsoft ExcelHow to Add All Numbers in a Column in Excel
How to Remove Empty Rows in Excel at the BottomHow to Make Drop Downs in Microsoft Excel
How to Divide Columns in Microsoft ExcelHow to Freeze the Header Row in Microsoft Excel
How to Recover a Previous Version of an Excel FileHow to Pivot in Microsoft Excel
How to Use the INDIRECT Function in Microsoft ExcelHow to Copy Table from Microsoft Excel to Word
How to Make a Checkmark in Microsoft ExcelHow to Find and Remove Duplicates in Microsoft Excel
How to Freeze Columns and Rows in Microsoft ExcelHow To Enter to a New Line in Microsoft Excel
bottom banner