Get Access to World’s largest Template Library & Tools

How to Make a Dashboard in Microsoft Excel


Microsoft Excel is not just a tool for managing data; it’s also a powerful platform for creating dynamic dashboards. Learn how to design a dashboard that brings your data to life, whether you’re looking to monitor business performance, track personal finances, or compile academic research.
How to Make a Dashboard in Microsoft Excel


Crafting a dashboard in Microsoft Excel allows you to visually aggregate and present your most important data, enabling quick insights and effective decision-making. This guide outlines the fundamental steps to create a dashboard that is both informative and visually appealing.

  • Step 1. Gather and Prepare Your Data

    step 1 gather and prepare your data

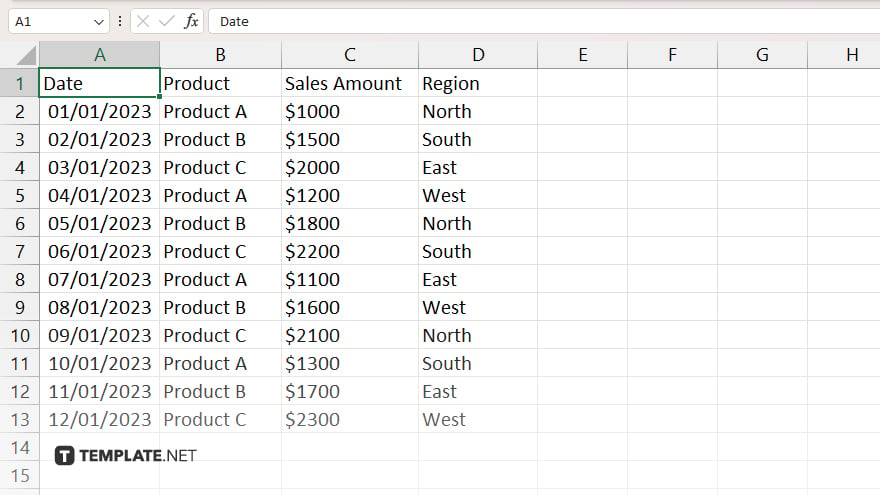
    Begin by compiling all the data you want to include in your dashboard. Organize this data in a clear, structured format within Excel, ensuring it’s clean and accurate. This might involve consolidating data from various sources into a single Excel workbook.

  • Step 2. Plan Your Dashboard Layout

    Before diving into the creation process, sketch out a rough layout of your dashboard. Decide which data points are most important and how you want to display them. Consider using a mix of charts, tables, and graphs to show different types of information.

  • Step 3. Create PivotTables for Data Summarization
    step 3 create pivottables for data summarization

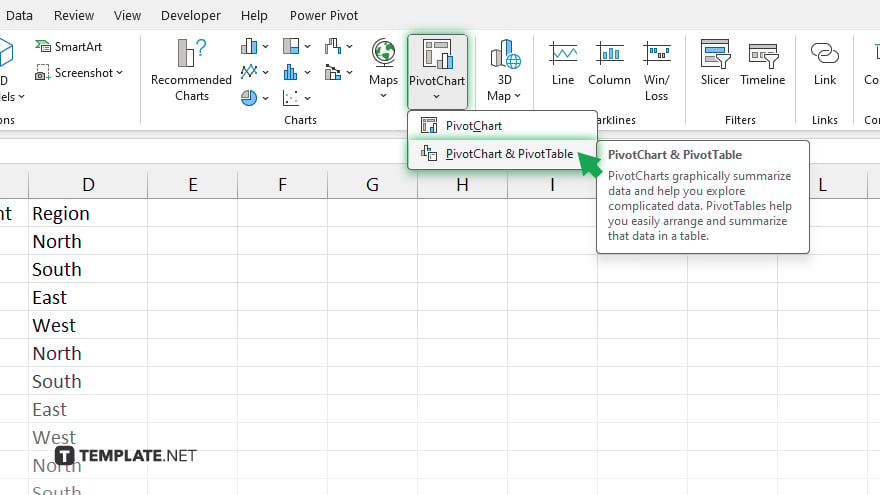
    Use PivotTables to summarize, analyze, sort, and present your data in an easy-to-read format. To create a PivotTable, select your data, go to the ‘Insert’ tab, and click ‘PivotTable.’ From here, you can choose the data you wish to analyze and how it should be displayed.

  • Step 4. Use Charts to Visualize Data

    Charts are a key component of dashboards, providing visual representations of your data. Excel offers a variety of chart types, including bar, line, pie, and more. To insert a chart, highlight the relevant data, go to the ‘Insert’ tab, and select the chart type that best represents your data.

  • Step 5. Assemble Your Dashboard

    With your PivotTables and charts prepared, begin assembling your dashboard on a new Excel sheet. Arrange your visualizations according to your layout plan, adjusting sizes and formats for clarity and visual appeal. Ensure your dashboard is easy to read and understand at a glance.

You may also find valuable insights in the following articles offering tips for Microsoft Excel:

note iconNote

Unlock Your Productivity with Over 100,000 Microsoft Excel Templates! Exclusively Available at Template.net – Download Now and Transform Your Data Handling Experience!

FAQs

What is the best way to update my Excel dashboard with new data?

Update the underlying data range or refresh your PivotTables and charts will automatically reflect the new information.

Can I link multiple data sources to a single Excel dashboard?

Yes, you can consolidate multiple data sources into your Excel workbook and use them to create a comprehensive dashboard.

How do I make my Excel dashboard interactive?

Incorporate slicers, dropdown lists, or form controls to allow users to interact with your dashboard, filtering and sorting data as needed.

Is it possible to share my Excel dashboard with others who don’t have Excel?

You can share your dashboard by saving it as a PDF or publishing it to Microsoft Power BI for online access.

How can I ensure my Excel dashboard is easy to understand?

Use clear labels, a consistent design theme, and limit the number of visual elements to avoid clutter, ensuring your dashboard communicates the intended insights effectively.

More in Excel

How to Graph Using Microsoft ExcelHow to Change the Default Font in Microsoft Excel
How to Add Today's Date in Microsoft ExcelHow to Move Rows Up in Microsoft Excel
How to Delete a Tab in Microsoft ExcelHow to Freeze the First Two Rows in Microsoft Excel
How to Separate Words in Excel Using a FormulaHow to Rename a Microsoft Excel File
How to Budget on Microsoft ExcelHow to Budget in Microsoft Excel
How to Fix a Row in Microsoft ExcelHow to Extract Data From PDF to Microsoft Excel
How to Create Column Headers in Microsoft ExcelHow to Filter by Date in Microsoft Excel
How to Make a Grid in Microsoft ExcelHow to Total Columns in Microsoft Excel
How to Create a Rule in Microsoft ExcelHow to Fill Every Other Row in Microsoft Excel
How to Convert Currency in Microsoft ExcelHow to Do a Subtraction Formula in Microsoft Excel
How to Embed a Document in Microsoft ExcelHow to Delete Infinite Columns in Microsoft Excel
How to Insert an Arrow in Microsoft ExcelHow to Sign in in Microsoft Excel
How to Expand Rows in Microsoft ExcelHow to Enter in an Excel Cell
How to Anchor Cells in Microsoft ExcelHow to Plot a Graph in Microsoft Excel
How To Multiply 2 Cells in Microsoft ExcelHow to Make Microsoft Excel Files Smaller
How to Update Microsoft Excel on MacHow to Add a Second Vertical Axis in Microsoft Excel
How to Get a Percentage in Microsoft ExcelHow to Embed a Microsoft Excel File in Word
How to Make a Flowchart in Microsoft ExcelHow to Hide Sheets in Microsoft Excel
How to Show the Formula Bar in Microsoft ExcelHow to Delete Excess Columns in Microsoft Excel
How to Use VLOOKUP in Excel with Two SheetsHow to Unfreeze in Microsoft Excel
How to Press Enter in Excel and Stay in the Same CellHow to Remove Letters from a Cell in Microsoft Excel
How To Apply the Accounting Number Format in ExcelHow to Keep a Row Fixed in Microsoft Excel
How to Goal Seek in Microsoft ExcelHow to Insert a Comment in Microsoft Excel
How to Find Merged Cells in Microsoft ExcelHow to Unshare a Microsoft Excel File
How to Export a PDF to Microsoft ExcelHow to Calculate Z-Score in Microsoft Excel
How to Remove Comments in Microsoft ExcelHow to Do Covariance in Microsoft Excel
How to Use a Data Table in Microsoft ExcelHow to Use the Rank Function in Microsoft Excel
How to Sum on Microsoft ExcelHow to Unlock Scroll Lock in Microsoft Excel
How to Open VBA in Microsoft ExcelHow to Do Strikethrough on Microsoft Excel
How to Repair a Corrupted Microsoft Excel FileHow to Add a Bullet Point in Microsoft Excel
How to Create Drop Downs in Microsoft ExcelHow to Change the Background Color in Microsoft Excel
How To Calculate Percentage Increase or Decrease in ExcelHow to Refresh Formulas in Microsoft Excel
How to Insert a Graph in Microsoft ExcelHow to Allow Multiple Users to Edit Microsoft Excel
How to Create a Scenario in Microsoft ExcelHow to Combine Two Graphs in Microsoft Excel
How to Search on Microsoft Excel SheetsHow to Strike Out in Microsoft Excel
How to Make a Copy of a Sheet in Microsoft ExcelHow to Delete a Line in Microsoft Excel
How to Make a Comparison Chart in Microsoft ExcelHow to Change Axis Titles in Microsoft Excel
How to Center Across Selection in Microsoft ExcelHow to Clear the Clipboard in Microsoft Excel
How to Switch Rows to Columns in Microsoft ExcelHow to Do Absolute Value in Microsoft Excel
How to Save in Microsoft ExcelHow to Merge in Microsoft Excel
How to Do a Correlation in Microsoft ExcelHow to Use Sum in Microsoft Excel
How to Keep a Cell Constant in Microsoft ExcelHow to Save a Microsoft Excel File as CSV
How to Add a Leading Zero in Microsoft ExcelHow to Use the Round Function in Microsoft Excel
How to Do Regression in Microsoft ExcelHow to Divide on Microsoft Excel
How to Calculate Age in Excel DD/MM/YYYYHow to Add a Calendar Drop Down in Microsoft Excel
How to Use a Drop Down List in Microsoft ExcelHow to Remove Blank Spaces in Microsoft Excel
How to Print Grid Lines in Microsoft ExcelHow to Insert a Line Break in Microsoft Excel
How To Create a Percentage Formula in Microsoft ExcelHow to Add Two Cells in Microsoft Excel
How to Make a Line Chart in Microsoft ExcelHow to Add Data to a Chart in Microsoft Excel
How to Select Rows in Microsoft ExcelHow to Make Alternating Colors in Microsoft Excel
bottom banner