Get Access to World’s largest Template Library & Tools

How To Create a Clustered Column Chart in Excel


Microsoft Excel is a powerful tool for creating clustered column charts, a popular method for comparing data across multiple categories. Ideal for beginners and seasoned Excel users, mastering clustered column charts will enable you to present data comparisons more compellingly, supporting clearer insights and decision-making.
How To Create a Clustered Column Chart in Excel


Crafting a clustered column chart in Microsoft Excel is a straightforward way to visually compare data across different categories. These steps will guide you through creating a chart that enhances your data presentation and analysis.

  • Step 1. Prepare Your Data

    Begin with organizing your data in Excel, ensuring that each category and its corresponding values are laid out in rows or columns. Your data should include a clear label for each category and series to represent the chart accurately.

  • Step 2. Select Your Data

    Highlight the data range you want to include in your chart, including any row or column labels that will help identify different parts of your chart.

  • Step 3. Insert the Clustered Column Chart
    step 3 insert the clustered column chart

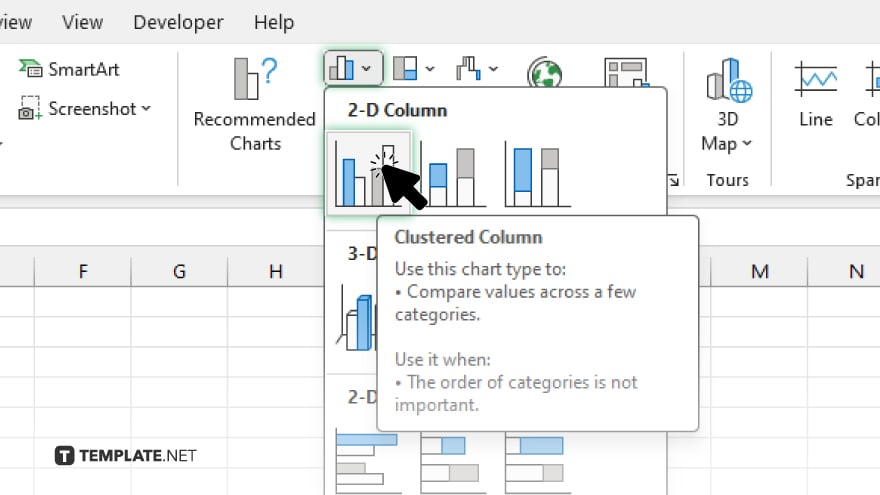
    Navigate to the “Insert” tab on the Excel ribbon and click the “Column or Bar Chart” icon. From the drop-down menu, select “Clustered Column.” Excel will automatically generate the chart based on your selected data.

  • Step 4. Customize Your Chart

    step 4 customize your chart

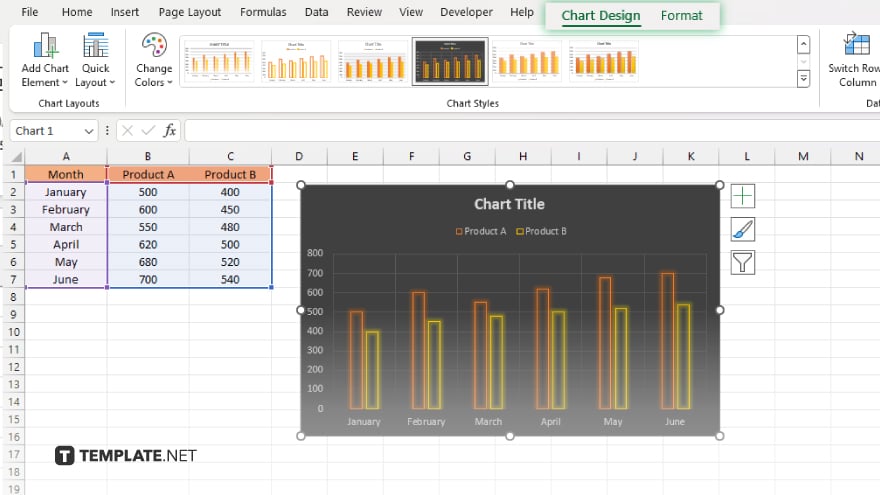
    With the chart selected, use the “Chart Tools” on the ribbon (“Design and Format” tabs) to customize your chart. You can add chart titles, axis labels, and legends, adjust the color scheme, and modify the chart style to suit your presentation needs.

  • Step 5. Adjust Chart Layouts and Labels

    For further refinement, you can adjust the layout and formatting of your chart. Right-click on specific chart elements, such as data series or axis labels, to access formatting options that allow you to make precise adjustments to your chart’s appearance.

You may also find valuable insights in the following articles offering tips for Microsoft Excel:

note iconNote

Unlock Your Productivity with Over 100,000 Microsoft Excel Templates! Exclusively Available at Template.net – Download Now and Transform Your Data Handling Experience!

FAQs

What is a clustered column chart used for in Excel?

A clustered column chart in Excel is used to compare values across multiple categories visually.

Can I create a clustered column chart with more than two categories in Excel?

Yes. You can create a clustered column chart with multiple categories and series in Excel.

How do I change the color of the columns in my clustered column chart?

Click on a column in the chart, then use the “Format Data Series” pane to change the color.

Is it possible to add a trendline to a clustered column chart in Excel?

While unusual for clustered column charts, you can add a trendline by right-clicking on a data series and selecting “Add Trendline.”

Can I switch the chart type from a clustered column to another type after creating it in Excel?

Yes, you can change the chart type by selecting the chart and then clicking “Change Chart Type” in the “Chart Tools Design” tab.

More in Excel

How to Share a Microsoft Excel File with Multiple UsersHow to Make a Flow Chart in Microsoft Excel
How to Use If Then in Microsoft ExcelHow to Insert Numbers in Microsoft Excel
How to Draw a Line Through Text in Microsoft ExcelHow to Create a Forecast Sheet in Microsoft Excel
How to Resize Cells in Microsoft ExcelHow to Lock a Microsoft Excel File
How to AutoSum in Microsoft ExcelHow to Take Off Read Only in Microsoft Excel
How to Share Excel Files for Multiple Users Office 365How to Create Charts in Microsoft Excel
How to Start a New Line in Microsoft ExcelHow To Make a Map in Microsoft Excel
How to Remove a Table Microsoft ExcelHow to Join Cells in Microsoft Excel
How to Create a Microsoft Excel TemplateHow to Change the Date in Microsoft Excel
How to Turn Off Protected View in Microsoft ExcelHow to Add Numbers in a Microsoft Excel Column
How to Remove Duplicate Names in Microsoft ExcelHow to Fit a Microsoft Excel Sheet on One Page
How to Make an Interactive Calendar in Microsoft ExcelHow to Shrink Text to Fit Within Excel Cells
How to Clear the Microsoft Excel CacheHow to Ungroup in Microsoft Excel
How to Merge Tables in Microsoft ExcelHow to Run a Correlation in Microsoft Excel
How to Make a Row a Header in Microsoft ExcelHow to Count Highlighted Cells in Microsoft Excel
How To Move to Next Line in Microsoft ExcelHow to Insert Cells in Microsoft Excel
How to Copy Numbers in Excel Without the FormulaHow to Create an Invoice in Microsoft Excel
How to Find the Payback Period in Microsoft ExcelHow to Add a Secondary Vertical Axis in Microsoft Excel
How to Delete a Comment in Microsoft ExcelHow to Extend a Table in Microsoft Excel
How to Edit a Pivot Table in Microsoft ExcelHow to Compare Columns in Microsoft Excel
How to Run a Multiple Regression in Microsoft ExcelHow To Add Title to a Chart in Microsoft Excel
How to Merge Cells in Microsoft Excel on MacHow to Use a Slicer in Microsoft Excel
How to Edit a Graph in Microsoft ExcelHow to Delete Comments in Microsoft Excel
How to View Macros in Microsoft ExcelHow to Add Trend Lines in Microsoft Excel
How to Create a Balance Sheet in Microsoft ExcelHow to Copy and Paste a Formula in Microsoft Excel
How to Drag Numbers Down in Microsoft ExcelHow to Sort by Name in Microsoft Excel
How to Separate Addresses in Microsoft ExcelHow to Make a CSV File in Microsoft Excel
How to Wrap Cells in Microsoft ExcelHow to Show the Developer Tab in Microsoft Excel
How to Unfreeze Columns in Microsoft ExcelHow To Calculate Difference in Time in Excel
How To Read Excel Files in PythonHow to Switch Rows in Microsoft Excel
How To Go To the Next Line in an Excel CellHow to Make a Microsoft Excel Spreadsheet Shared
How to Use the TRIM Function in Microsoft ExcelHow to Add All Numbers in a Column in Excel
How to Remove Empty Rows in Excel at the BottomHow to Make Drop Downs in Microsoft Excel
How to Divide Columns in Microsoft ExcelHow to Freeze the Header Row in Microsoft Excel
How to Recover a Previous Version of an Excel FileHow to Pivot in Microsoft Excel
How to Use the INDIRECT Function in Microsoft ExcelHow to Copy Table from Microsoft Excel to Word
How to Make a Checkmark in Microsoft ExcelHow to Find and Remove Duplicates in Microsoft Excel
How to Freeze Columns and Rows in Microsoft ExcelHow To Enter to a New Line in Microsoft Excel
How To Do Pie Chart in Microsoft ExcelHow to Calculate Date Difference in Microsoft Excel
How To Multiply in Microsoft Excel FormulaHow To Find Duplicated Rows in Microsoft Excel
How To Compare 2 Columns in Microsoft ExcelHow to Make a Percentage Formula in Microsoft Excel
How to Unsort in Microsoft ExcelHow to Calculate CV in Microsoft Excel
How to Do a Chi-Square Test in Microsoft ExcelHow to Save a Microsoft Excel File
How to Make Microsoft Excel Read-OnlyHow To Put Excel in Alphabetical Order
How To Duplicate an Excel SpreadsheetHow To Add the Total of a Column in Microsoft Excel
How to Remove Auto Filters in Microsoft ExcelHow to Freeze the Second Row in Microsoft Excel
How to Auto-Sum in Microsoft ExcelHow to Unfreeze Microsoft Excel
How to Add Buttons in Microsoft ExcelHow to Set the Print Area in Microsoft Excel
How to Add a Macro in Microsoft ExcelHow to Add a Text Box in Microsoft Excel
How to Convert PDF to Microsoft Excel Without SoftwareHow to Make a Copy of an Excel Sheet
bottom banner