Get Access to World’s largest Template Library & Tools

How to Do Descriptive Statistics in Microsoft Excel

Microsoft Excel is a powerful tool for performing descriptive statistics, which are crucial for summarizing and understanding large datasets. Whether you are in business, education, or research, learning how to calculate and interpret these statistics can provide valuable insights into trends and patterns.
How to Do Descriptive Statistics in Microsoft Excel


Performing descriptive statistics in Microsoft Excel is essential for analyzing data sets and deriving meaningful insights. This section will guide you through the fundamental steps to calculate key statistical measures directly within Excel.

  • Step 1. Input Your Data

    Begin by entering your data into a clean Excel spreadsheet. Organize your data in columns, with each column representing a different variable and each row representing an observation.

  • Step 2. Enable the ‘Data Analysis Toolpak’

    To access advanced statistical functions, ensure that the “Data Analysis Toolpak” is enabled. Go to the “File” menu, click “Options,” select “Add-ins,” choose “Excel Add-ins” in the Manage box, and click “Go.” Check the box next to “Analysis ToolPak” and click “OK.”

  • Step 3. Access ‘Descriptive Statistics’
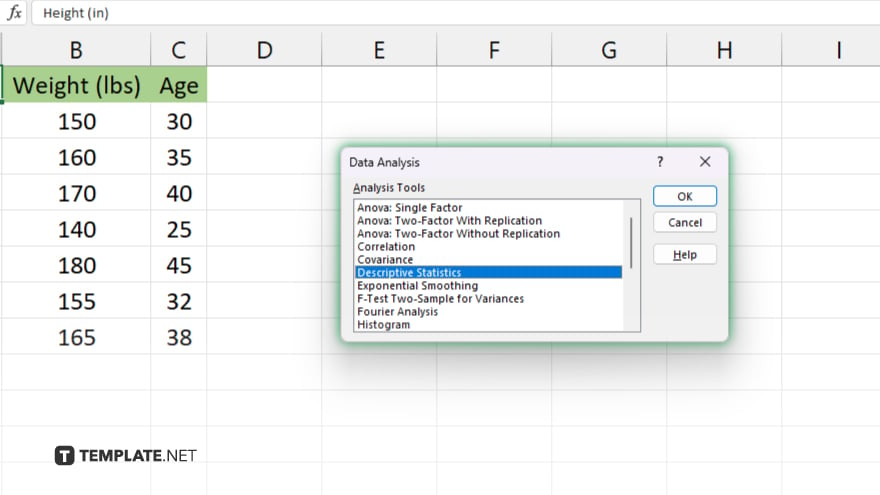
    step 3 access descriptive statistics

    With the Toolpak enabled, click on the “Data” tab, then select “Data Analysis” and choose “Descriptive Statistics” from the list of analysis tools. This will open a dialog box for setting up your analysis.

  • Step 4. Configure Descriptive Statistics
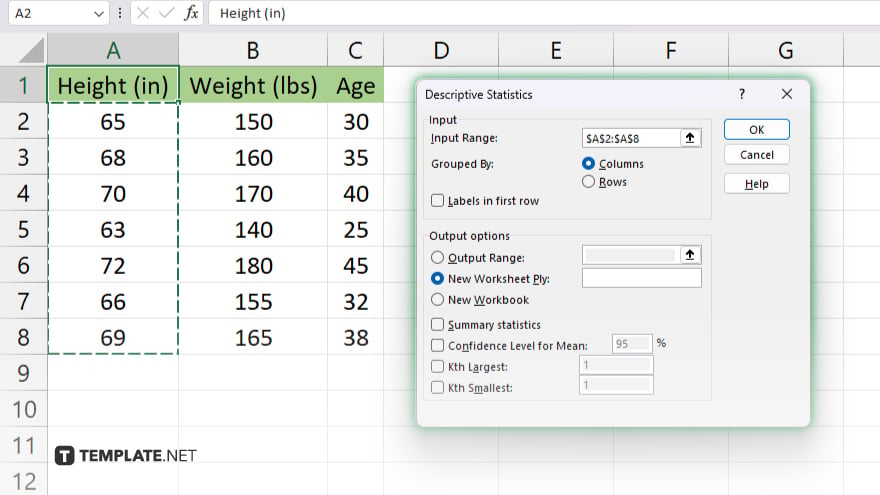
    step 4 configure descriptive statistics

    In the “Descriptive Statistics” dialog box, input the range of your data in the “Input Range” box. Specify if your data is arranged by columns or rows, and whether or not your data range includes labels. Choose an output range if you want the results in the same worksheet or specify a new worksheet.

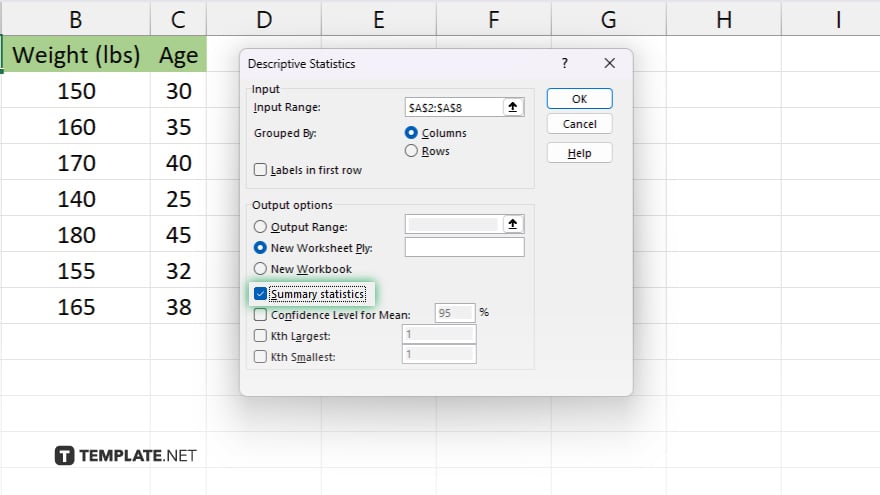
  • Step 5. Select Statistical Measures

    step 5 select statistical measures

    Select the statistics you want to compute, such as mean, median, mode, standard deviation, range, and quartiles. Check “Summary statistics” to get a comprehensive statistical summary. Click “OK” to generate the descriptive statistics.

You may also find valuable insights in the following articles offering tips for Microsoft Excel:

note iconNote

Unlock Your Productivity with Over 100,000 Microsoft Excel Templates! Exclusively Available at Template.net – Download Now and Transform Your Data Handling Experience!

FAQs

What is the ‘Analysis ToolPak’ in Excel?

The “Analysis ToolPak” is an Excel add-in that provides additional data analysis tools, including those for performing complex statistical calculations.

Do I need to format my data in a specific way to use descriptive statistics in Excel?

Yes, data should be organized in a clear, tabular format with variables in columns and observations in rows to ensure accurate analysis.

Can Excel calculate the mode for a dataset?

Yes, Excel can calculate the mode of a dataset, and this is included in the options when using the “Descriptive Statistics” tool from the “Analysis ToolPak.”

Is it possible to get a histogram as part of descriptive statistics in Excel?

Yes, you can create a histogram using the “Data Analysis Toolpak” by selecting “Histogram” as the analysis tool.

How do I interpret the output from Excel’s descriptive statistics?

The output provides measures of central tendency, variability, and distribution shape, which help you understand the general behavior and key characteristics of your data.

More in Excel

How to Change the Background Color in Microsoft ExcelHow To Calculate Percentage Increase or Decrease in Excel
How to Refresh Formulas in Microsoft ExcelHow to Insert a Graph in Microsoft Excel
How to Allow Multiple Users to Edit Microsoft ExcelHow to Create a Scenario in Microsoft Excel
How to Combine Two Graphs in Microsoft ExcelHow to Search on Microsoft Excel Sheets
How to Strike Out in Microsoft ExcelHow to Make a Copy of a Sheet in Microsoft Excel
How to Delete a Line in Microsoft ExcelHow to Make a Comparison Chart in Microsoft Excel
How to Change Axis Titles in Microsoft ExcelHow to Center Across Selection in Microsoft Excel
How to Clear the Clipboard in Microsoft ExcelHow to Switch Rows to Columns in Microsoft Excel
How to Do Absolute Value in Microsoft ExcelHow to Save in Microsoft Excel
How to Merge in Microsoft ExcelHow to Do a Correlation in Microsoft Excel
How to Use Sum in Microsoft ExcelHow to Keep a Cell Constant in Microsoft Excel
How to Save a Microsoft Excel File as CSVHow to Add a Leading Zero in Microsoft Excel
How to Use the Round Function in Microsoft ExcelHow to Do Regression in Microsoft Excel
How to Divide on Microsoft ExcelHow to Calculate Age in Excel DD/MM/YYYY
How to Add a Calendar Drop Down in Microsoft ExcelHow to Use a Drop Down List in Microsoft Excel
How to Remove Blank Spaces in Microsoft ExcelHow to Print Grid Lines in Microsoft Excel
How to Insert a Line Break in Microsoft ExcelHow To Create a Percentage Formula in Microsoft Excel
How to Add Two Cells in Microsoft ExcelHow to Make a Line Chart in Microsoft Excel
How to Add Data to a Chart in Microsoft ExcelHow to Select Rows in Microsoft Excel
How to Make Alternating Colors in Microsoft ExcelHow to Return Within a Cell in Microsoft Excel
How to Remove Part of Text in an Excel CellHow to Add Strikethrough in Microsoft Excel
How to Add Drop Downs in Microsoft ExcelHow to Extract the Month from a Date in Microsoft Excel
How to Add a Zero in Front of a Number in Microsoft ExcelHow to Change Cell Color in Microsoft Excel
How to Add a Row in Microsoft Excel Using a ShortcutHow to Find R^2 in Microsoft Excel
How to Move to the Next Line in Microsoft ExcelHow to Calculate ROI in Microsoft Excel
How to Add a Tab in Microsoft ExcelHow to Create Lines in Microsoft Excel
How to Rotate Cells in Microsoft ExcelHow to Type Vertically in Microsoft Excel
How to Insert a Comma in Microsoft ExcelHow to Change Page Orientation in Microsoft Excel
How to Turn Off Read Only in Microsoft ExcelHow to Change to All Caps in Microsoft Excel
How to Download a Microsoft Excel FileHow to Share a Microsoft Excel File
How to Multiply 2 Columns in Microsoft ExcelHow to Get Rid of Empty Rows in Microsoft Excel
How to Find in Microsoft ExcelHow to Calculate Future Value in Microsoft Excel
How to Share a Microsoft Excel File with Multiple UsersHow to Make a Flow Chart in Microsoft Excel
How to Use If Then in Microsoft ExcelHow to Insert Numbers in Microsoft Excel
How to Draw a Line Through Text in Microsoft ExcelHow to Create a Forecast Sheet in Microsoft Excel
How to Resize Cells in Microsoft ExcelHow to Lock a Microsoft Excel File
How to AutoSum in Microsoft ExcelHow to Take Off Read Only in Microsoft Excel
How to Share Excel Files for Multiple Users Office 365How to Create Charts in Microsoft Excel
How to Start a New Line in Microsoft ExcelHow To Make a Map in Microsoft Excel
How to Remove a Table Microsoft ExcelHow to Join Cells in Microsoft Excel
How to Create a Microsoft Excel TemplateHow to Change the Date in Microsoft Excel
How to Turn Off Protected View in Microsoft ExcelHow to Add Numbers in a Microsoft Excel Column
How to Remove Duplicate Names in Microsoft ExcelHow to Fit a Microsoft Excel Sheet on One Page
How to Make an Interactive Calendar in Microsoft ExcelHow to Shrink Text to Fit Within Excel Cells
How to Clear the Microsoft Excel CacheHow to Ungroup in Microsoft Excel
How to Merge Tables in Microsoft ExcelHow to Run a Correlation in Microsoft Excel
How to Make a Row a Header in Microsoft ExcelHow to Count Highlighted Cells in Microsoft Excel
How To Move to Next Line in Microsoft ExcelHow to Insert Cells in Microsoft Excel
How to Copy Numbers in Excel Without the FormulaHow to Create an Invoice in Microsoft Excel
How to Find the Payback Period in Microsoft ExcelHow to Add a Secondary Vertical Axis in Microsoft Excel
bottom banner