Table of Contents
Vertical Diagram
Vertical diagrams visually communicate ideas and can come in various forms, including bar charts, organizational charts, flowcharts, etc. They hold value when presenting information, making comparisons, and illustrating sequential steps or relationships. Consider using our AI tools at Template.net to generate a vertical diagram, whether you’re looking to visualize data trends, outline an organizational structure, or map out a workflow.

What Is a Vertical Diagram?
A vertical diagram is a graphical representation or visual aid that presents information, data, processes, relationships, or structures in a format where the primary elements or components are arranged vertically from top to bottom. This vertical orientation is in contrast to horizontal diagrams, where elements are arranged from left to right or right to left. However, choosing a vertical diagram depends on the specific purpose and the nature of the content being conveyed.
Vertical Diagram Uses, Purpose, Importance
Vertical diagrams can provide clear and structured representations of data, processes, relationships, or hierarchies in a top-to-bottom format. Whether it’s using vertical bar charts to compare data, creating organizational charts to illustrate an organization’s structure, or designing vertical flowcharts to outline procedural steps, these diagrams enhance comprehension and facilitate effective communication. The vertical orientation often complements the natural reading direction in many cultures, making vertical diagrams intuitive and accessible to a broad audience.
How to Create a Vertical Diagram with AI?
Start by selecting a suitable AI-powered diagram creation tool or software, which can generate vertical diagrams based on your data or content. Then, input your data or information, specifying the elements, values, relationships, or structure you want to visualize in the vertical diagram. Second, choose the type of diagram you need, such as a vertical bar chart, organizational chart, or flowchart. Let the AI tool analyze your input and automatically generate the vertical diagram for you. Next, customize the diagram as needed, adjusting colors, labels, fonts, or styles to match your preferences and the context of your presentation. Lastly, save or export the final diagram for use in your documents, reports, or presentations.
AI-driven diagram creation can significantly streamline the process, saving time and ensuring the visual representation is accurate and professional.
Vertical Diagram Example
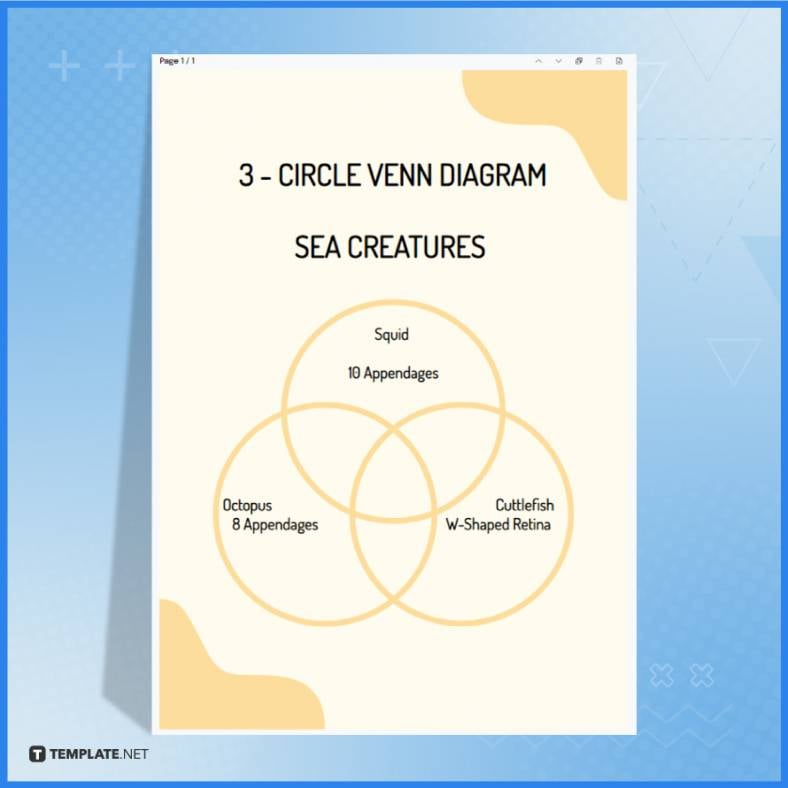
Vertical diagrams can refer to various types of graphical representations or charts that are oriented vertically, such as bar charts, column charts, organizational charts, flowcharts, and more. Each of these serves a different purpose and displays data or information in a vertical format. Here is an example of a Vertical Diagram generated by our AI generator:
The choice of a vertical orientation in a diagram can impact the ease of understanding and interpreting the data or information it conveys, making it an important consideration in data visualization and communication.
FAQs
How are bar charts and column charts different in a vertical diagram?
Bar charts use horizontal bars, while column charts use vertical columns to represent data.
What are the advantages of using a vertical orientation in diagrams?
It can improve readability and facilitate data comparison.
How do you create a vertical organizational chart?
Top-level positions are placed at the top, with lower-level positions descending below.
What is a flowchart’s typical orientation?
Flowcharts are often designed vertically to illustrate processes and decision trees.
How do you label the vertical axis in a vertical diagram?
The vertical axis is typically labeled to indicate the data or categories being represented.
What are the main considerations for designing an effective vertical diagram?
Proper scaling, clear labels, and a logical layout are key factors.
Are there any limitations to using vertical diagrams?
Some data may be better suited to horizontal representations, and space constraints can be a concern.
Are there any best practices for color usage in vertical diagrams?
Choose colors that enhance data differentiation and readability.
What is the difference between a vertical line chart and a vertical bar chart?
Line charts use lines to connect data points, while bar charts use discrete bars.
How can vertical diagrams aid in data storytelling?
They can make it easier to present data trends and comparisons to an audience.


