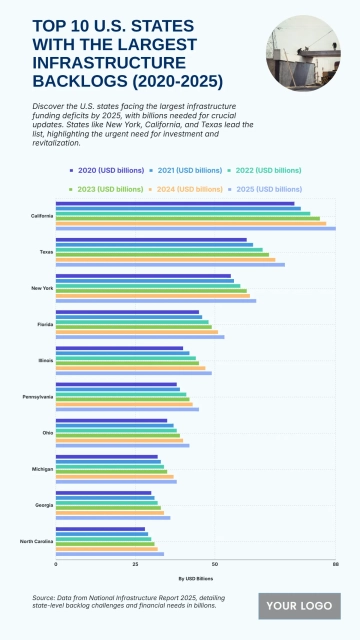
A professional 9:16 chart template for presenting infrastructure backlog data by state, professionally designed by Template.net, with a horizontal bar chart, a bold headline and a logo placeholder in burnt orange, white and warm brown.
A professional 9:16 chart template for presenting infrastructure backlog data by state, professionally designed by Template.net, with a horizontal bar chart, a bold headline and a logo placeholder in burnt orange, white and warm brown.