Free Top 10 U.S. States by Public Infrastructure Spending (2015-2025)
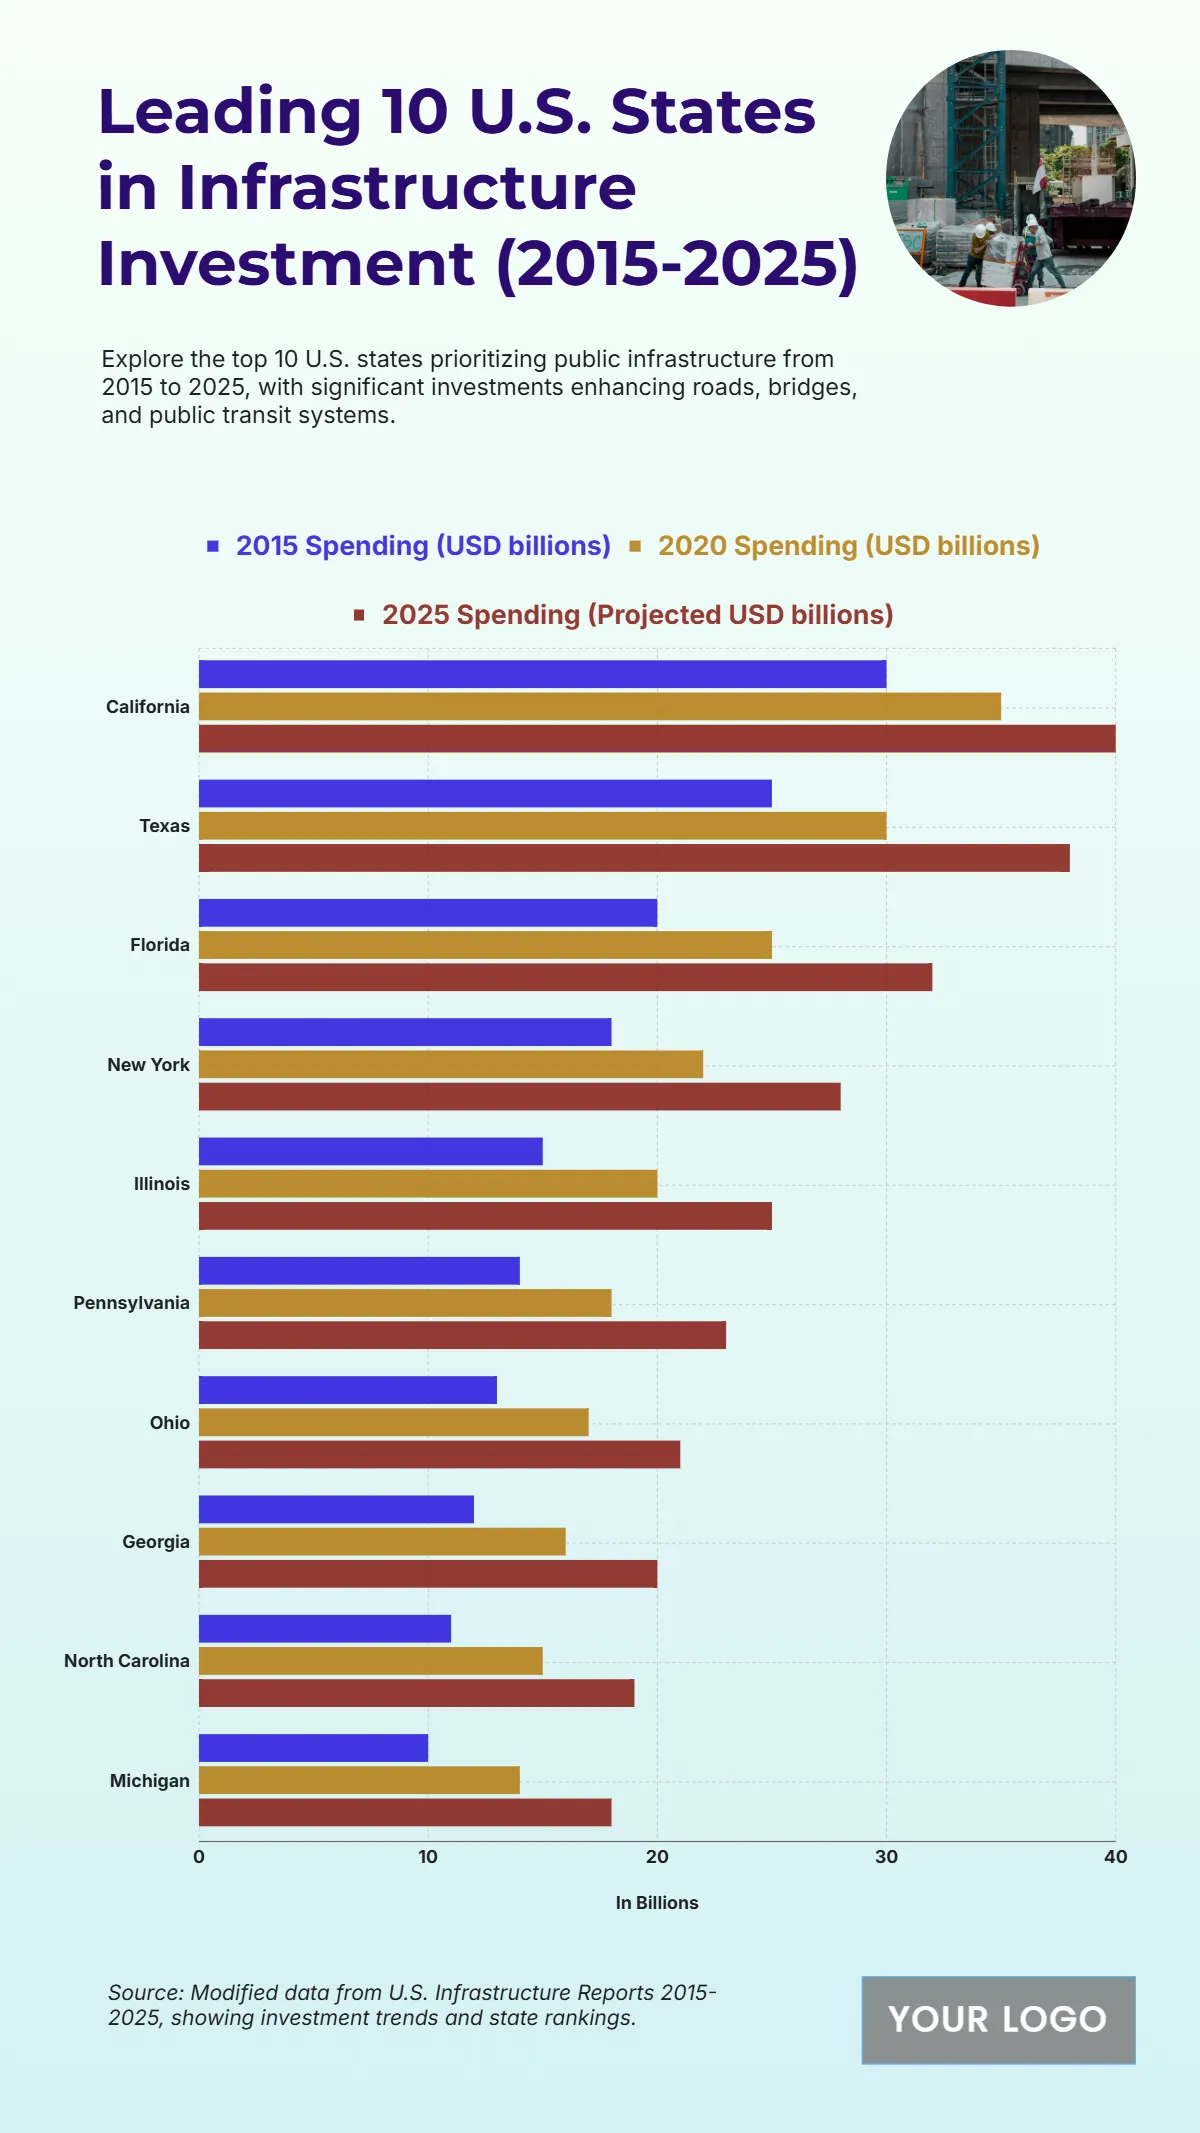
The chart highlights the top 10 U.S. states in infrastructure investment from 2015 to 2025, showcasing long-term spending on roads, bridges, and transit systems. California leads with infrastructure spending projected to reach nearly $40 billion by 2025, reflecting its commitment to modernizing transportation and urban development. Texas follows closely with about $38 billion, driven by rapid population growth and major highway and energy projects. Florida records around $32 billion in 2025, maintaining steady infrastructure expansion focused on coastal protection and urban mobility. New York, ranking fourth, reaches approximately $30 billion, with ongoing improvements in transit, tunnels, and bridges. Illinois and Pennsylvania follow with respective investments near $27 billion and $25 billion, emphasizing upgrades to aging structures. Ohio and Georgia show consistent growth, each surpassing $22 billion in projected spending, while North Carolina and Michigan complete the list at roughly $20 billion each. Overall, the data reveals a nationwide trend of increasing infrastructure investment, underscoring the states’ efforts to sustain economic growth, enhance connectivity, and ensure long-term resilience through 2025.
| Labels | 2015 Spending (USD billions) | 2020 Spending (USD billions) |
2025 Spending (Projected USD billions) |
| California | 30 | 35 | 40 |
| Texas | 25 | 30 | 38 |
| Florida | 20 | 25 | 32 |
| New York | 18 | 22 | 28 |
| Illinois | 15 | 20 | 25 |
| Pennsylvania | 14 | 18 | 23 |
| Ohio | 13 | 17 | 21 |
| Georgia | 12 | 16 | 20 |
| North Carolina | 11 | 15 | 19 |
| Michigan | 10 | 14 | 18 |


