Free Top 10 U.S. States by Public Infrastructure Backlog (2018-2025) Chart
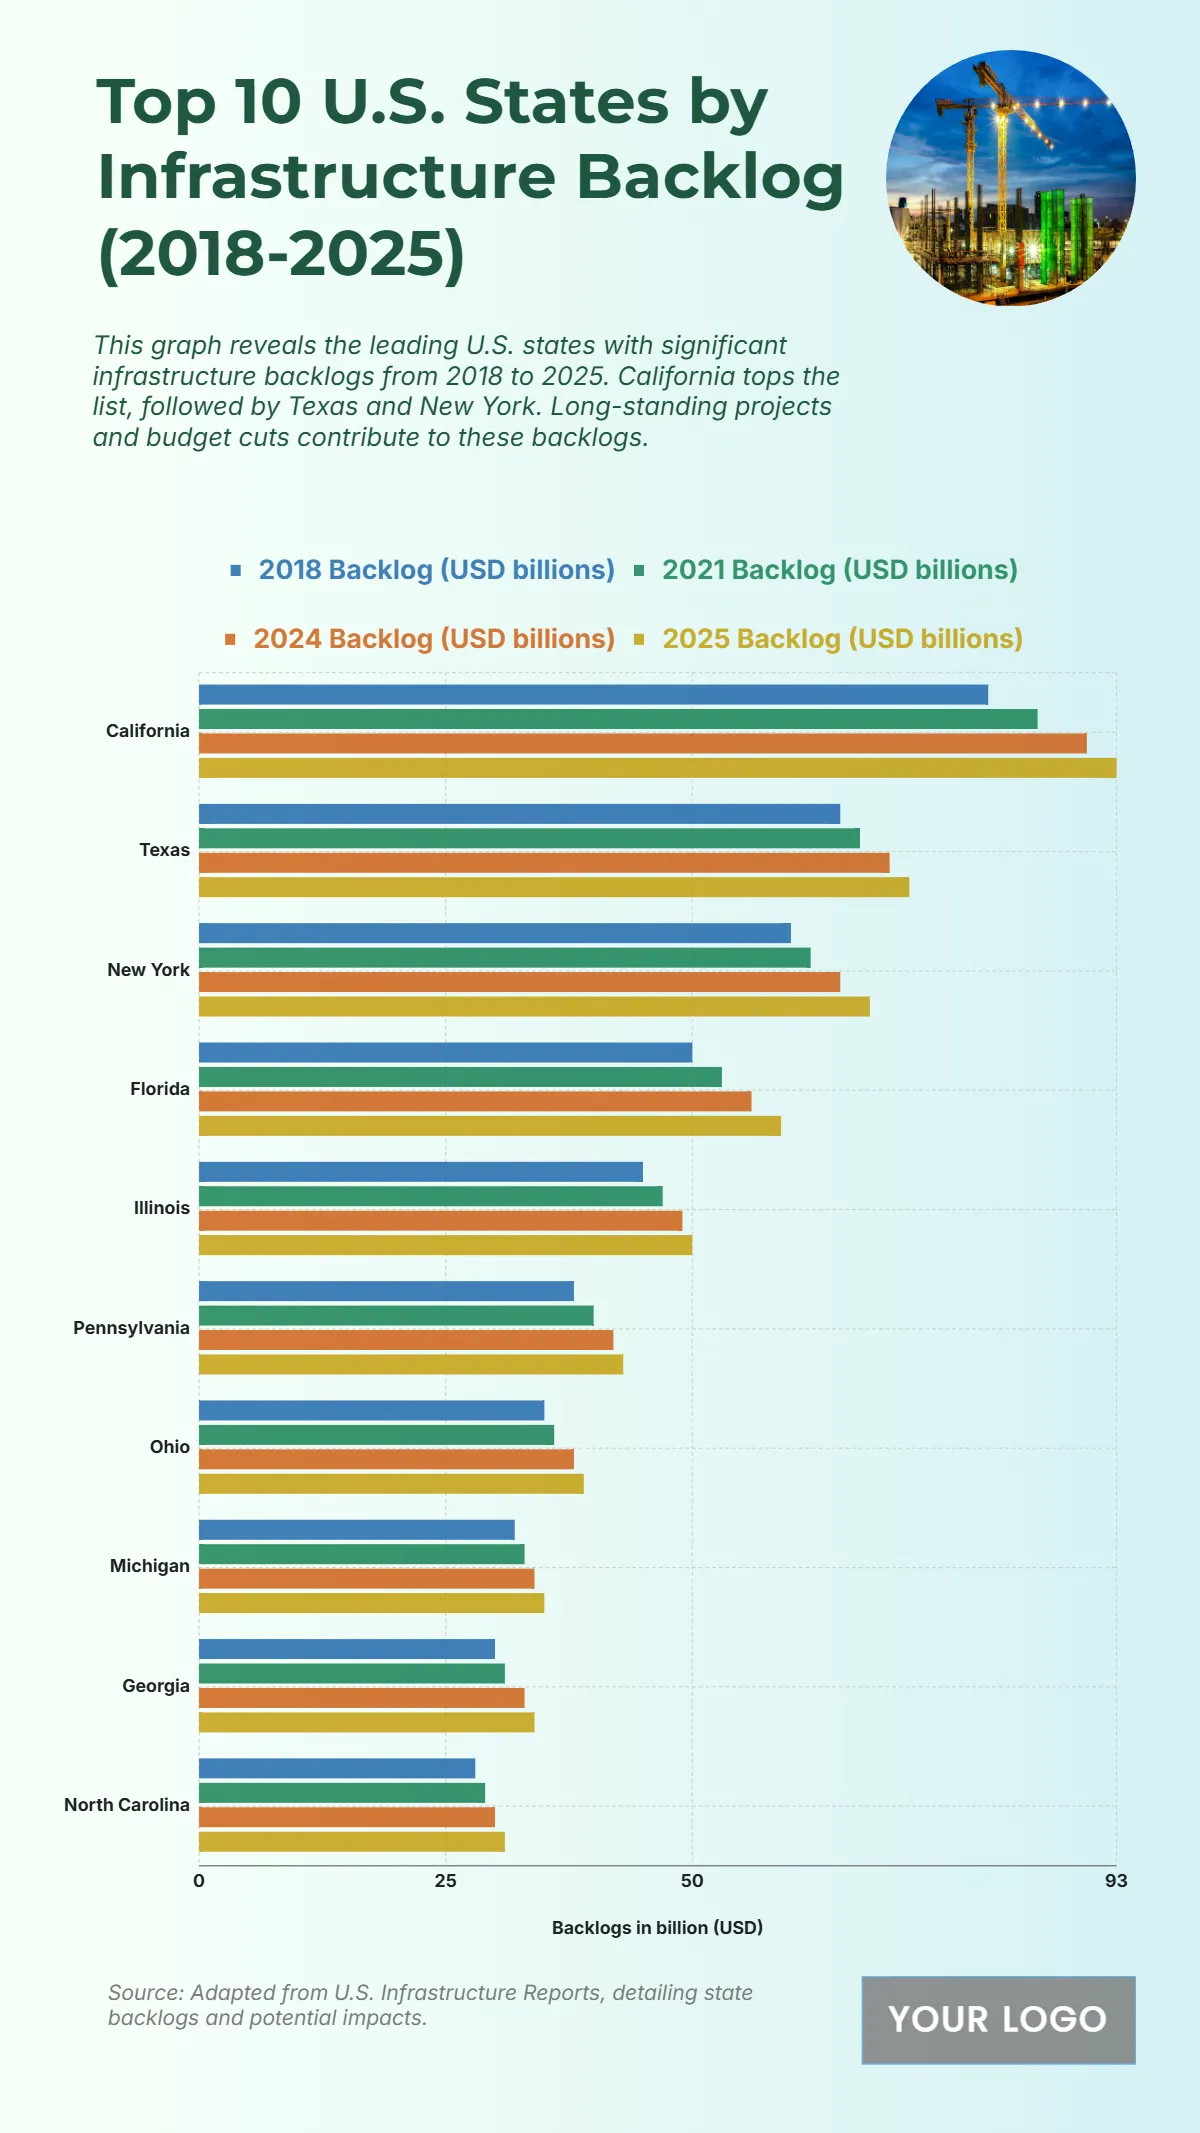
The chart shows a steady increase in infrastructure backlog across the top ten U.S. states from 2018 to 2025, with California leading consistently. California’s backlog rises from USD 80 billion in 2018 to USD 93 billion in 2025, reflecting persistent infrastructure funding gaps. Texas follows, growing from USD 65 billion to USD 72 billion, and New York moves from USD 60 billion to USD 68 billion, highlighting growing project backlogs. Florida increases from USD 50 billion to USD 59 billion, and Illinois from USD 45 billion to USD 50 billion. Pennsylvania, Ohio, Michigan, Georgia, and North Carolina also show consistent backlog growth, reaching USD 43 billion, 39 billion, 35 billion, 34 billion, and 31 billion, respectively, by 2025. The upward trend across all states underscores ongoing infrastructure investment shortfalls and the need for stronger funding strategies to address the growing burden.
| Labels | 2018 Backlog (USD billions) | 2021 Backlog (USD billions) | 2024 Backlog (USD billions) | 2025 Backlog (USD billions) |
|---|---|---|---|---|
| California | 80 | 85 | 90 | 93 |
| Texas | 65 | 67 | 70 | 72 |
| New York | 60 | 62 | 65 | 68 |
| Florida | 50 | 53 | 56 | 59 |
| Illinois | 45 | 47 | 49 | 50 |
| Pennsylvania | 38 | 40 | 42 | 43 |
| Ohio | 35 | 36 | 38 | 39 |
| Michigan | 32 | 33 | 34 | 35 |
| Georgia | 30 | 31 | 33 | 34 |
| North Carolina | 28 | 29 | 30 | 31 |


