Free Top 20 U.S. States by Public Infrastructure Backlog (2018–2025) Chart
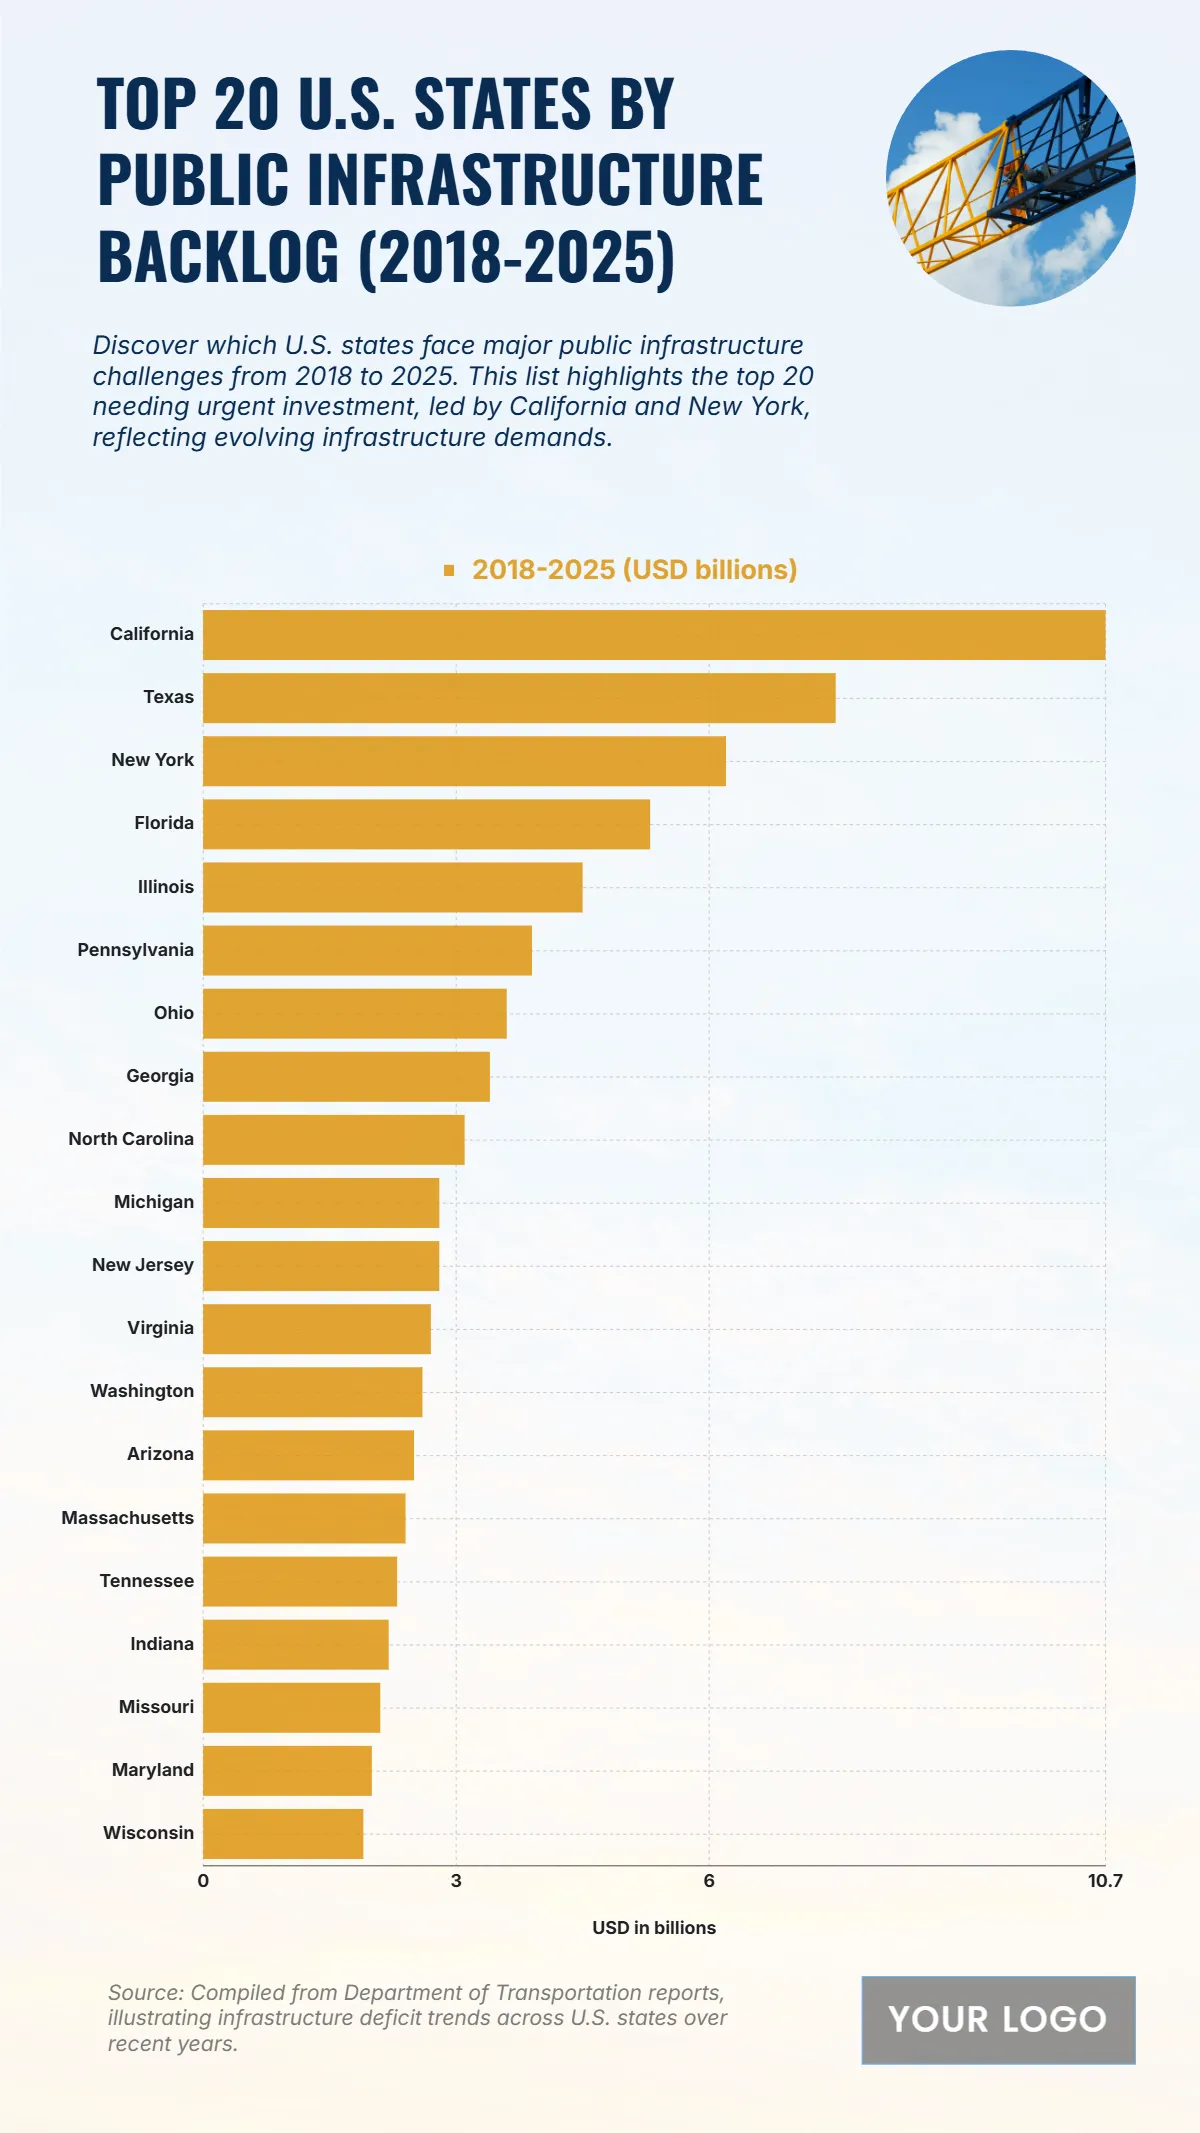
The chart reveals the U.S. states with the highest public infrastructure backlog from 2018 to 2025, emphasizing the regions most in need of repair and modernization. California tops the list with a substantial backlog of 10.7 billion USD, reflecting its vast transportation and infrastructure networks. Texas follows with 7.5 billion USD, while New York records 6.2 billion USD, both facing heavy urban infrastructure demands. Florida ranks fourth at 5.3 billion USD, driven by rapid population growth and storm resilience needs. Illinois and Pennsylvania show significant gaps with 4.5 and 3.9 billion USD, respectively. Midwestern and Southern states such as Ohio (3.6), Georgia (3.4), and North Carolina (3.1) also face notable funding shortfalls. Meanwhile, Michigan, New Jersey, and Virginia range between 2.8–2.7 billion USD. The remaining states—including Washington, Arizona, Massachusetts, and Tennessee—demonstrate smaller yet meaningful deficits, underlining a widespread national challenge in maintaining infrastructure sustainability.
| Labels | 2018–2025 (USD billions) |
|---|---|
| California | 10.7 |
| Texas | 7.5 |
| New York | 6.2 |
| Florida | 5.3 |
| Illinois | 4.5 |
| Pennsylvania | 3.9 |
| Ohio | 3.6 |
| Georgia | 3.4 |
| North Carolina | 3.1 |
| Michigan | 2.8 |
| New Jersey | 2.8 |
| Virginia | 2.7 |
| Washington | 2.6 |
| Arizona | 2.5 |
| Massachusetts | 2.4 |
| Tennessee | 2.3 |
| Indiana | 2.2 |
| Missouri | 2.1 |
| Maryland | 2.0 |
| Wisconsin | 1.9 |


