Free Top 10 U.S. States by Infrastructure Spending (2018–2025) Charts
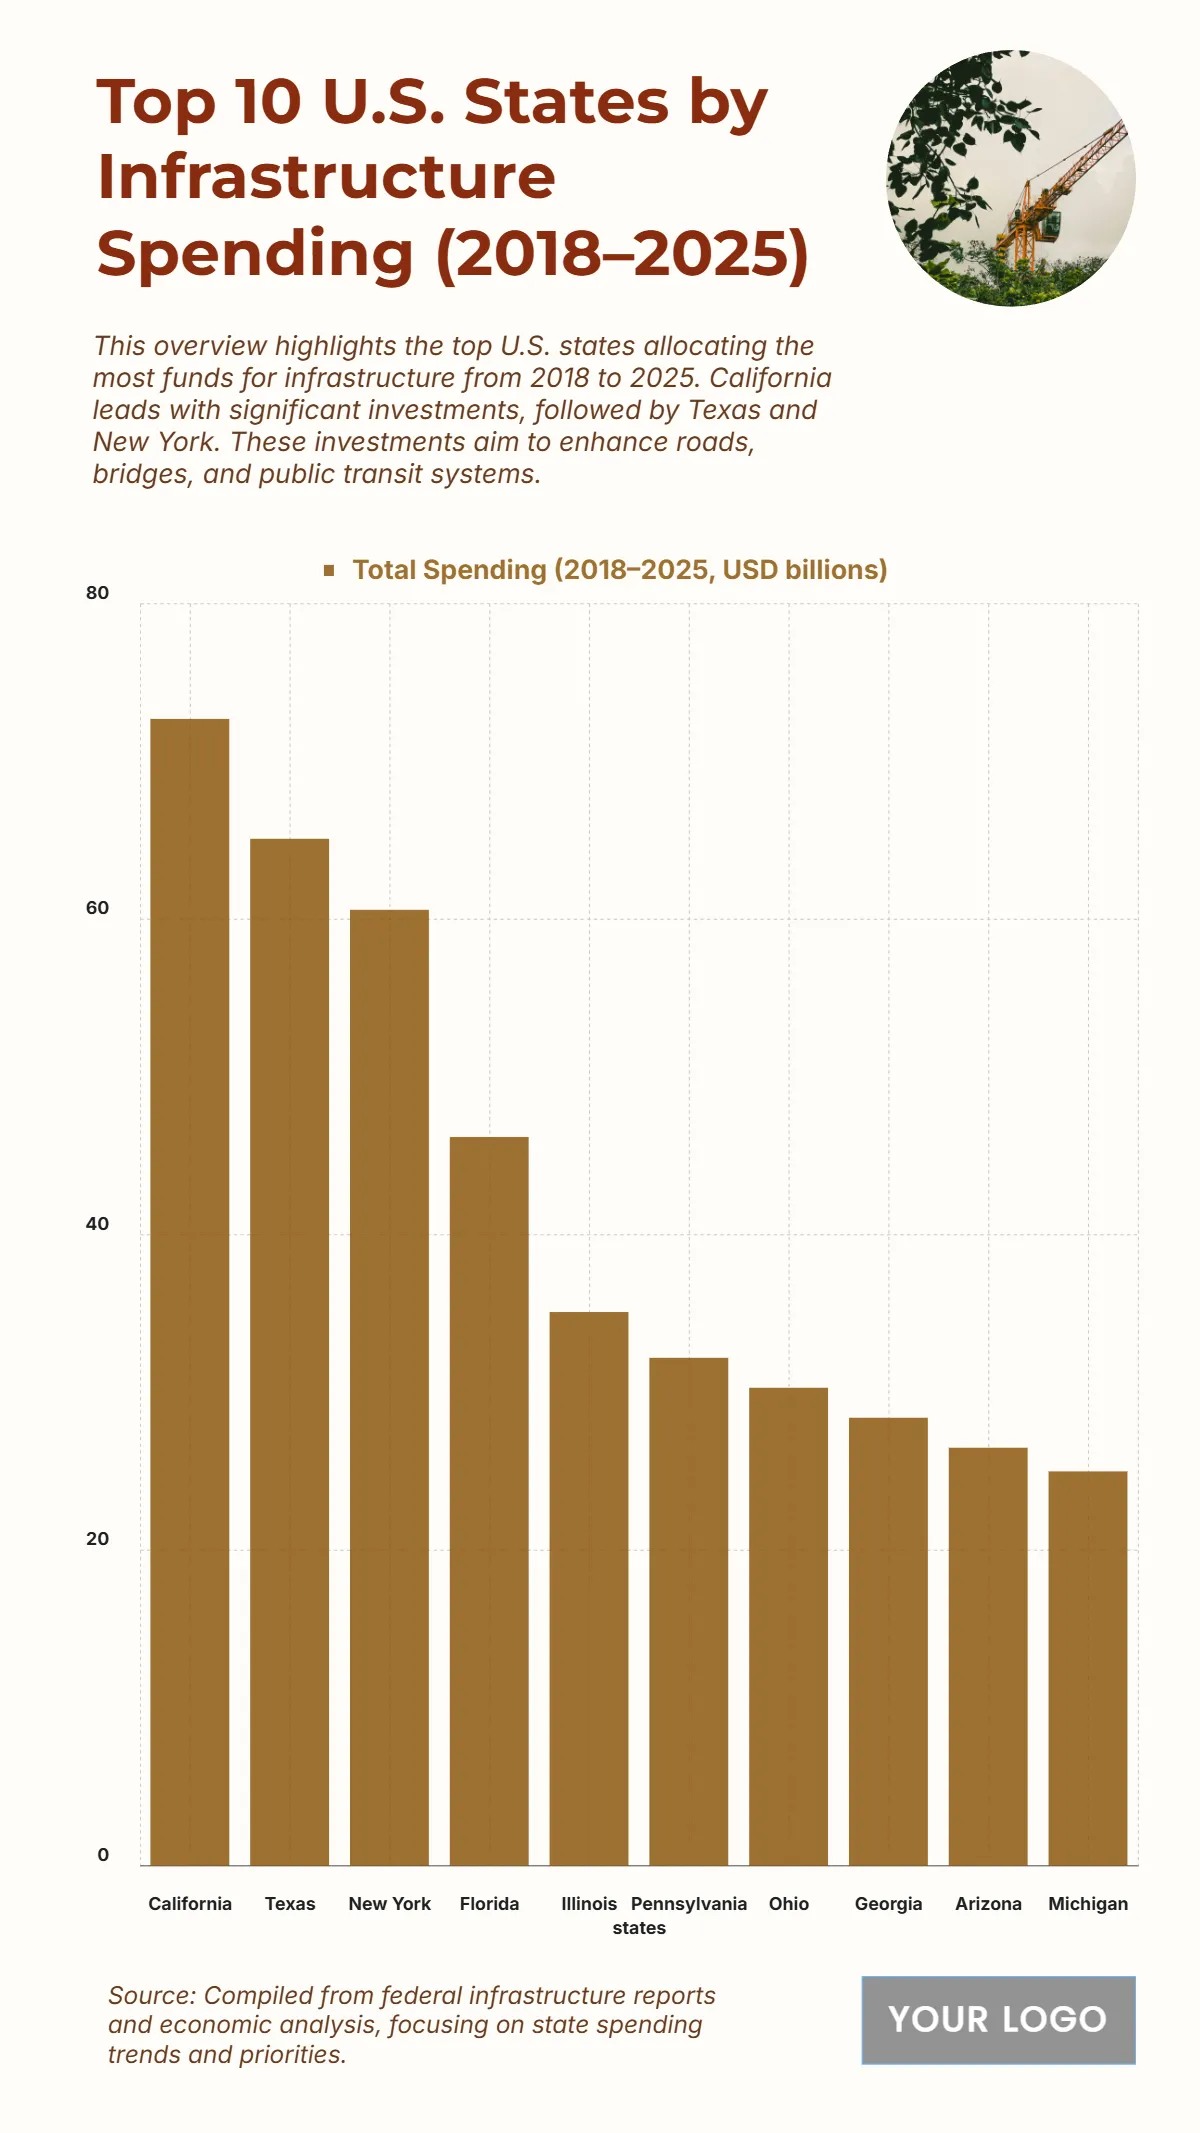
The chart shows the states that invested the most in infrastructure from 2018 to 2025, reflecting major funding priorities in transportation, transit systems, and public works. California ranks first with a total spending of $72.7 billion, emphasizing its large-scale infrastructure projects. Texas follows with $65.1 billion, while New York comes third with $60.6 billion, showing strong commitments from three of the largest state economies. Florida places fourth at $46.2 billion, indicating significant development in transportation and urban infrastructure. Illinois and Pennsylvania allocate $35.1 billion and $32.2 billion respectively, highlighting sustained investment in core infrastructure systems. Ohio, Georgia, Arizona, and Michigan make up the rest of the top 10, with spending between $30.3 billion and $25 billion, showcasing widespread investment trends across both large and mid-sized states.
| Labels | Total Spending (2018–2025, USD billions) |
|---|---|
| California | 72.7 |
| Texas | 65.1 |
| New York | 60.6 |
| Florida | 46.2 |
| Illinois | 35.1 |
| Pennsylvania | 32.2 |
| Ohio | 30.3 |
| Georgia | 28.4 |
| Arizona | 26.5 |
| Michigan | 25 |


