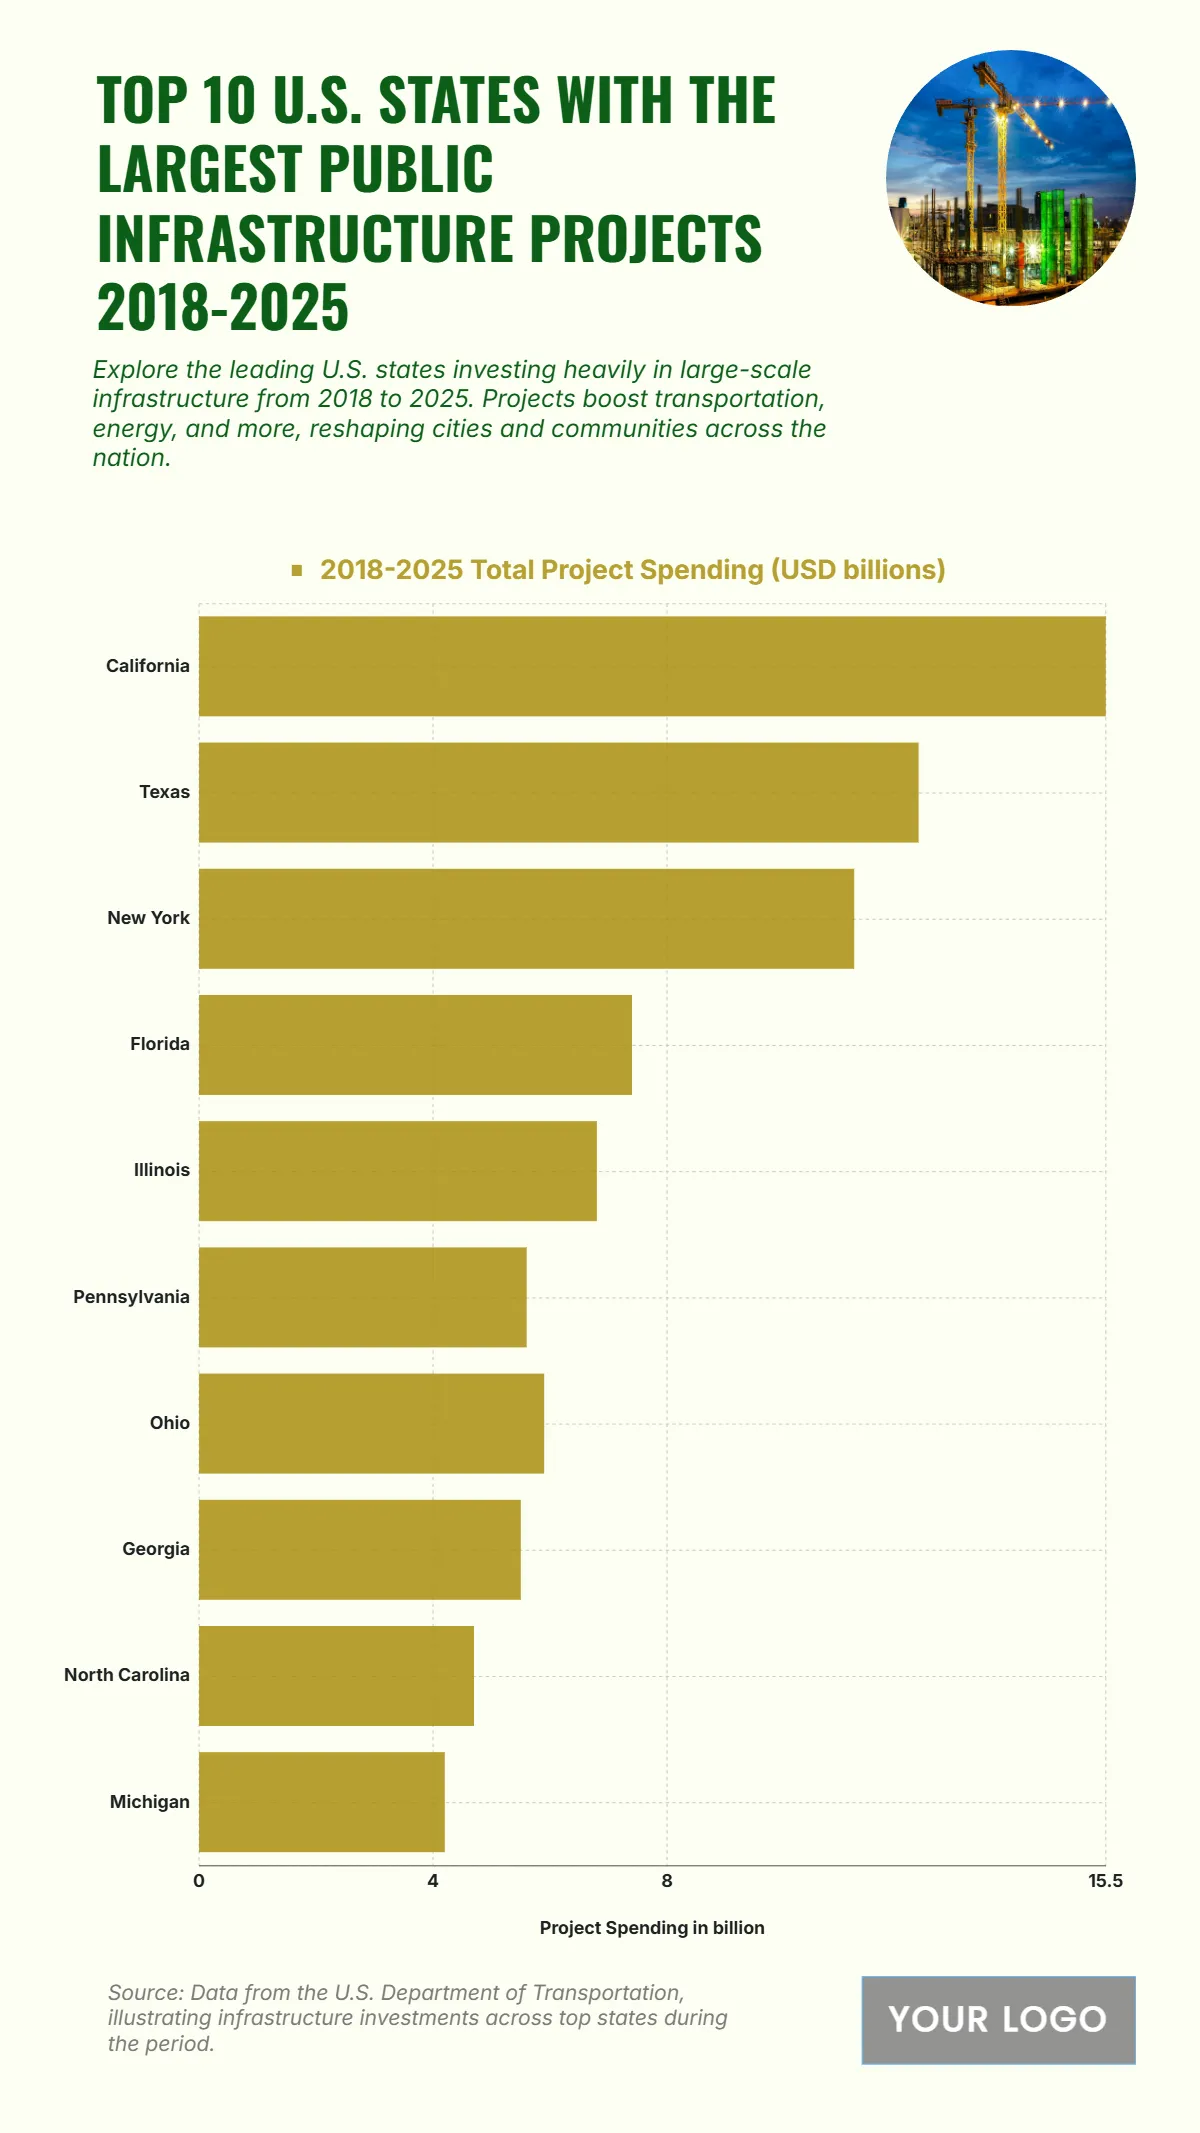
Free Top 10 U.S. States with the Largest Public Infrastructure Projects (2018-2025) Chart
The chart shows that California leads in public infrastructure project spending between 2018 and 2025, with a total of USD 15.5 billion, indicating a strong focus on large-scale transportation, energy, and city development projects. Texas follows with USD 12.3 billion, reflecting its rapid economic and population growth. New York ranks third at USD 11.2 billion, underscoring its ongoing investment in urban infrastructure. Florida comes next with USD 7.4 billion, while Illinois records USD 6.8 billion in total spending. Mid-tier states like Pennsylvania, Ohio, and Georgia show moderate investments of USD 5.6, 5.9, and 5.5 billion, respectively. North Carolina and Michigan round out the top 10 with USD 4.7 and 4.2 billion, indicating consistent but smaller-scale projects compared to leading states. The overall trend highlights how infrastructure investments remain concentrated in states with major population centers and economic hubs.
| Labels | 2018–2025 Total Project Spending (USD billions) |
|---|---|
| California | 15.5 |
| Texas | 12.3 |
| New York | 11.2 |
| Florida | 7.4 |
| Illinois | 6.8 |
| Pennsylvania | 5.6 |
| Ohio | 5.9 |
| Georgia | 5.5 |
| North Carolina | 4.7 |
| Michigan | 4.2 |


