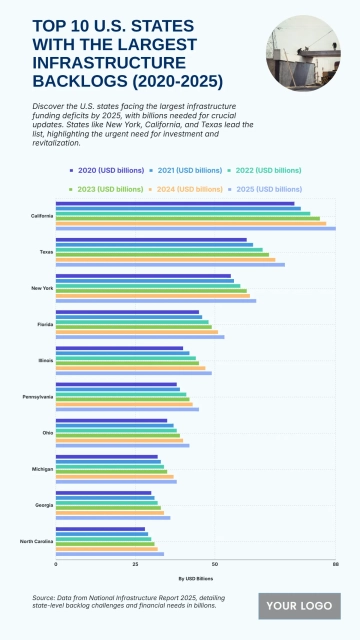
An informative 9:16 infographic for comparing infrastructure funding backlogs across U.S. states, professionally designed by Template.net, with a grouped horizontal bar chart, a construction photo and a bold headline in navy blue, white and soft green.