![How To Make/Create an Invitation in Google Docs [Templates + Examples]](https://images.template.net/wp-content/uploads/2023/07/How-To-Make_Create-an-Invitation-in-Google-Docs-Templates-Examples-788x443.png)
How To Make/Create an Invitation in Google Docs [Templates + Examples]
To formally invite someone or a group of people to an event or activity, you will need to send out…
Jul 28, 2023


Dec 23, 2025
Graphic organizer ideas are laid before you to help define or process your activities, establish authority among your co-workers, and achieve your goals and objectives. Although choosing the right one may be confusing at first glance, remember that these learning tools will help you remain consistent throughout your organizing processes.

Graphic organizing creates a detailed framework for you to reach your objectives for every activity or project you undertake. This curated list of ideas will help you choose which example is suitable for your writing needs. So, make sure to carefully read each section for you to be informed on the right way of making a graphic organizer.
The circle graphic organizer is used to brainstorm a concept or topic by presenting connected facts. You can label this graphic organizer with your full title at the topmost area or wherever it is more spacious; followed by the container which will present your contents. You can check out this example provided and add decorations that would match the content of your graphic organizer.
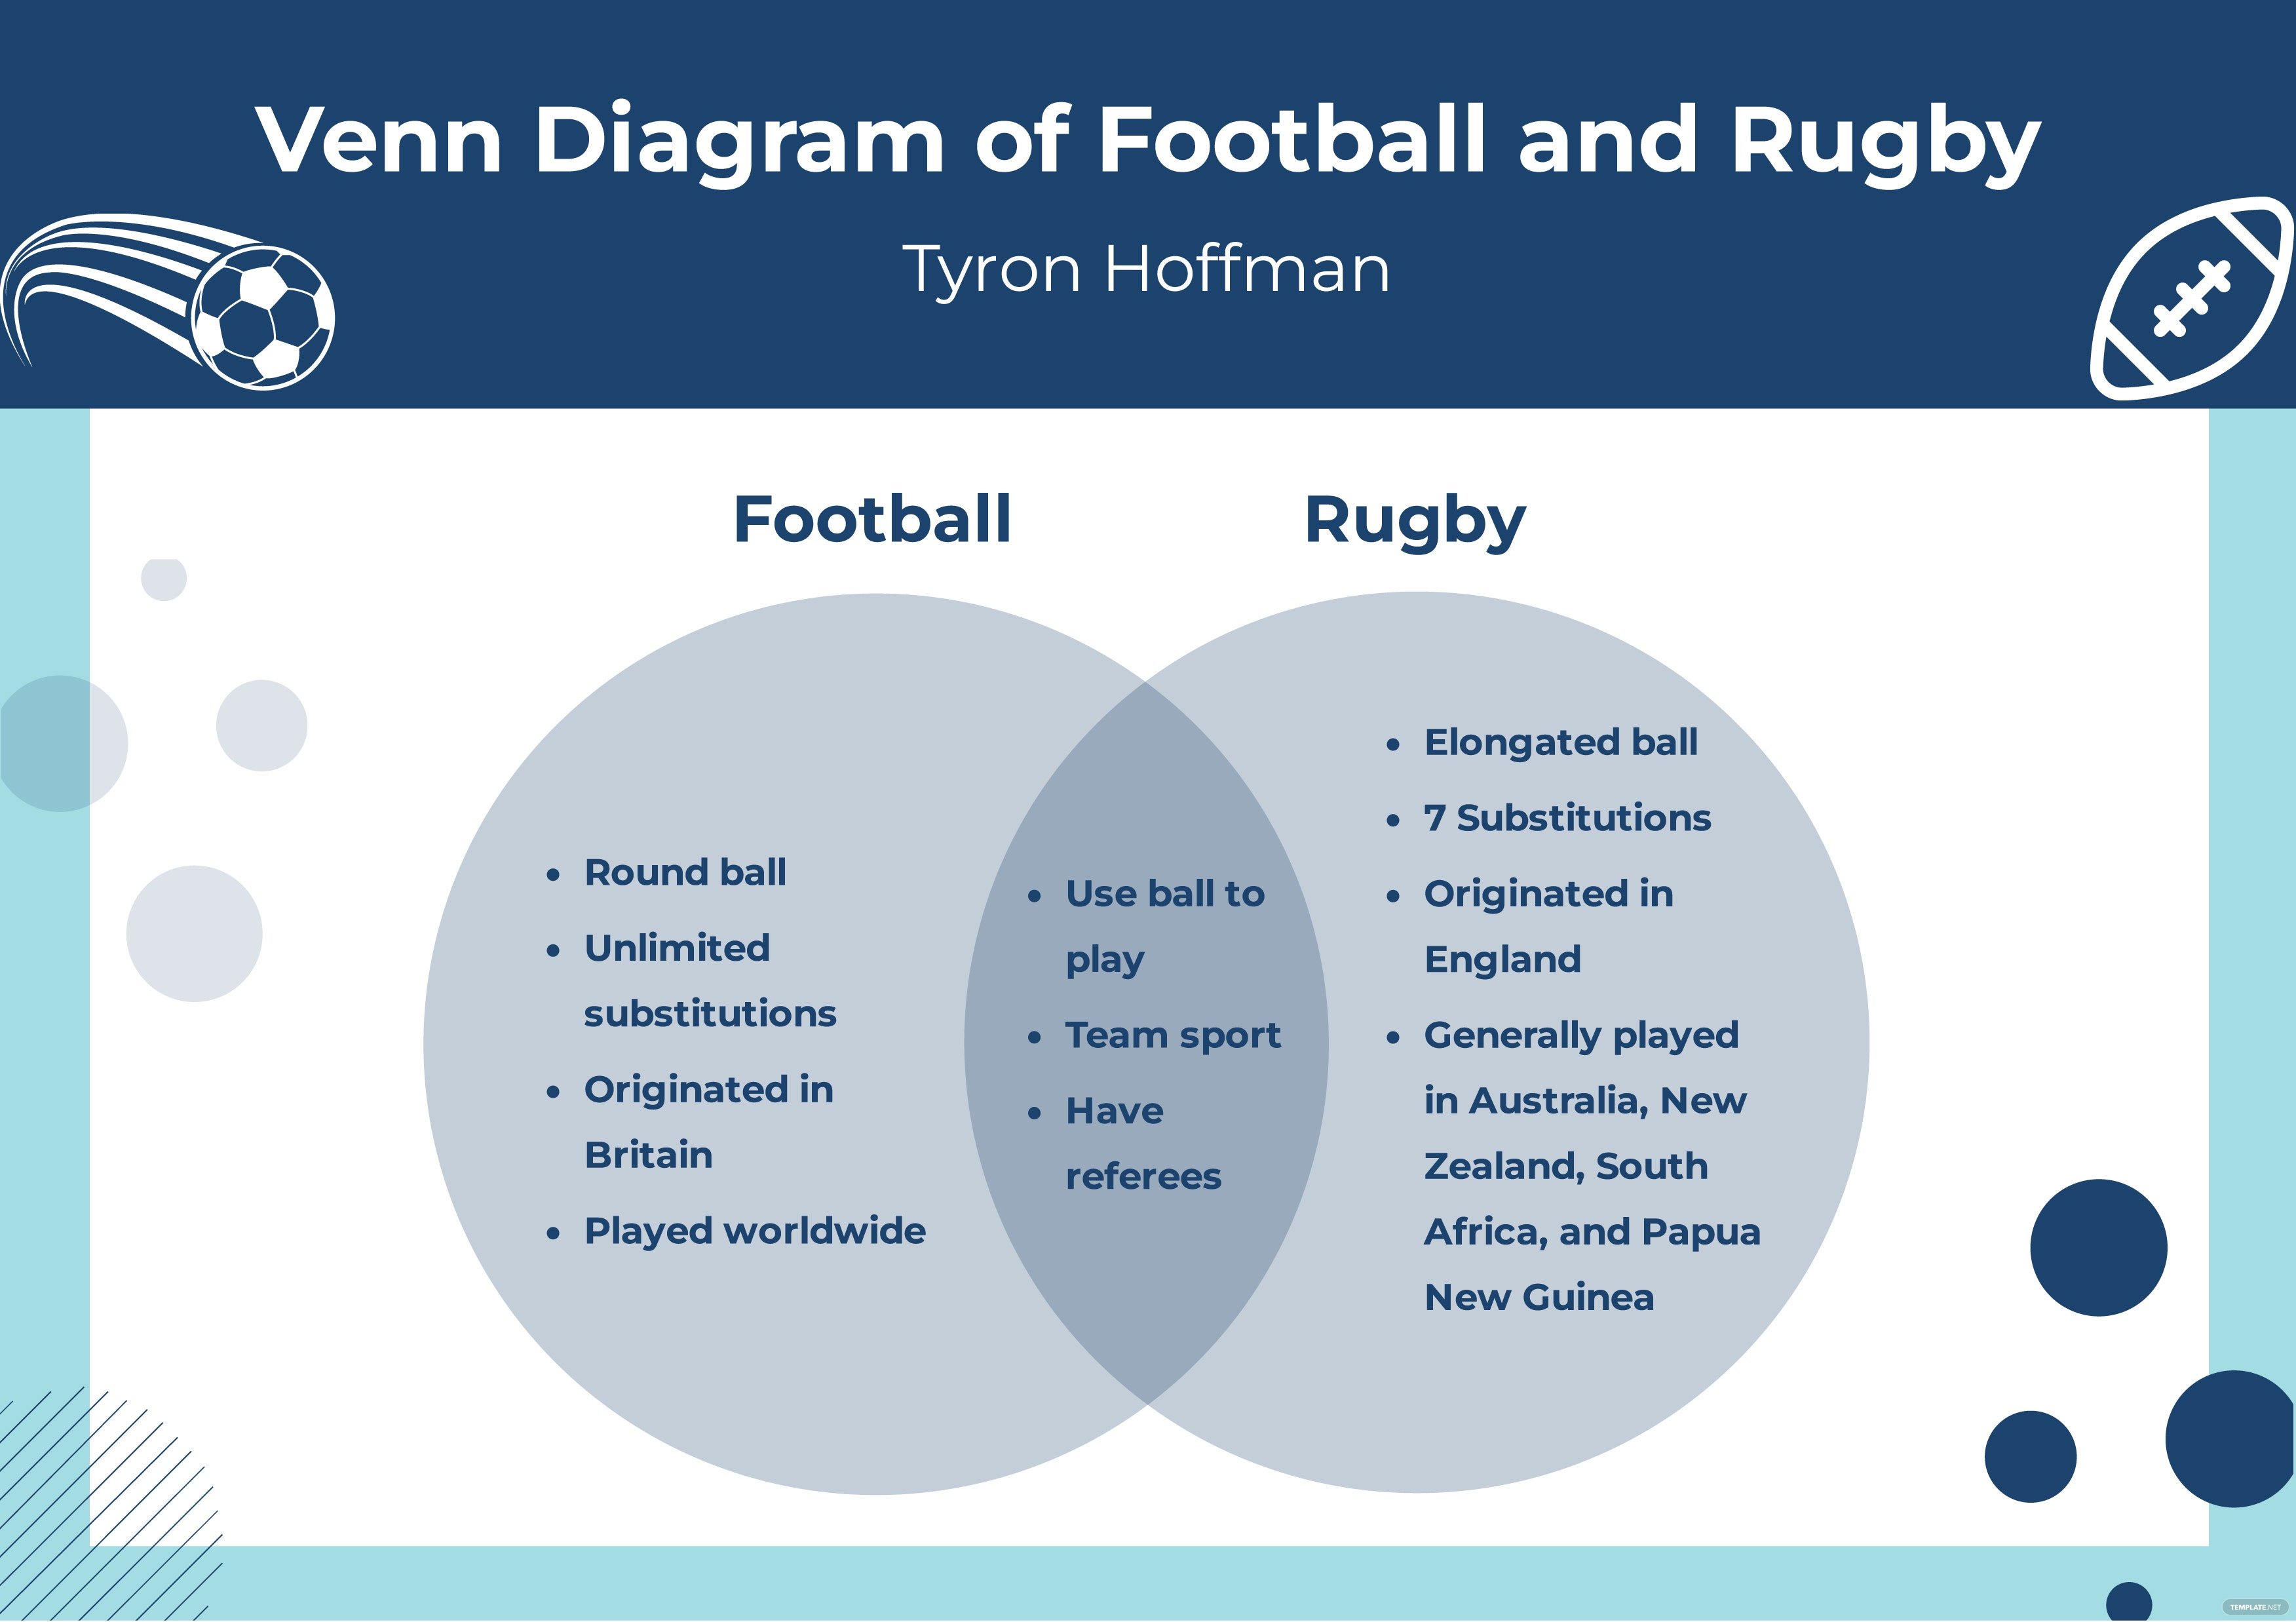
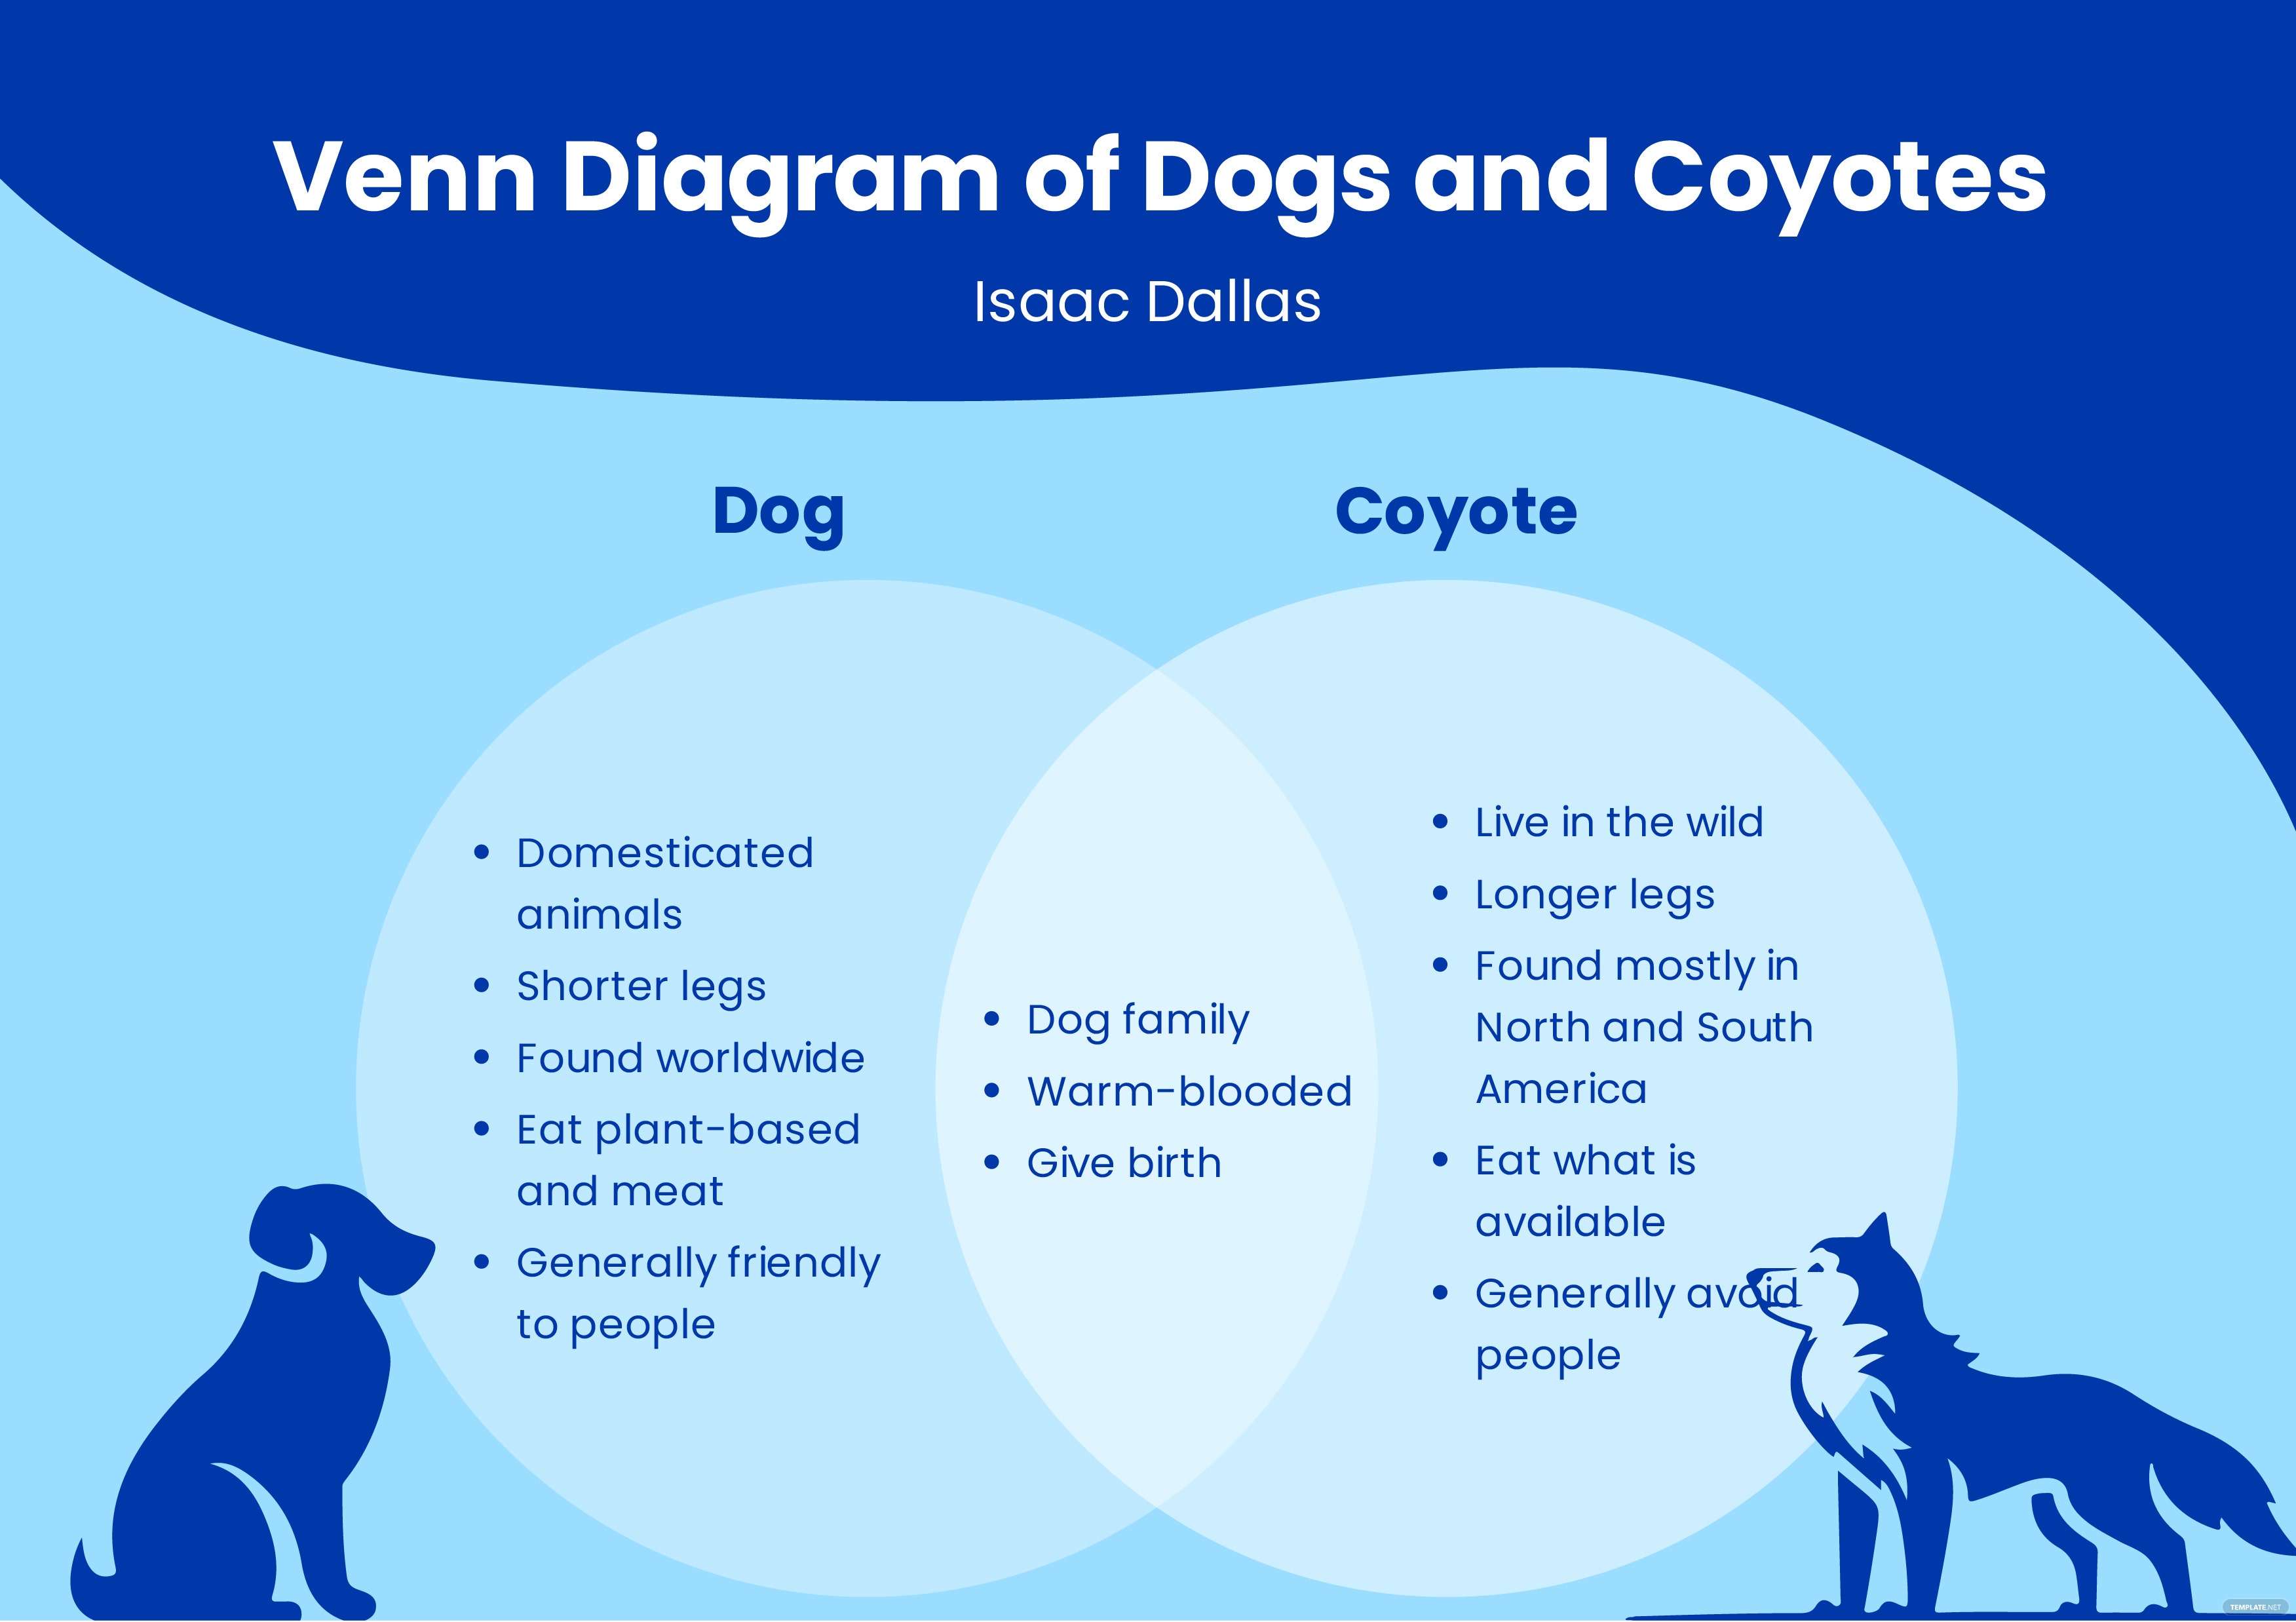
Venn diagram graphic organizers are used to show the differences and similarities between two related topics. In order for your readers to comprehend your contents easier, you can choose to use different sets of colors for your outer circle, which shows your differences, while your inner circle could have a unique color. It is best that your content is written out in bullet form so that your message is clearly delivered to your target audiences.
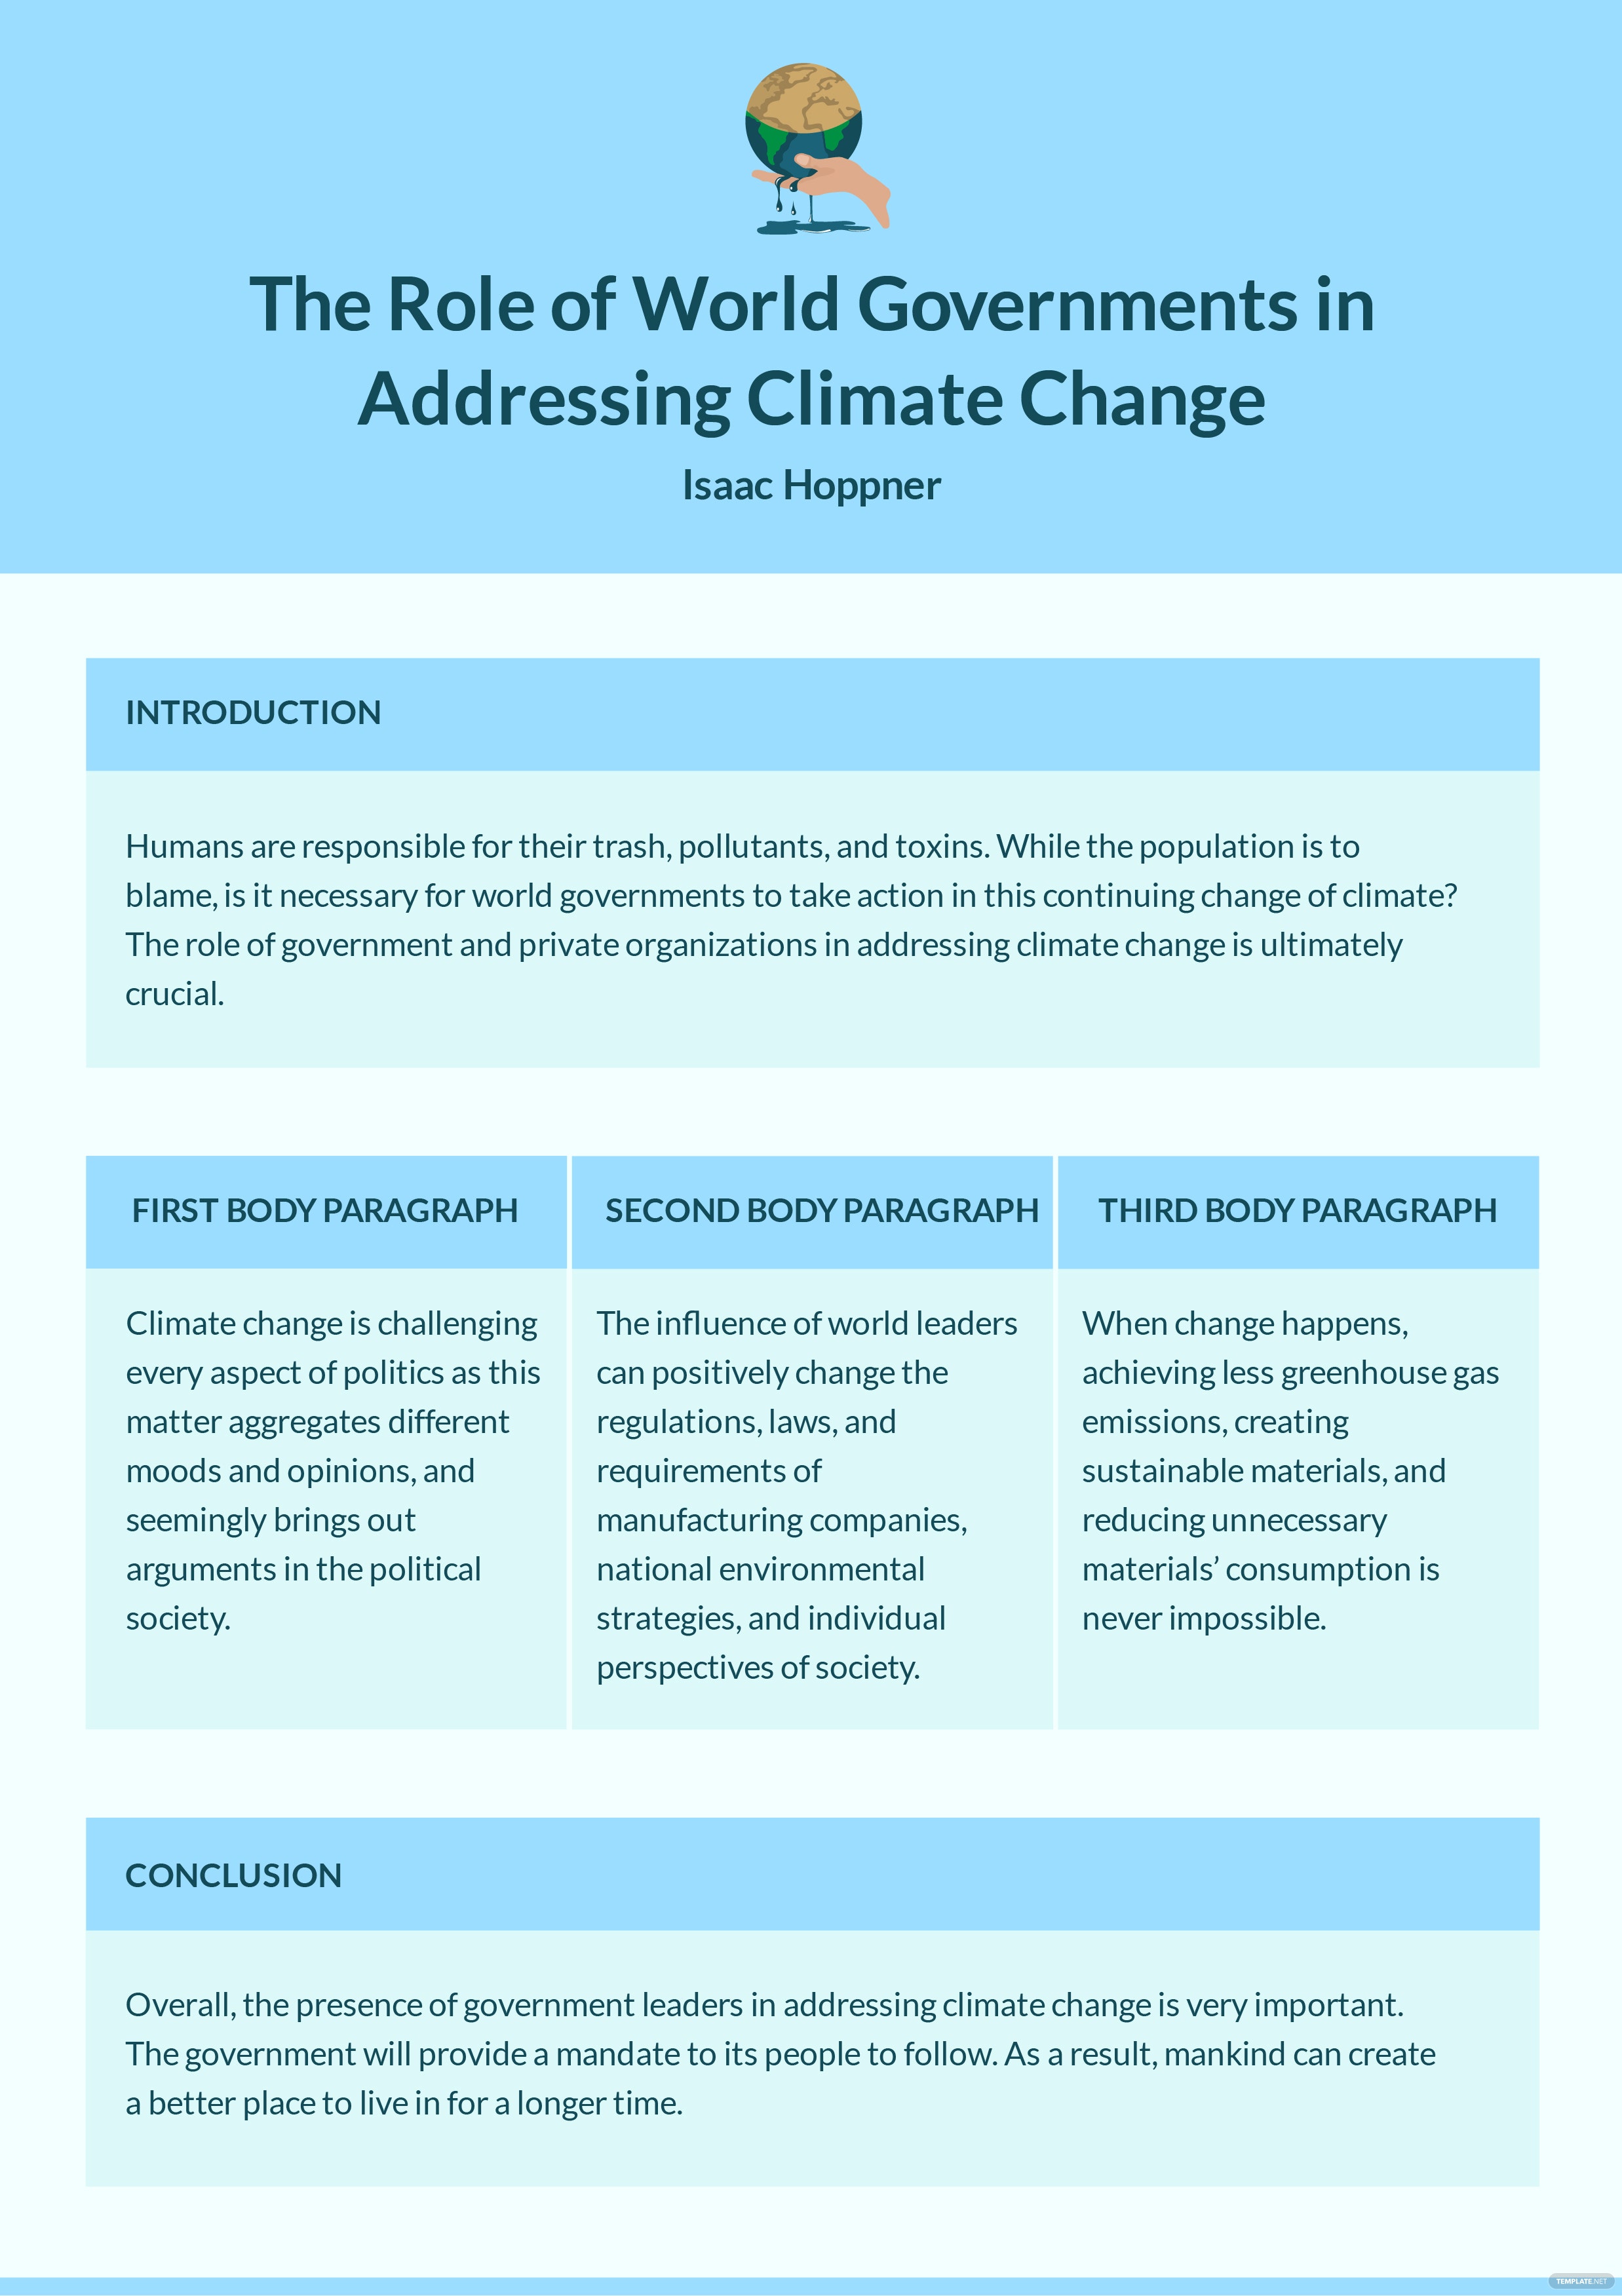
An argumentative essay graphic organizer is used to collect relevant information regarding a topic you are researching. Just like the image presented, you can divide the data you have gathered into three parts; namely, the introduction, different divisions of the body, and lastly the conclusion. You can write out full sentences or phrases as long as they don’t confuse the reader.
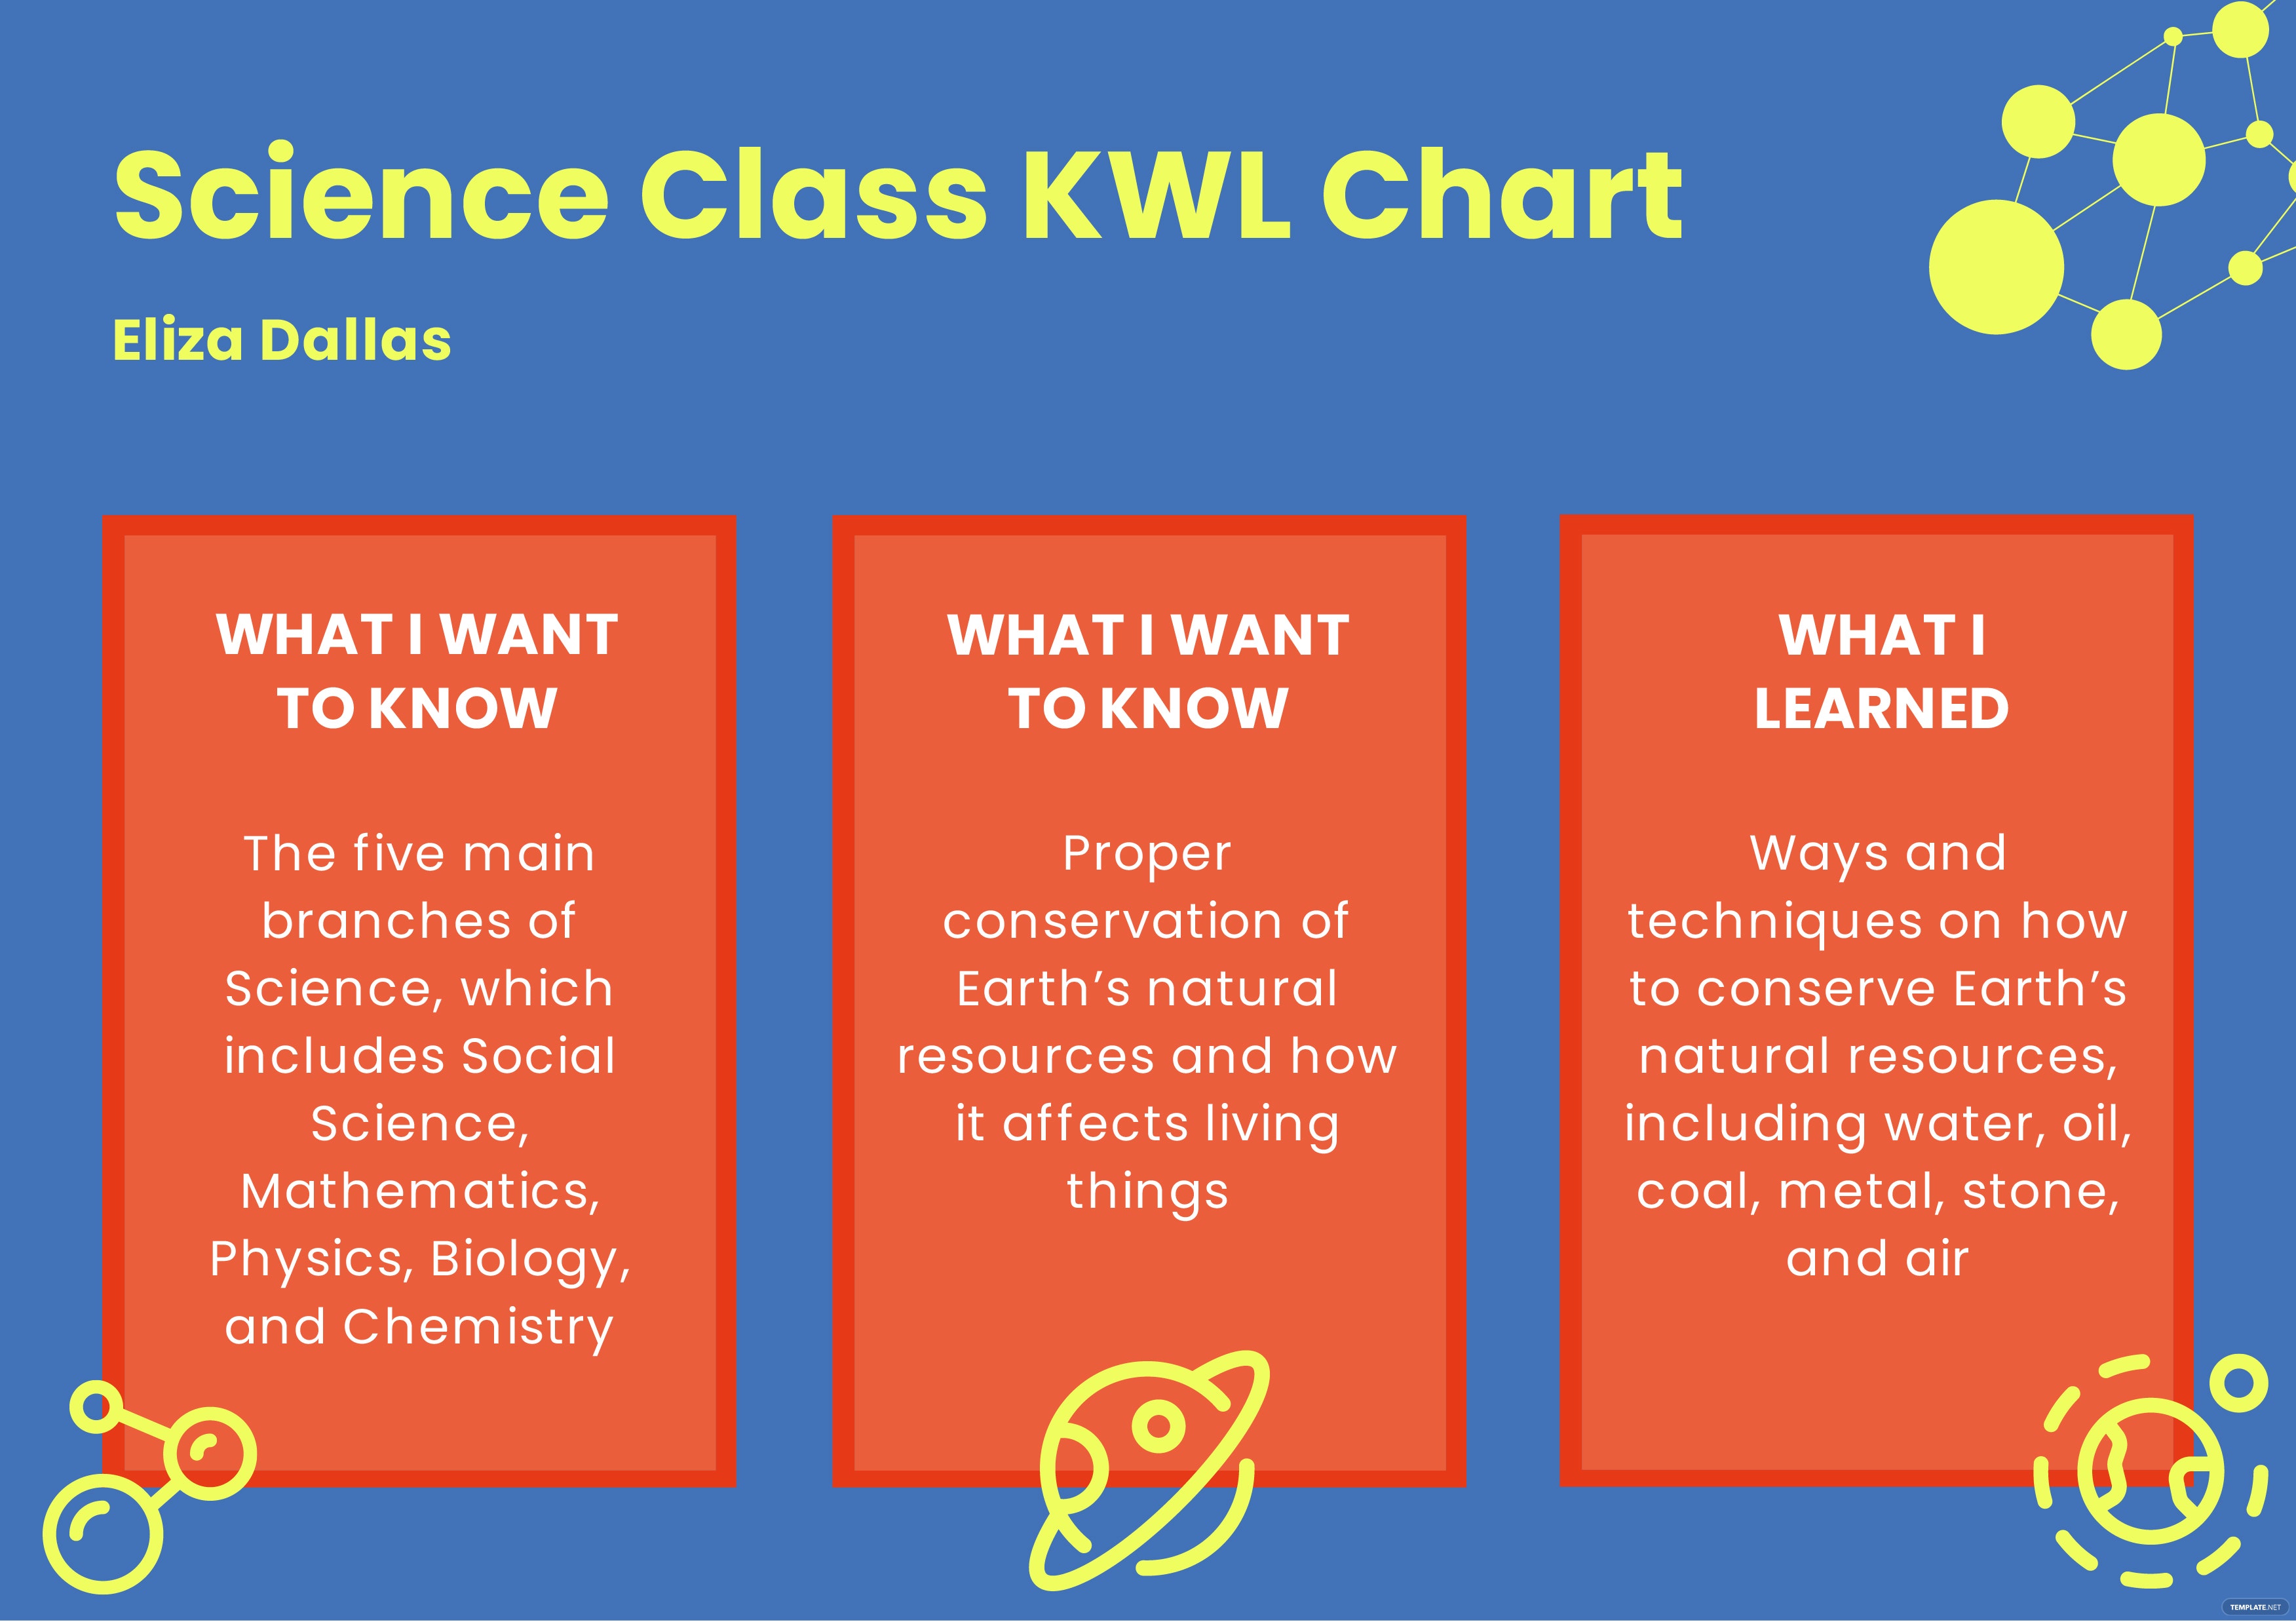
Graphic organizers can also act as an alternative substitution for note-taking so that when scholars do brainstorm or go through the process of lesson integration, it applies to their central nervous system much more quickly. There are various forms of graphics you can use as a student, but the most important thing to remember is to have a style that can easily contain content. Present your content and information concisely through the note taking graphic organizer available on this site.
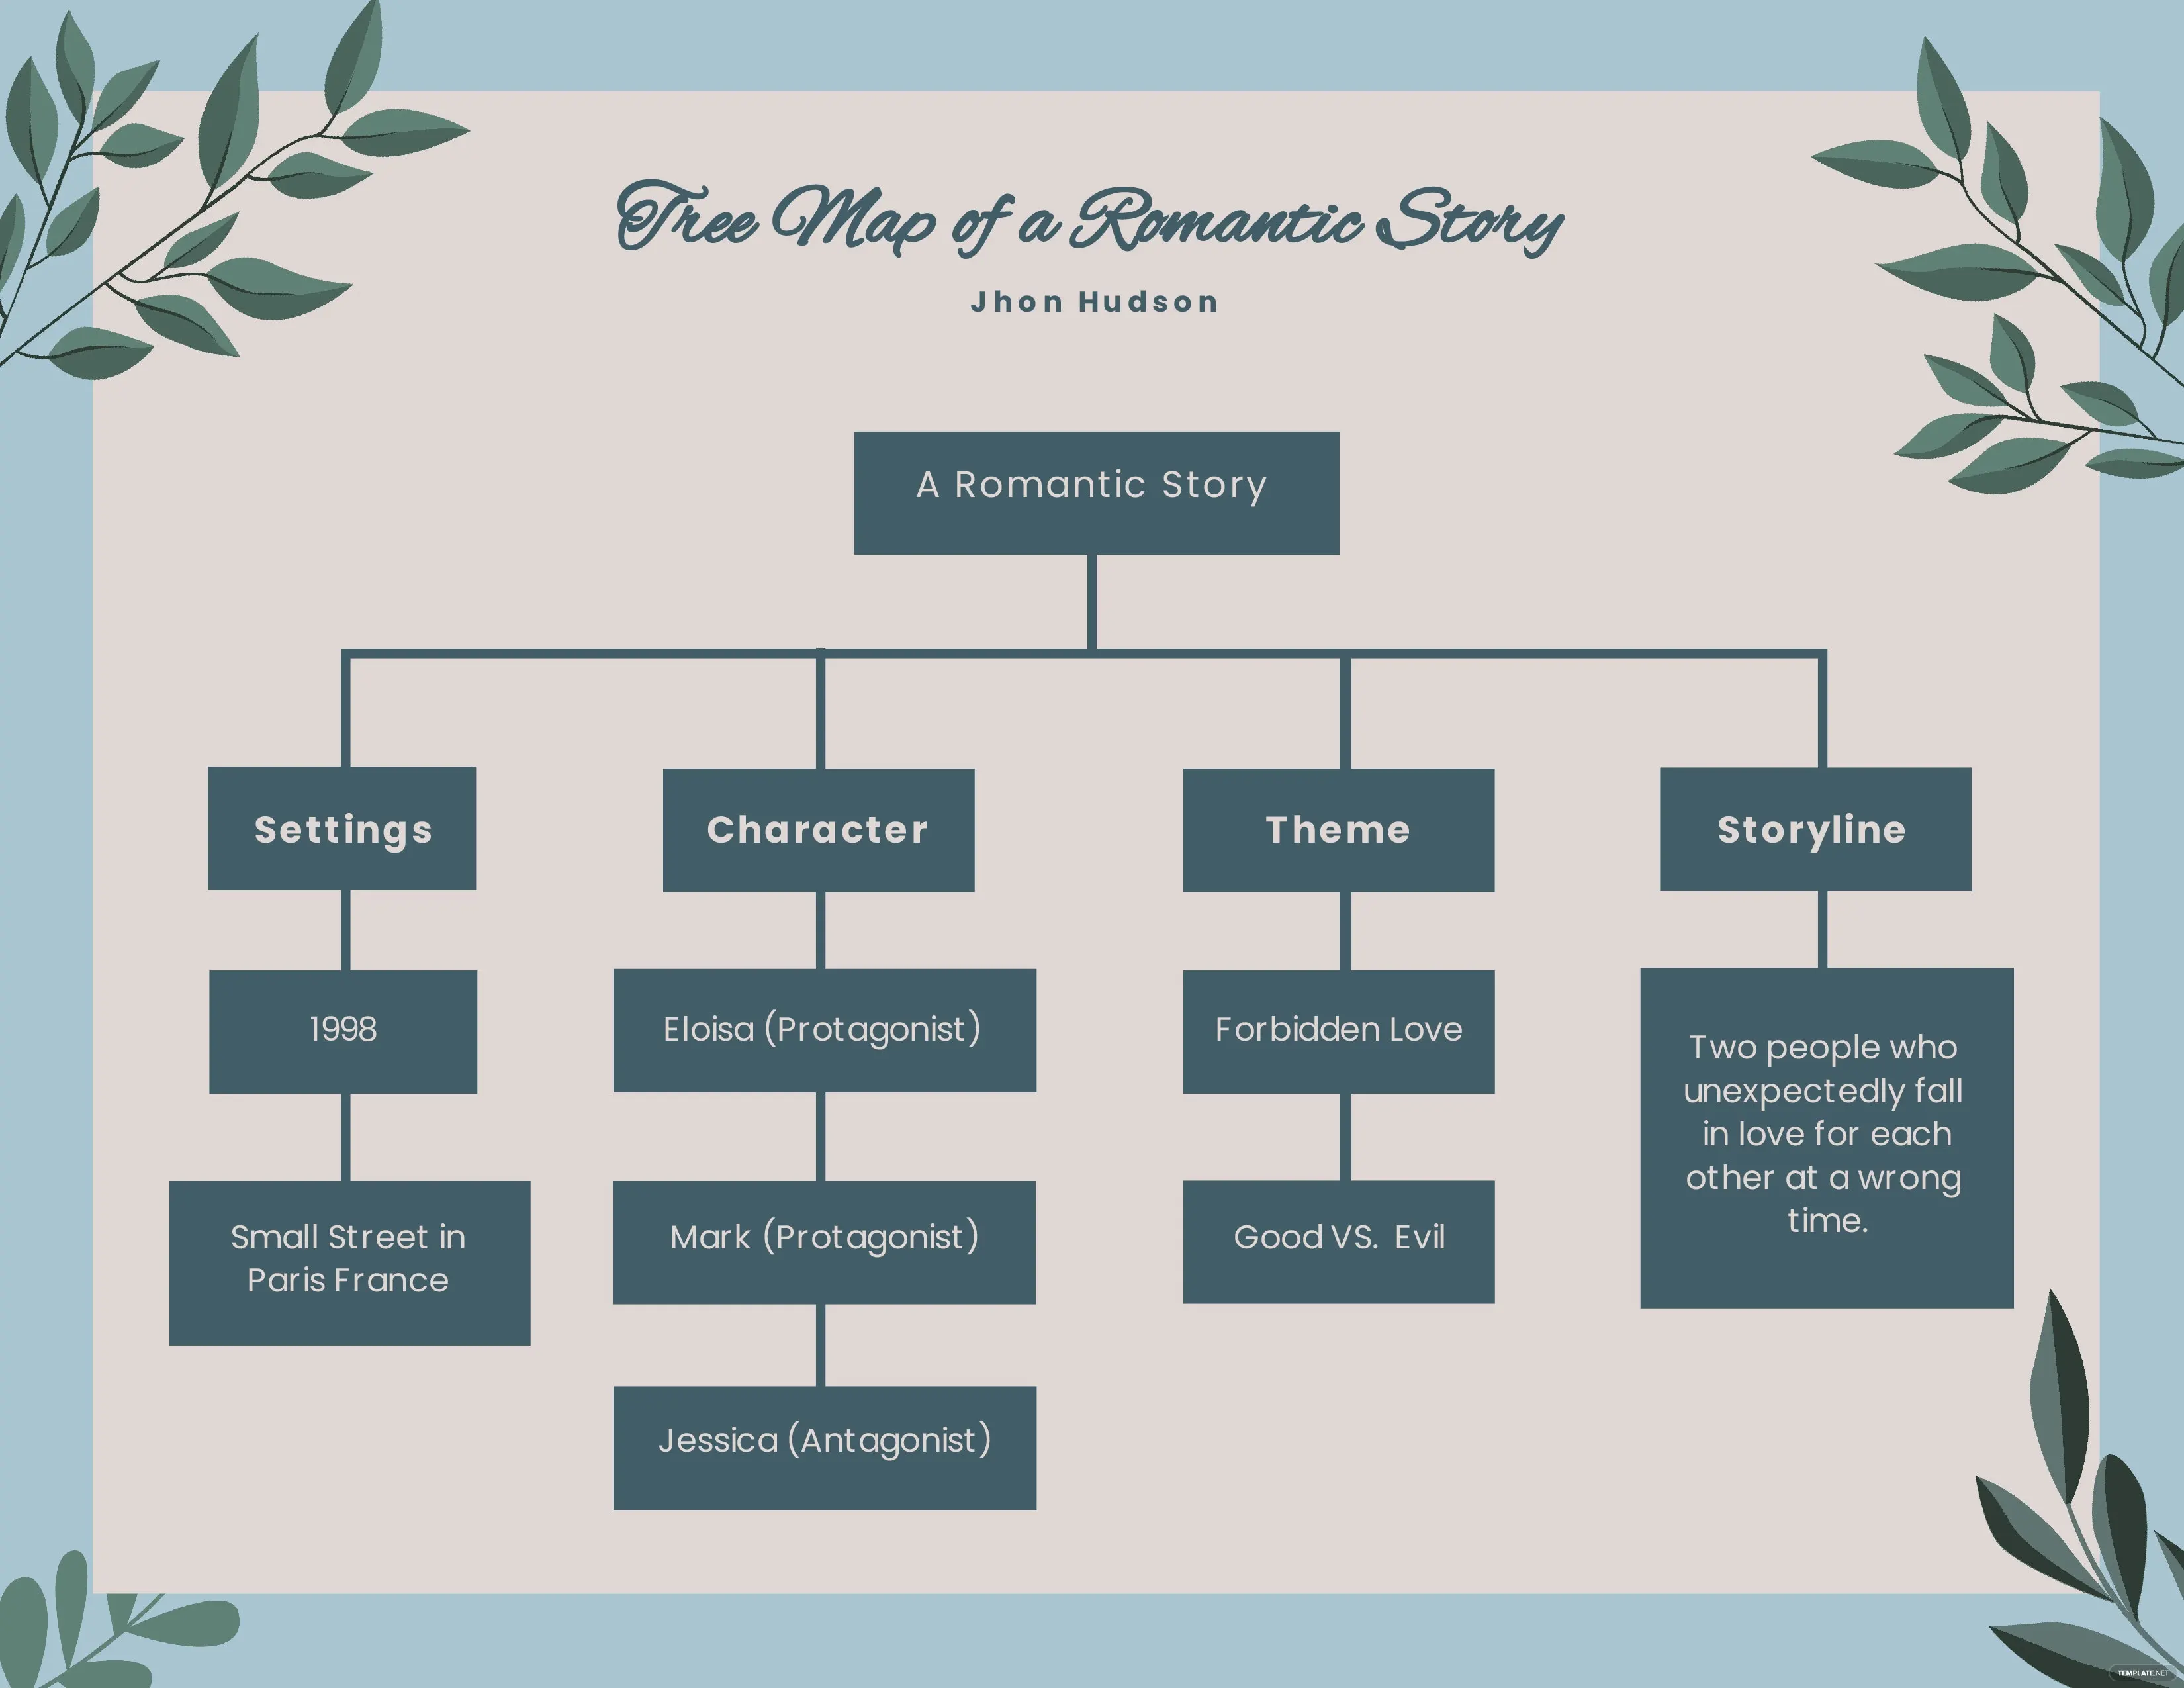
A tree map graphic organizer is used to lay out details that handle important information such as the characters or plot of a film or fiction novel, which at some certain level of data, may be overlooked. A tree map may appear plain at first, but you don’t have to stick to that layout when you can provide a clearer conceptual diagram your readers can follow with speed. Just like this example presented below.
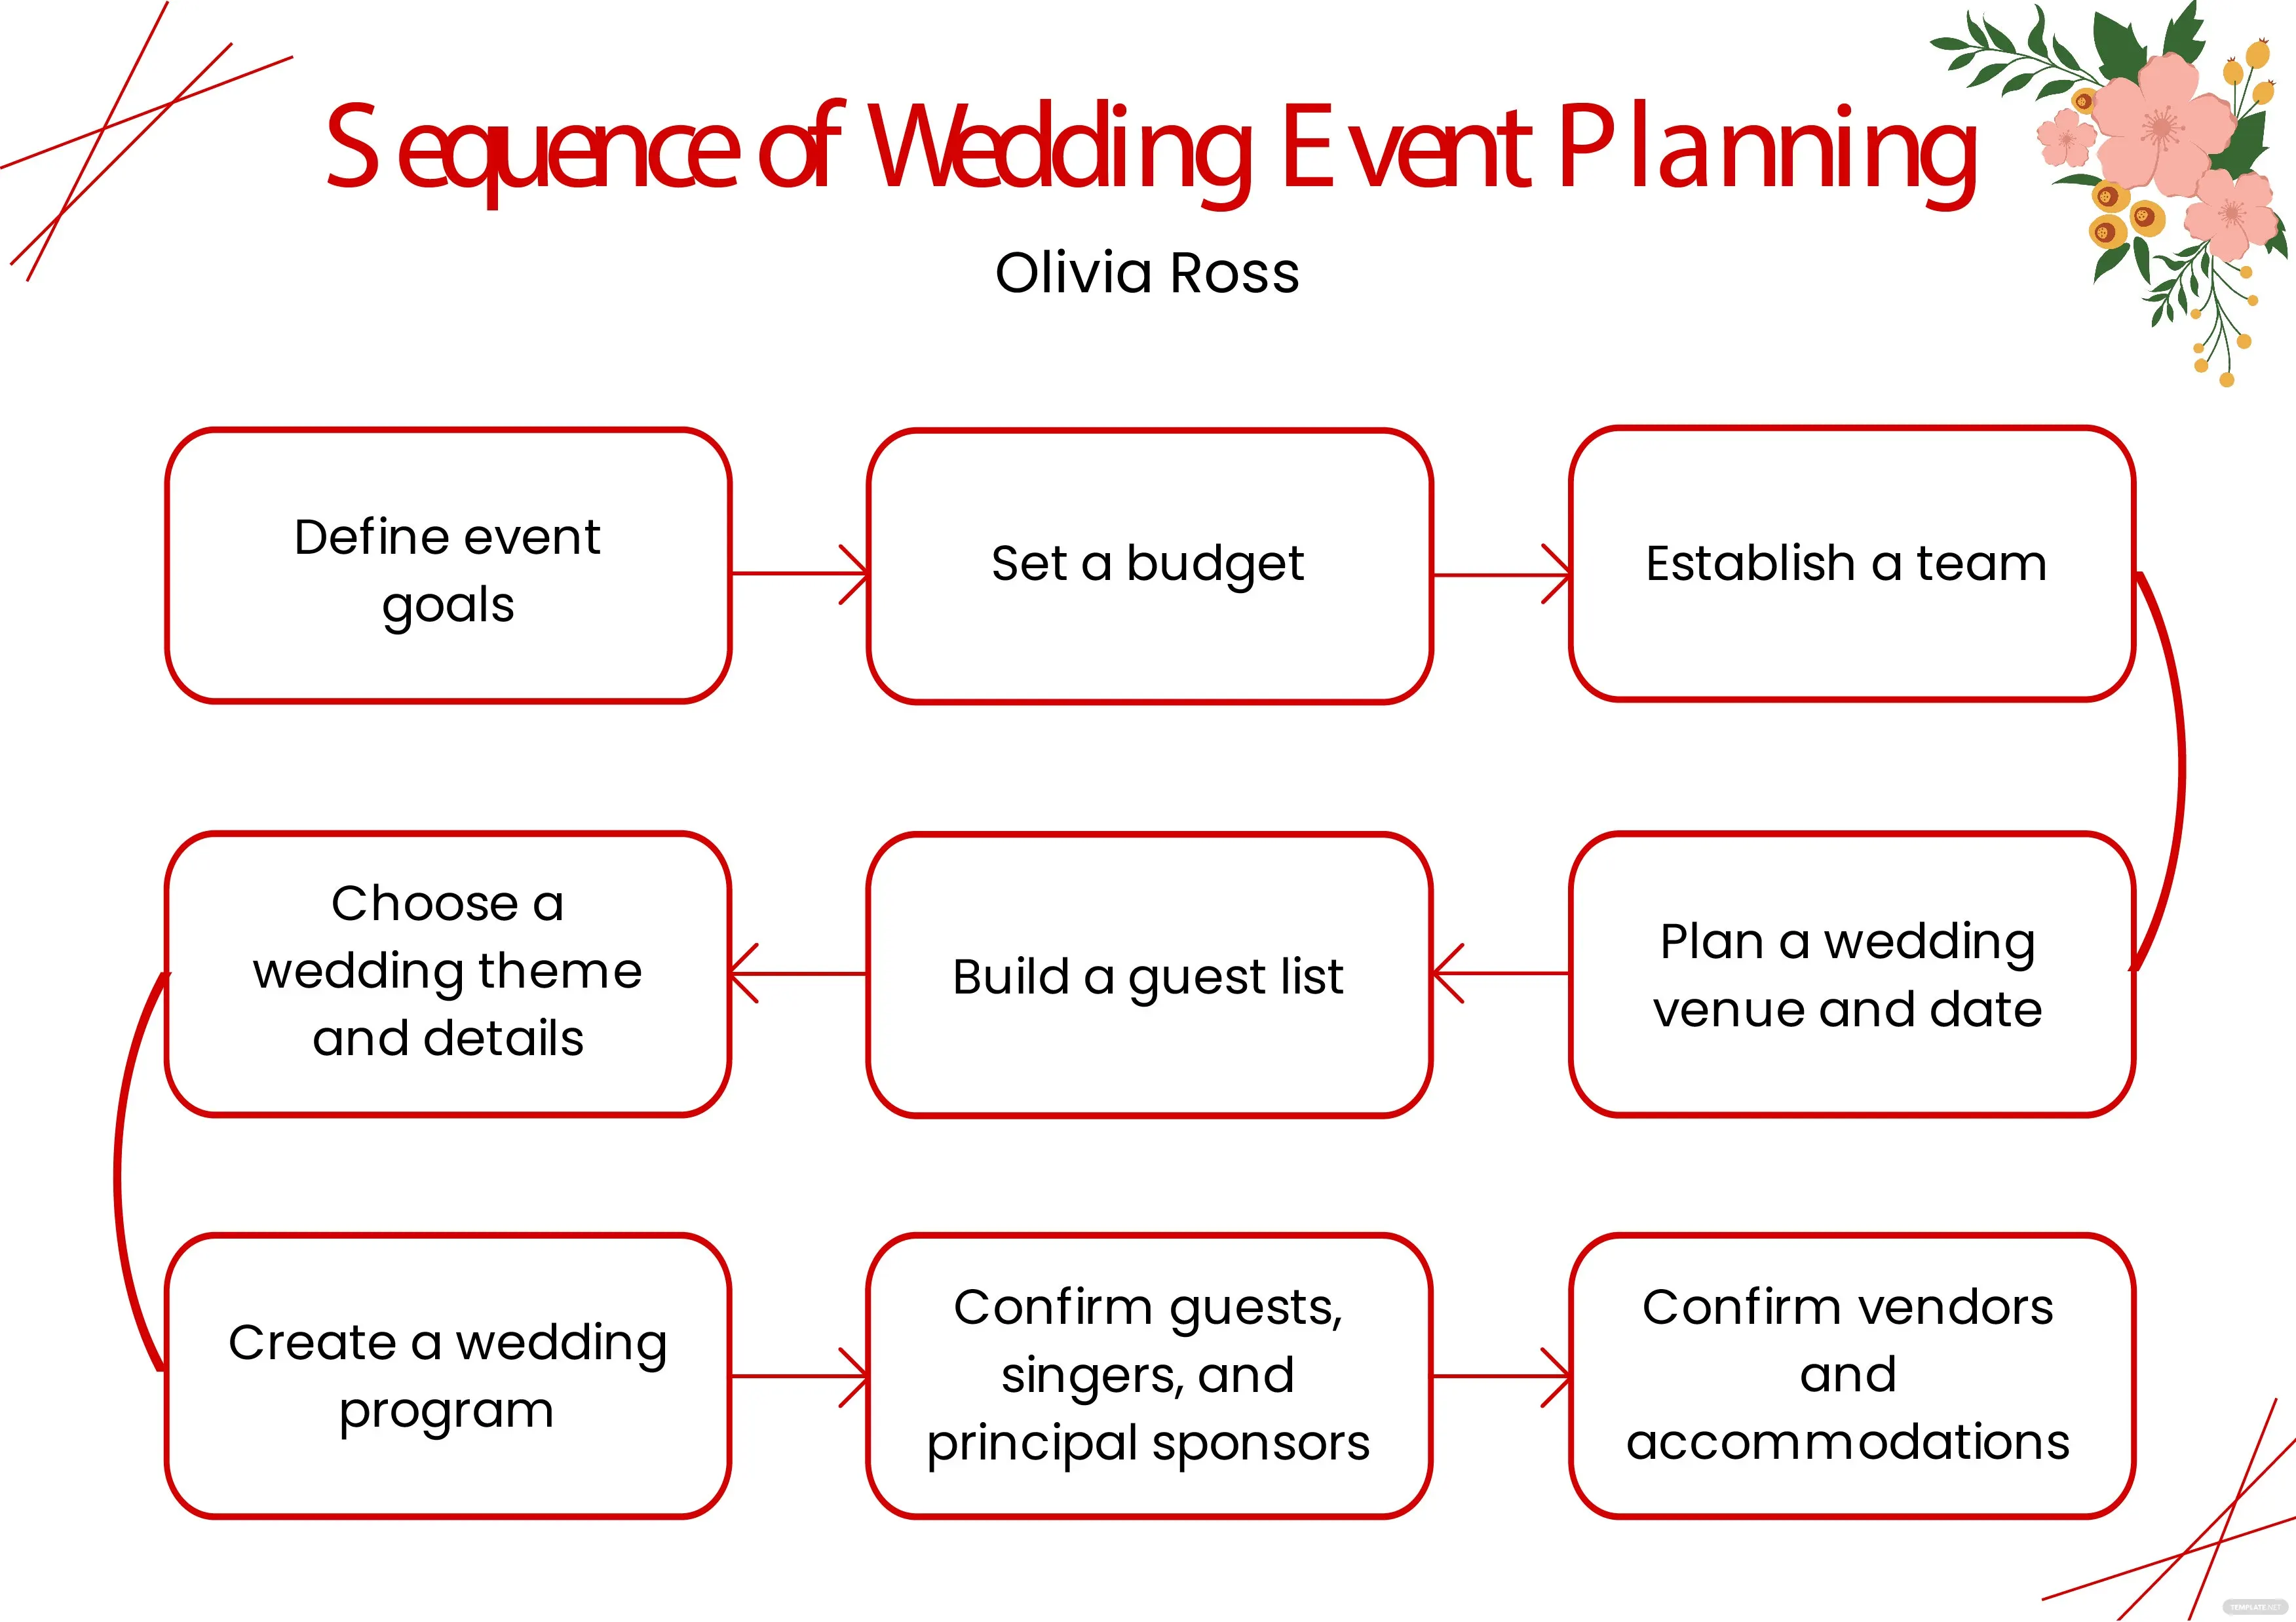
A series of happenings can be tracked better with a graphic organizer as it shows the logical sequences of what happened during an event. Even interviews can work better if you use a graphic organizer that will present what the client has to say regarding a business-related event, be it at the office or at a cafe. Interested sponsors or stakeholders inclined to buy a share within a corporate event could be expressed through a sequence graphic organizer, to sum up, an exchange.
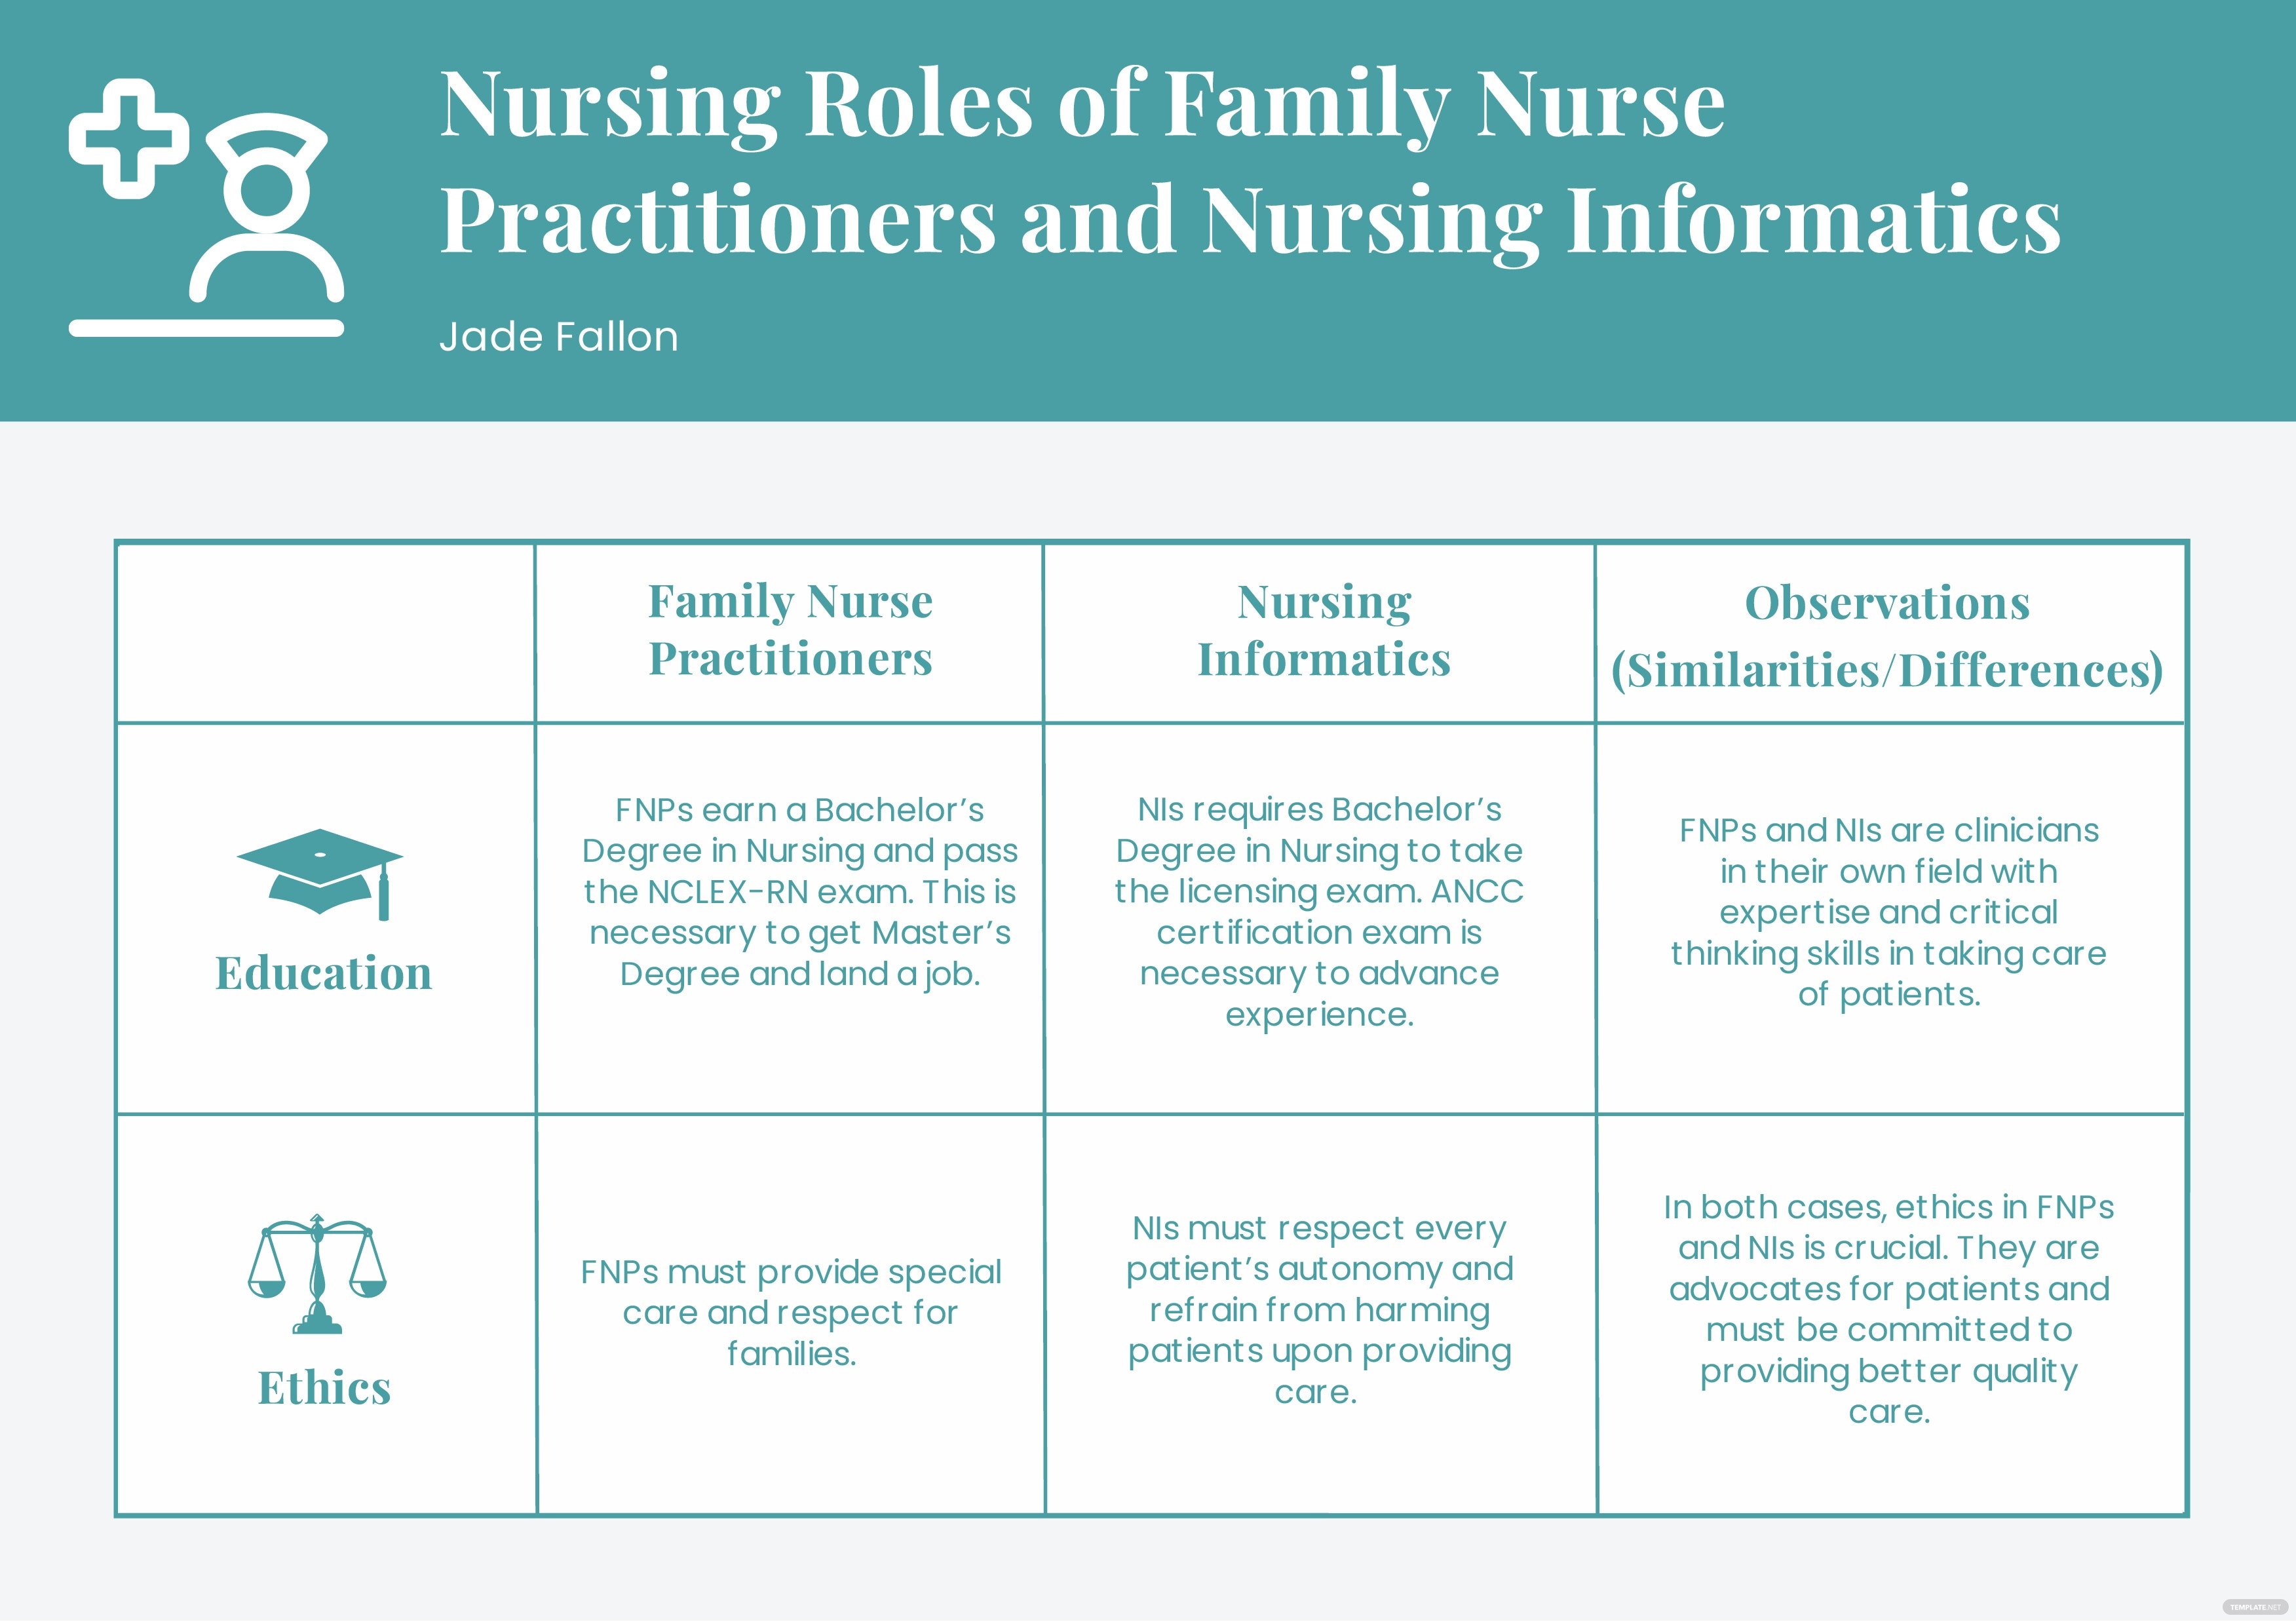
Nurses, like other occupations, would have various responsibilities under their belt. Curious folks may want to know what role they receive as part of their training, and what better way to present that than with a nursing roles graphic organizer. The title of this type of graphic organizer is presented at the top, while the container and content follow at the middle of the page.
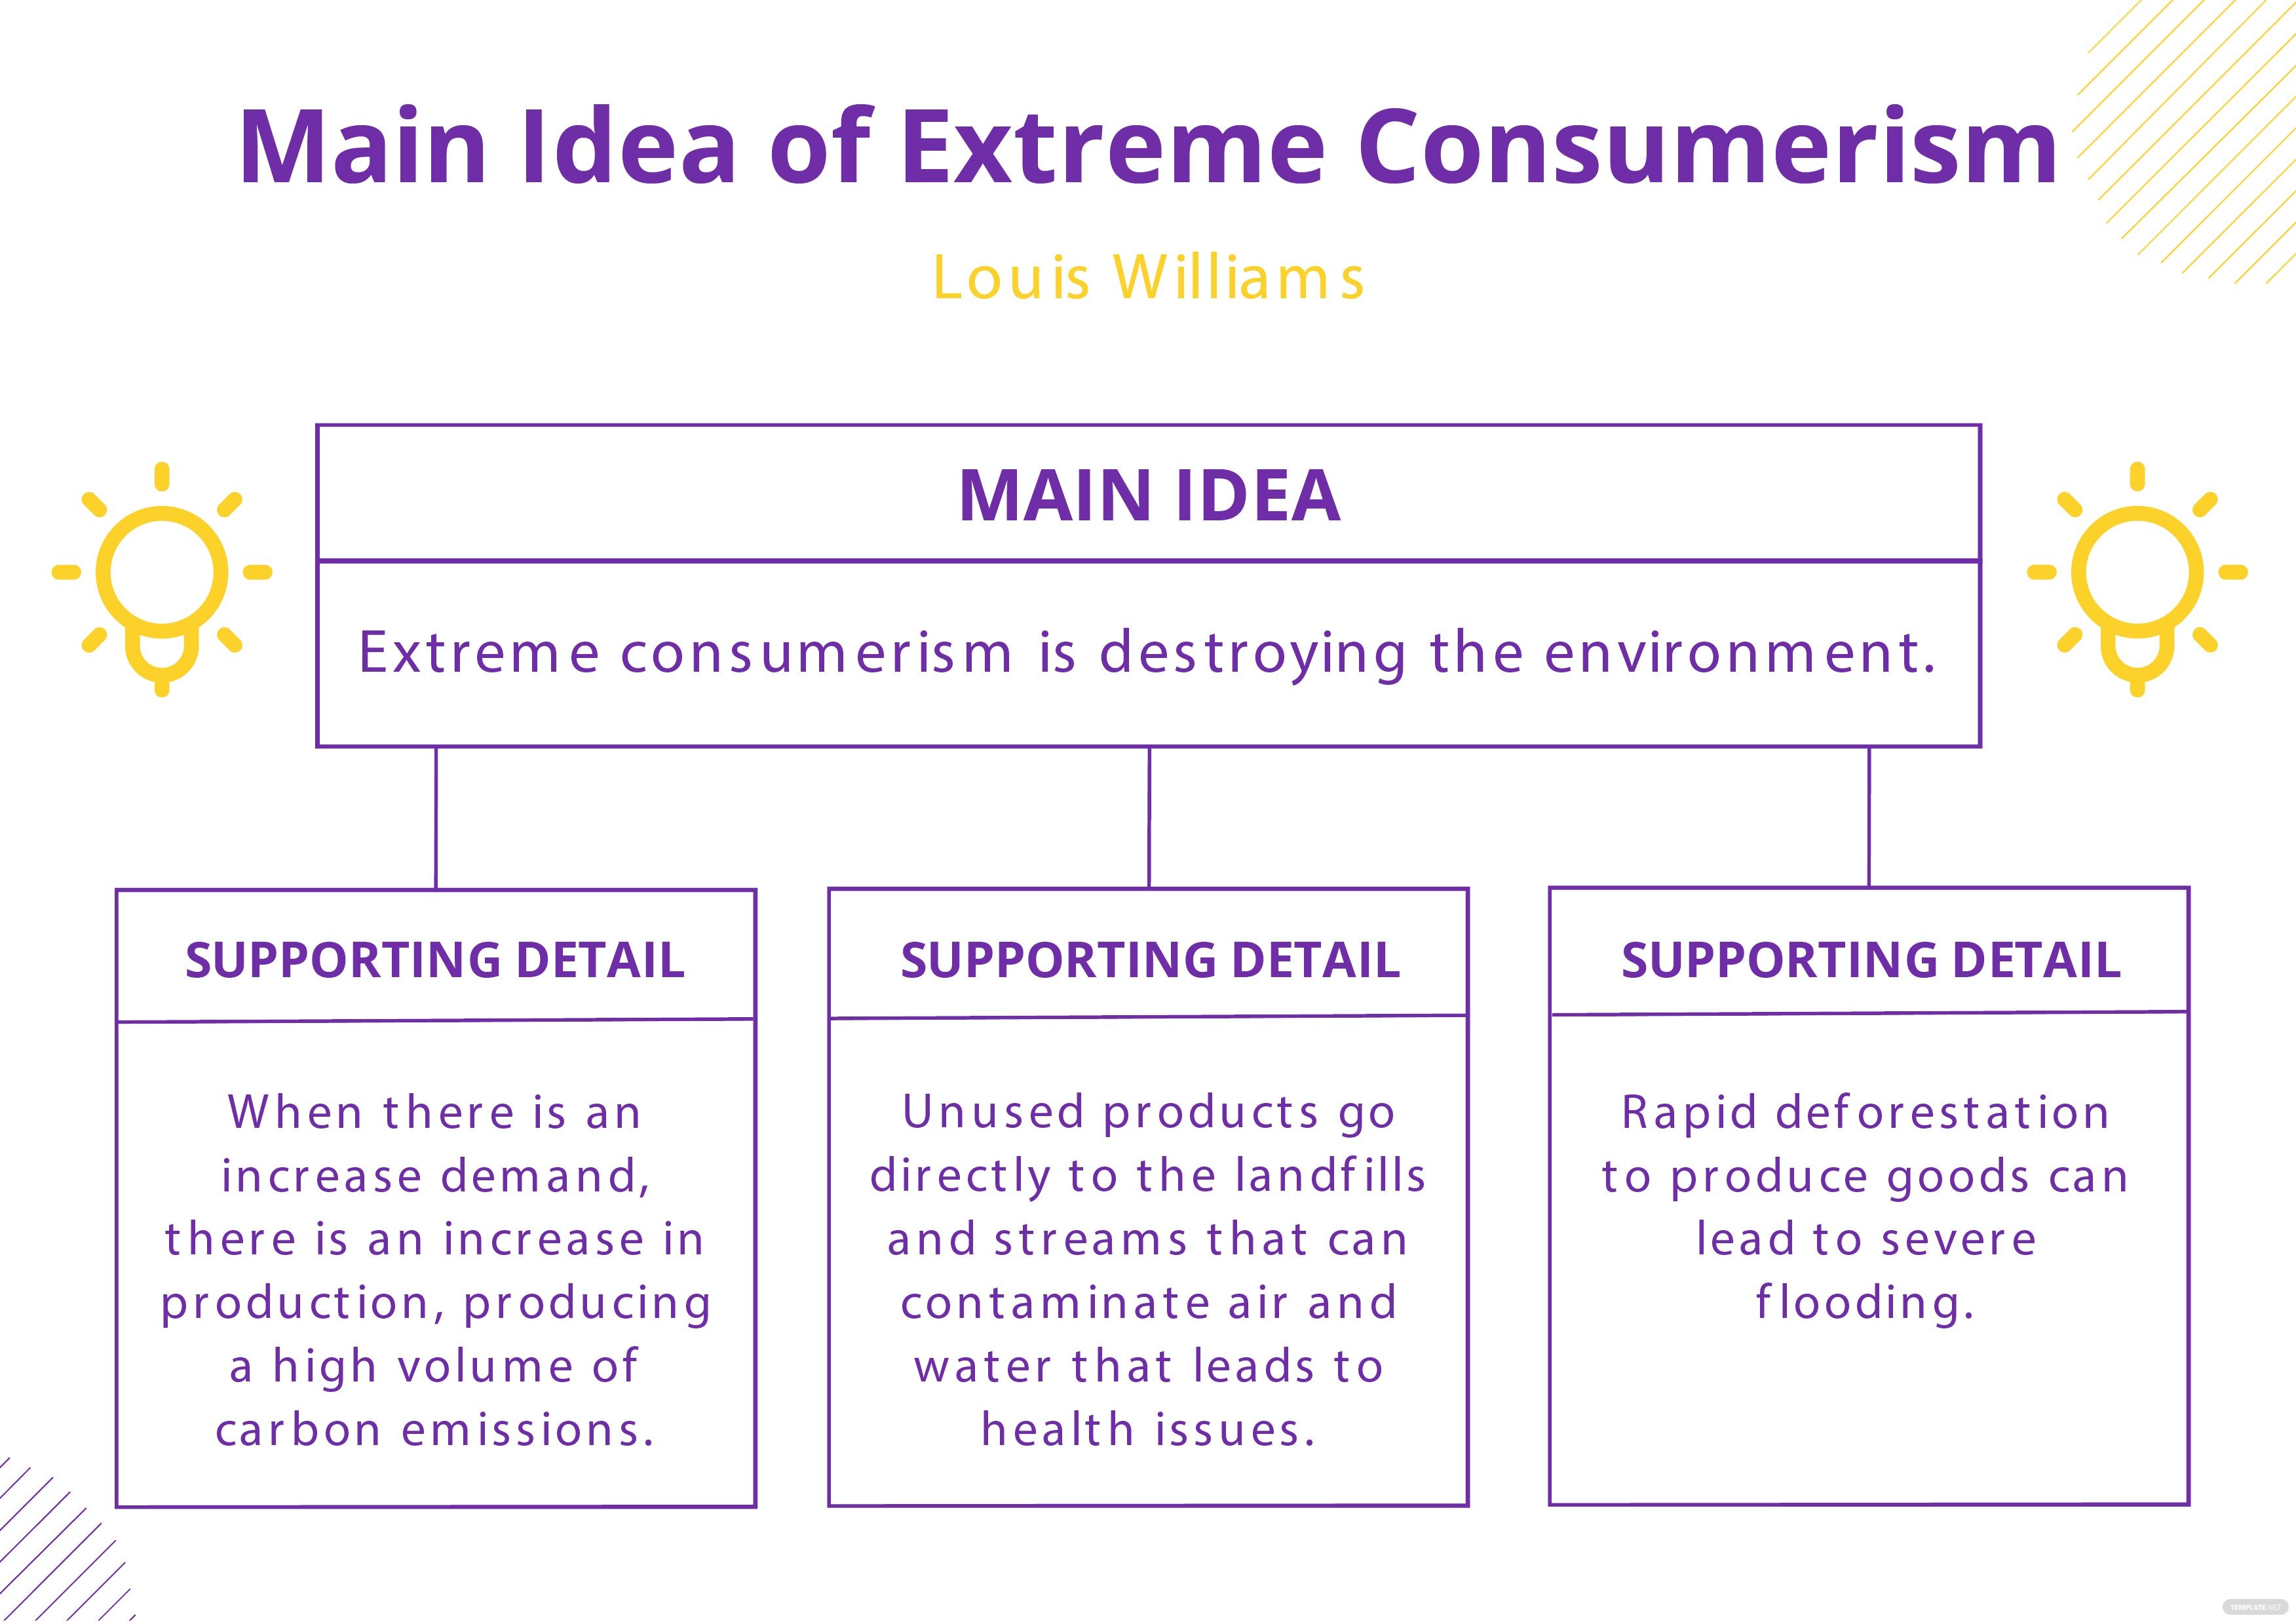
A main idea graphic organizer presents the central concept of a topic, story, or discussion. Its content can be found in the upper container of the document, which may also act as its graphic organizer title. This is then, followed by three or more supporting details, which are written in legible font sizes and styles in the given spaces for your readers to read.
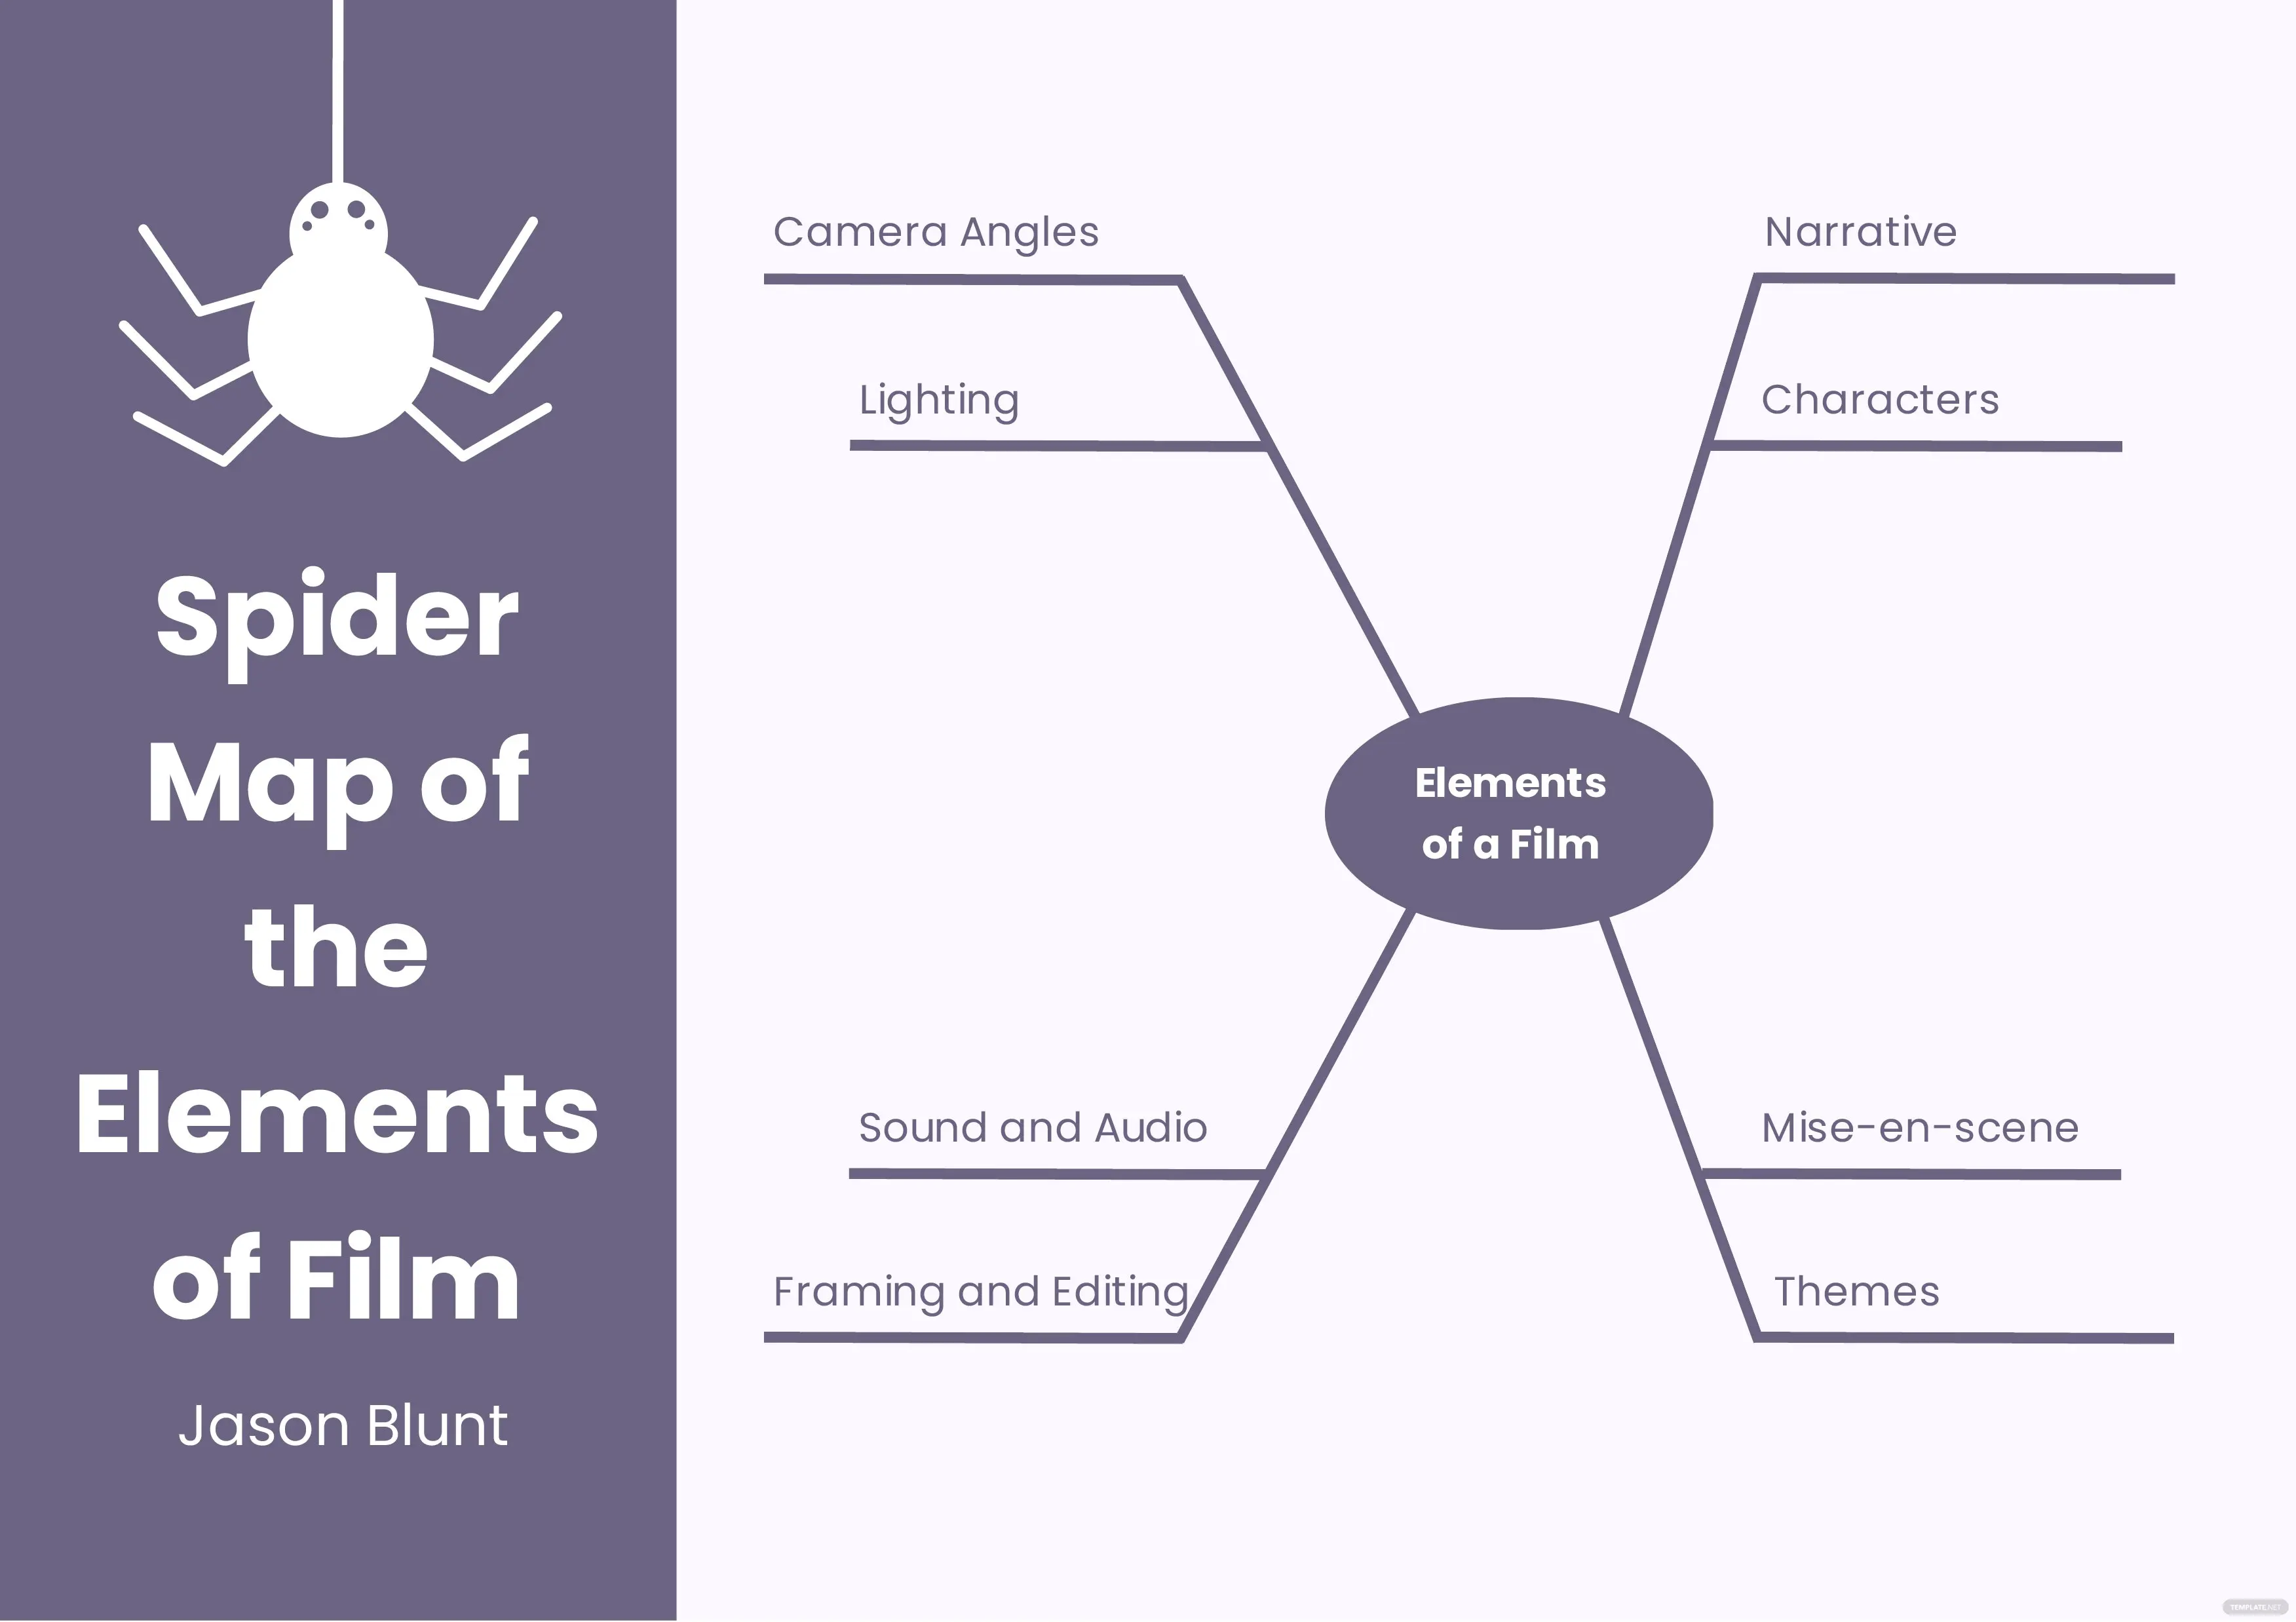
Since spider map graphic organizers are used to showcase the link between the title container and the content that surrounds it, there is no specific order or motion followed by the document. Its external content may be just as important as other editions included on the map. For example, the spider map graphic organizer has the title in the middle and is surrounded by various contents that tie themselves to the middle.
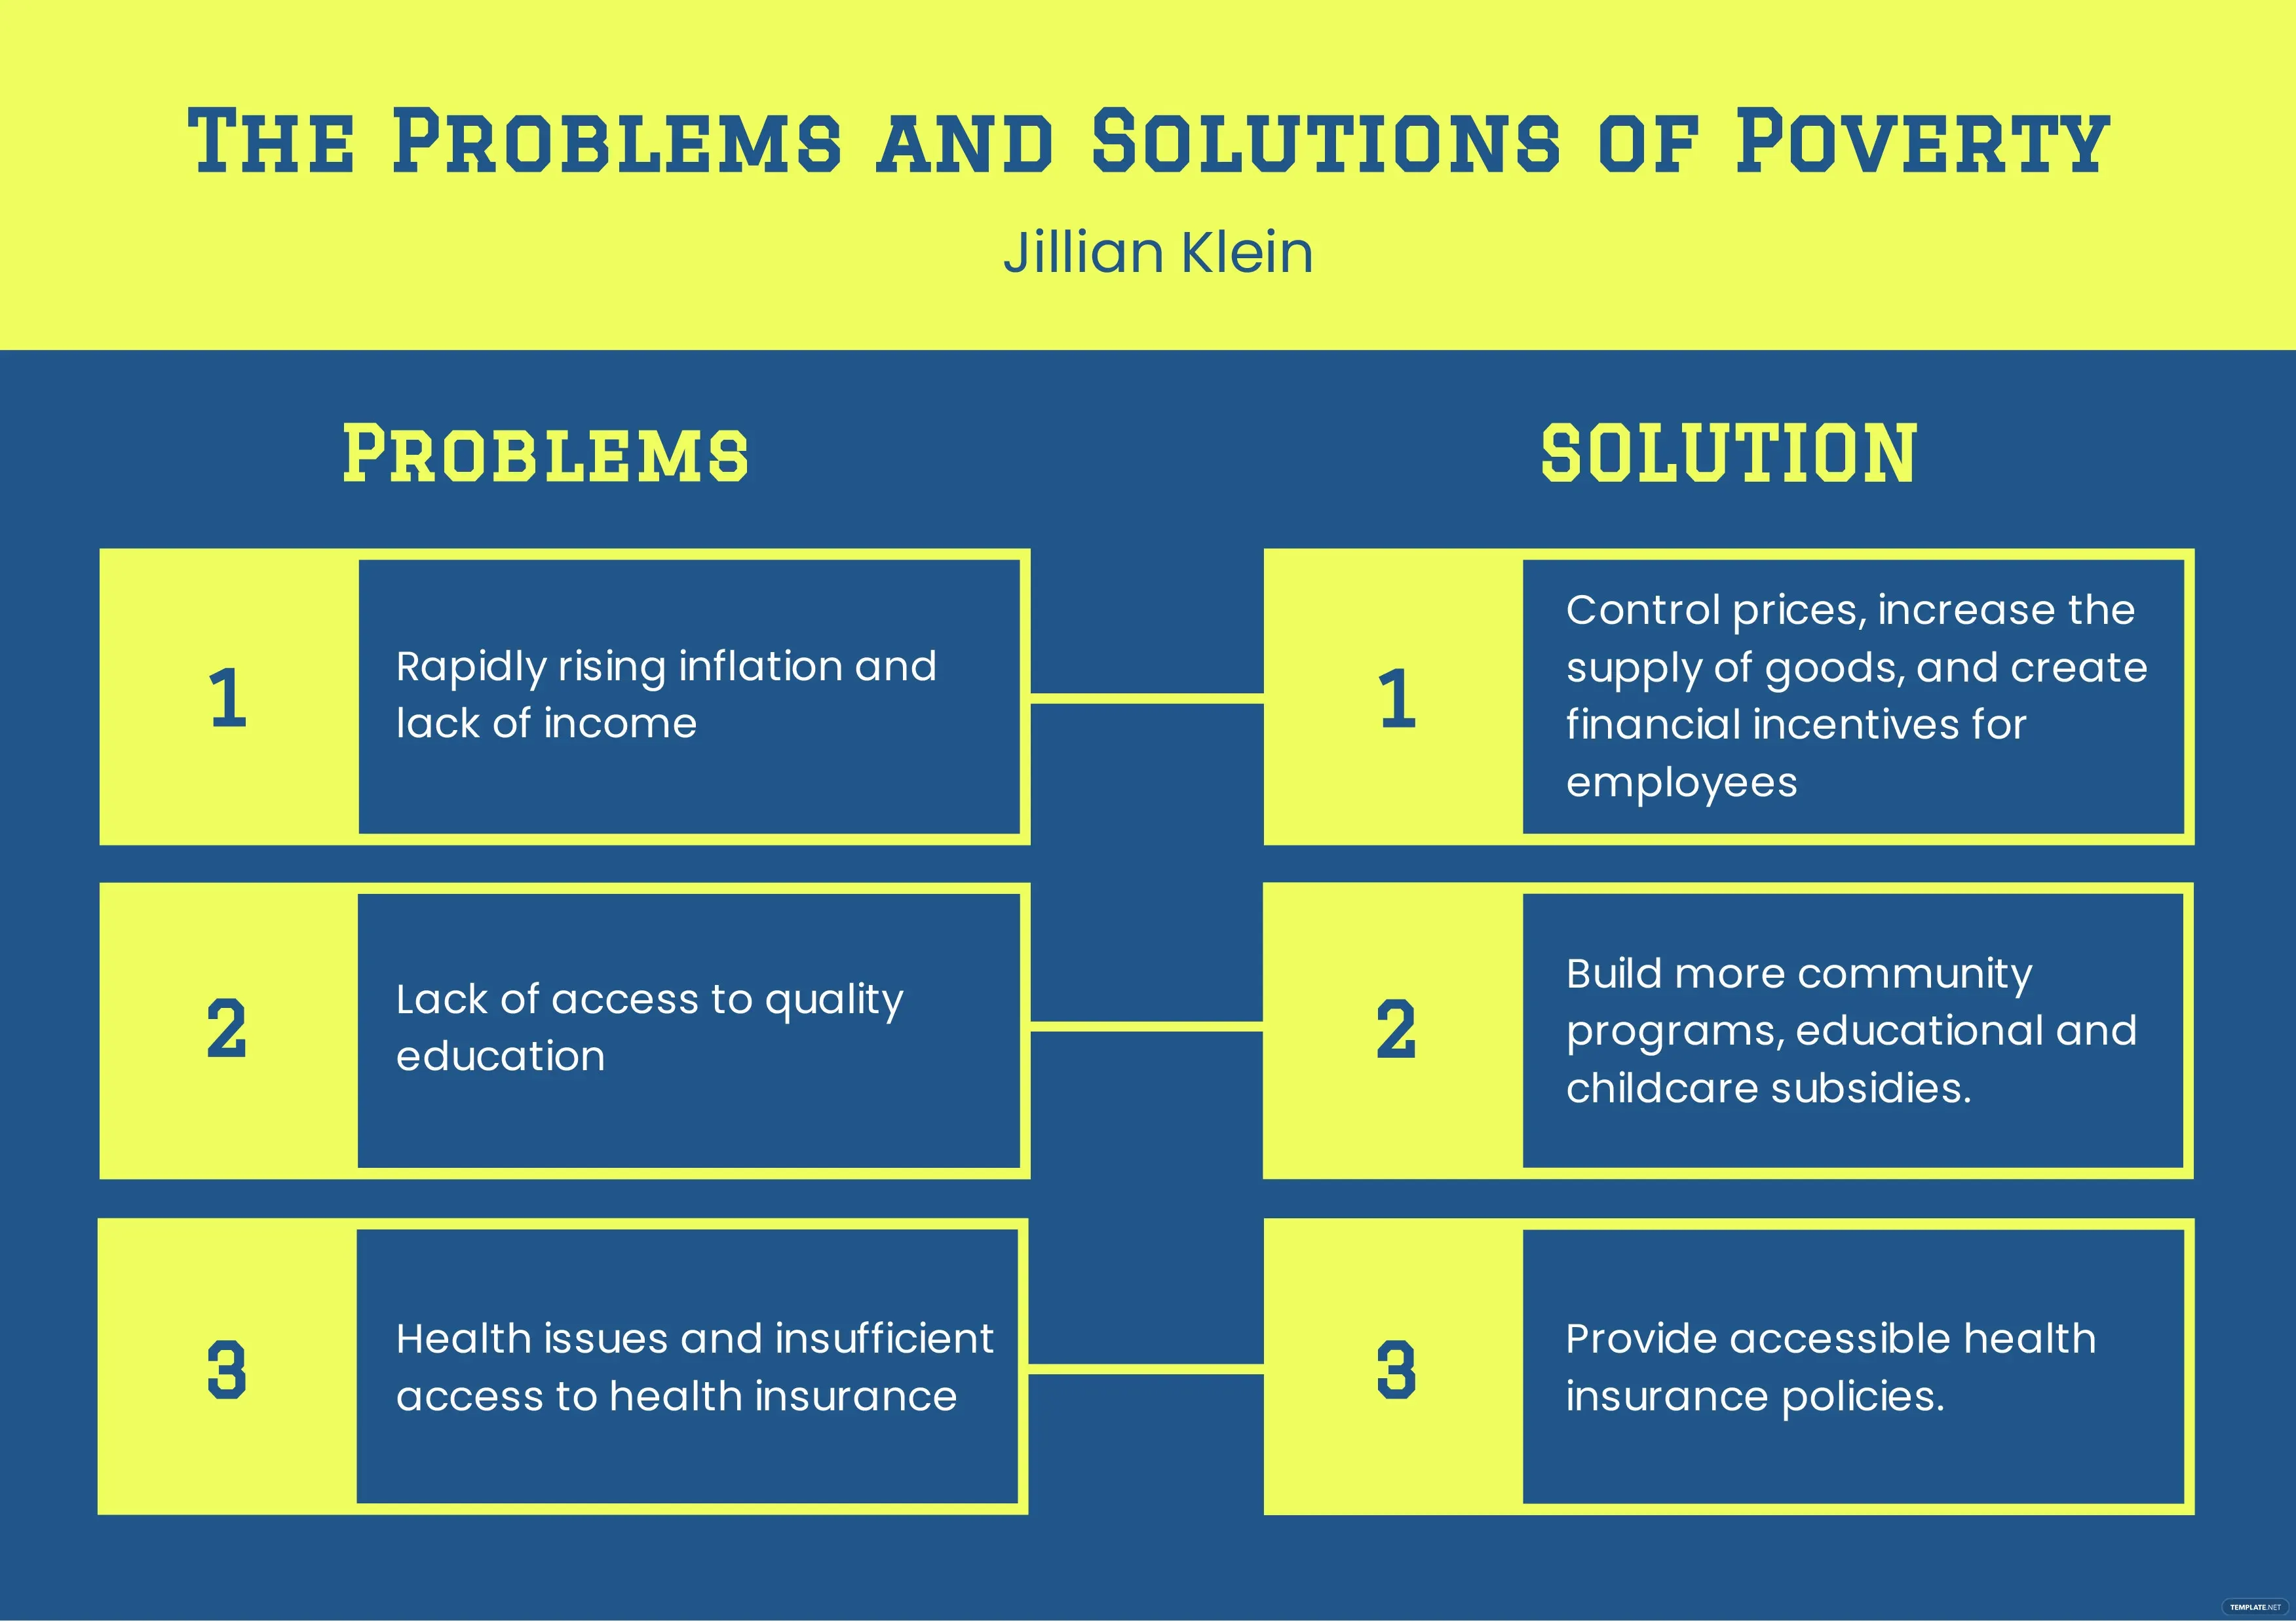
The problem and solution graphic organizer deals with various concerns that you or another person may have included in the graphic organizer. List your problems out either in bullet form or phrases and place them within a container followed by your solutions on the other side in a different container. You can either put a label, number, lines, or arrows to signify that solution is for a particular problem.
Some of the best graphic organizers are the T chart, concept map, web graphic organizer, Venn diagram, and sequence chart.
No, because while a graphic organizer can be used for note-taking and is presented in non-linear forms, an infographic is a creative conversion of collected information.
A communication graphic organizer is a tool that conveys learning, beliefs, opinions, or notions through visual symbols to make communication of the central topic easier.
Since a graphic organizer is a visual representation of the links between facts, concepts, or ideas within a learning assignment, it can have various appearances, ranging from a simple face or a creative presentation of information.
Graphic organizers show the link or connection between the title and the supplementing information that follows, in addition to that, they also show how a sequence of events, either chronologically or not, may have transpired.
Graphic organizers are at the lead of contemporary educational practices or tools and help to guide optimal studying and learning processes.
Before writing your essay, use an essay visual organizer to help you arrange your thoughts and sources as it acts as an outline
Timeline graphic organizers are a type of visual organizer that portrays events in chronological order, it can either be presented in a landscape or portrait-oriented format.
Graphic organizers assist students to organize their thoughts and ideas for answering questions, serving as a pre-writing tool for articles, and presenting information visually.
It is a graphical depiction of a problem-solving process, wherein the diagram sets out the core problem, suggests procedures, and eventually arrives at a solution.
Though they appear to be simple, graphic organizers are useful tools that may be used to change and improve the teaching-learning activities in the classroom which can reflect on the atmosphere within the four walls of the learning environment.
A flow diagram or sequence chart depicts a succession of processes or events in the order that they occur.

To formally invite someone or a group of people to an event or activity, you will need to send out…
![How To Create an ID Card in Google Docs [Template + Example]](https://images.template.net/wp-content/uploads/2023/07/How-To-Create-an-ID-Card-in-Google-Docs-Template-Example-788x443.png)
ID cards are used as a way to represent an individual to the company or organization they work or volunteer…
![How to Make an ID Card in Microsoft Word [Template + Example]](https://images.template.net/wp-content/uploads/2023/07/How-to-Make-an-ID-Card-in-Microsoft-Word-Template-Example-788x443.png)
ID cards are an essential part of any employee working for a company or an organization to be recognized as…
![How To Make/Create a Book Cover in Google Docs [Templates + Examples]](https://images.template.net/wp-content/uploads/2023/07/How-To-Create-a-Book-Cover-in-Google-Docs-788x443.png)
Aside from protecting a book, book covers are specifically designed to attract readers and convey the essence of the book.…
![How To Make/Create a Book Cover in Microsoft Word [Templates + Examples]](https://images.template.net/wp-content/uploads/2023/07/How-To-Create-a-Book-Cover-in-Microsoft-Word-788x443.png)
A book cover is the outer layer of a book that is used to protect its contents. Book covers are…
Job vacancy is a common scenario in companies and organizations. Employees leave for all kinds of reasons and when they…
Save the date sizes are usually the same size as a formal invitation. But there are a number of different…
Script is a popular word that is frequently used in the entertainment world. There are a variety of areas and usages…
Presentations may not look as pleasant as how you design them with pictures, animations, videos, and other graphic designs without…