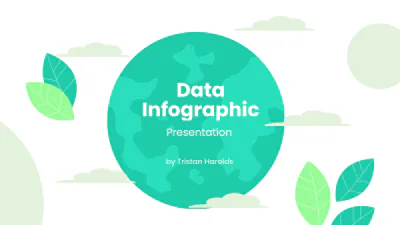
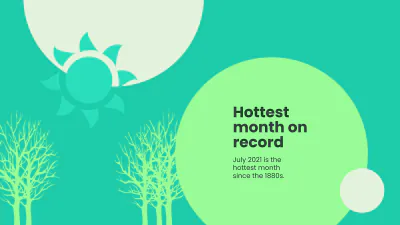
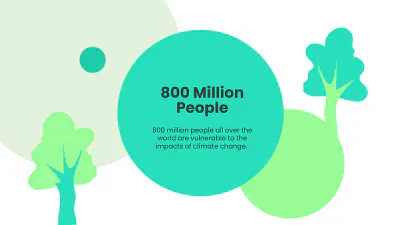
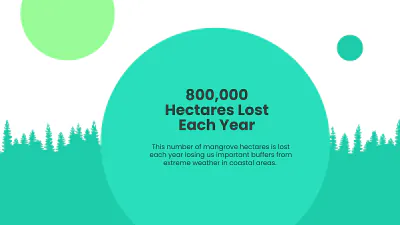
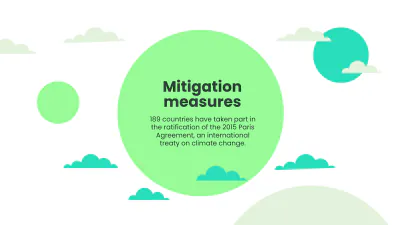
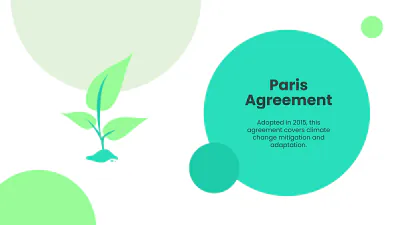
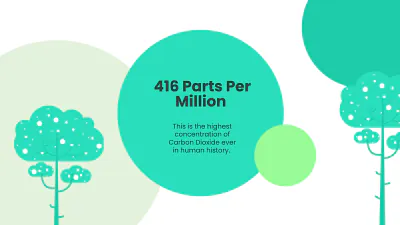

A fresh 16:9 presentation for sharing climate change data and statistics, professionally designed by Template.net, with a green globe, large circles for key figures, and trees and leaves in turquoise green, light mint and white.
A fresh 16:9 presentation for sharing climate change data and statistics, professionally designed by Template.net, with a green globe, large circles for key figures, and trees and leaves in turquoise green, light mint and white.