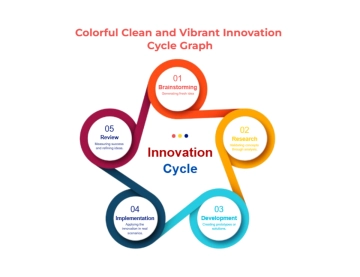
A professional cycle diagram for explaining the stages of data analytics, professionally designed by Template.net, with four colored circles, curved red arrows and a central title in soft green, pale yellow and orange.
A professional cycle diagram for explaining the stages of data analytics, professionally designed by Template.net, with four colored circles, curved red arrows and a central title in soft green, pale yellow and orange.