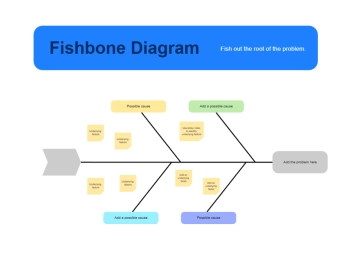
A minimal fishbone diagram for mapping causes and effects in business analysis, professionally designed by Template.net, with a central arrow, four labeled category boxes and a task box in cream, soft peach and warm brown.
A minimal fishbone diagram for mapping causes and effects in business analysis, professionally designed by Template.net, with a central arrow, four labeled category boxes and a task box in cream, soft peach and warm brown.