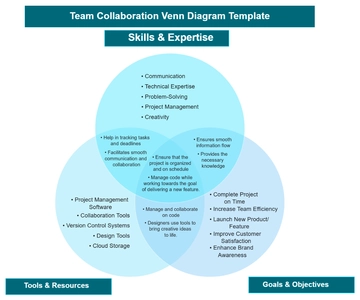
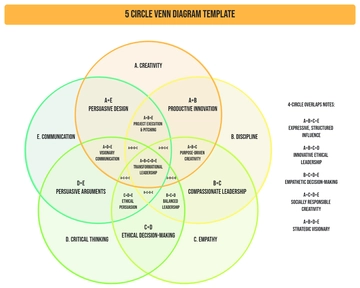
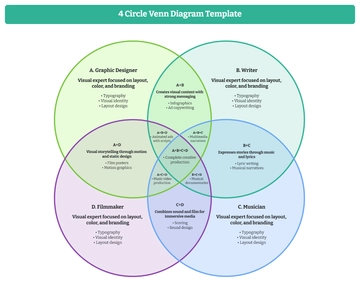
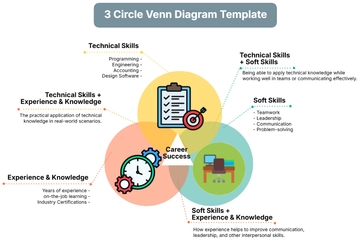
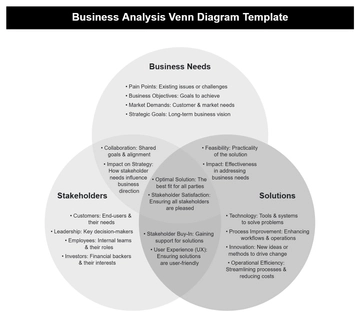
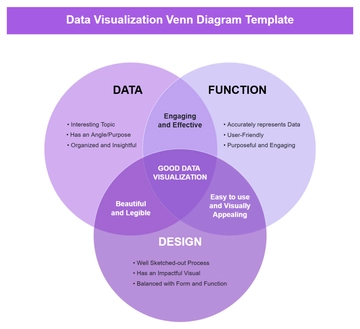
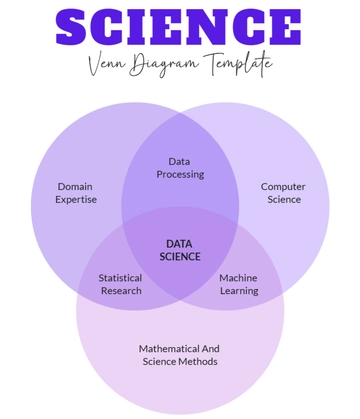
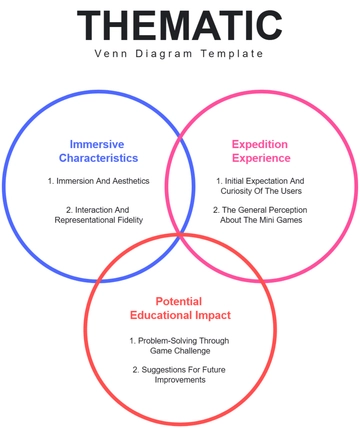
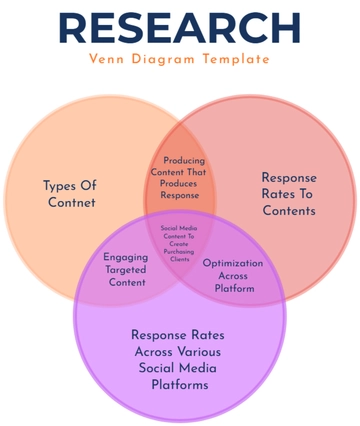
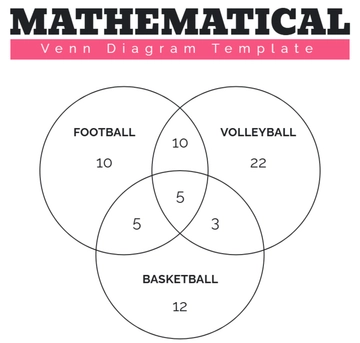
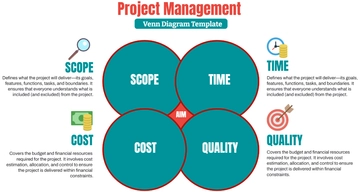
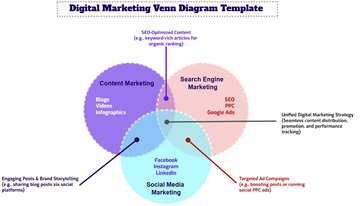
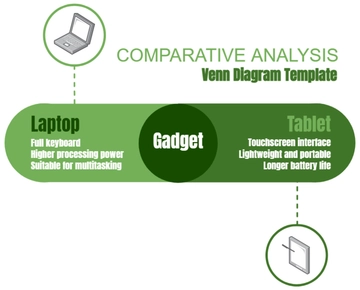
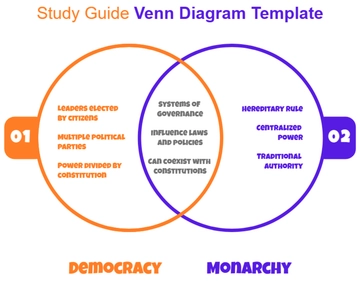
A professional Venn diagram for explaining data visualization, professionally designed by Template.net, with three overlapping circles, bulleted lists and a purple title banner in rich purple, soft lavender and violet.
A professional Venn diagram for explaining data visualization, professionally designed by Template.net, with three overlapping circles, bulleted lists and a purple title banner in rich purple, soft lavender and violet.