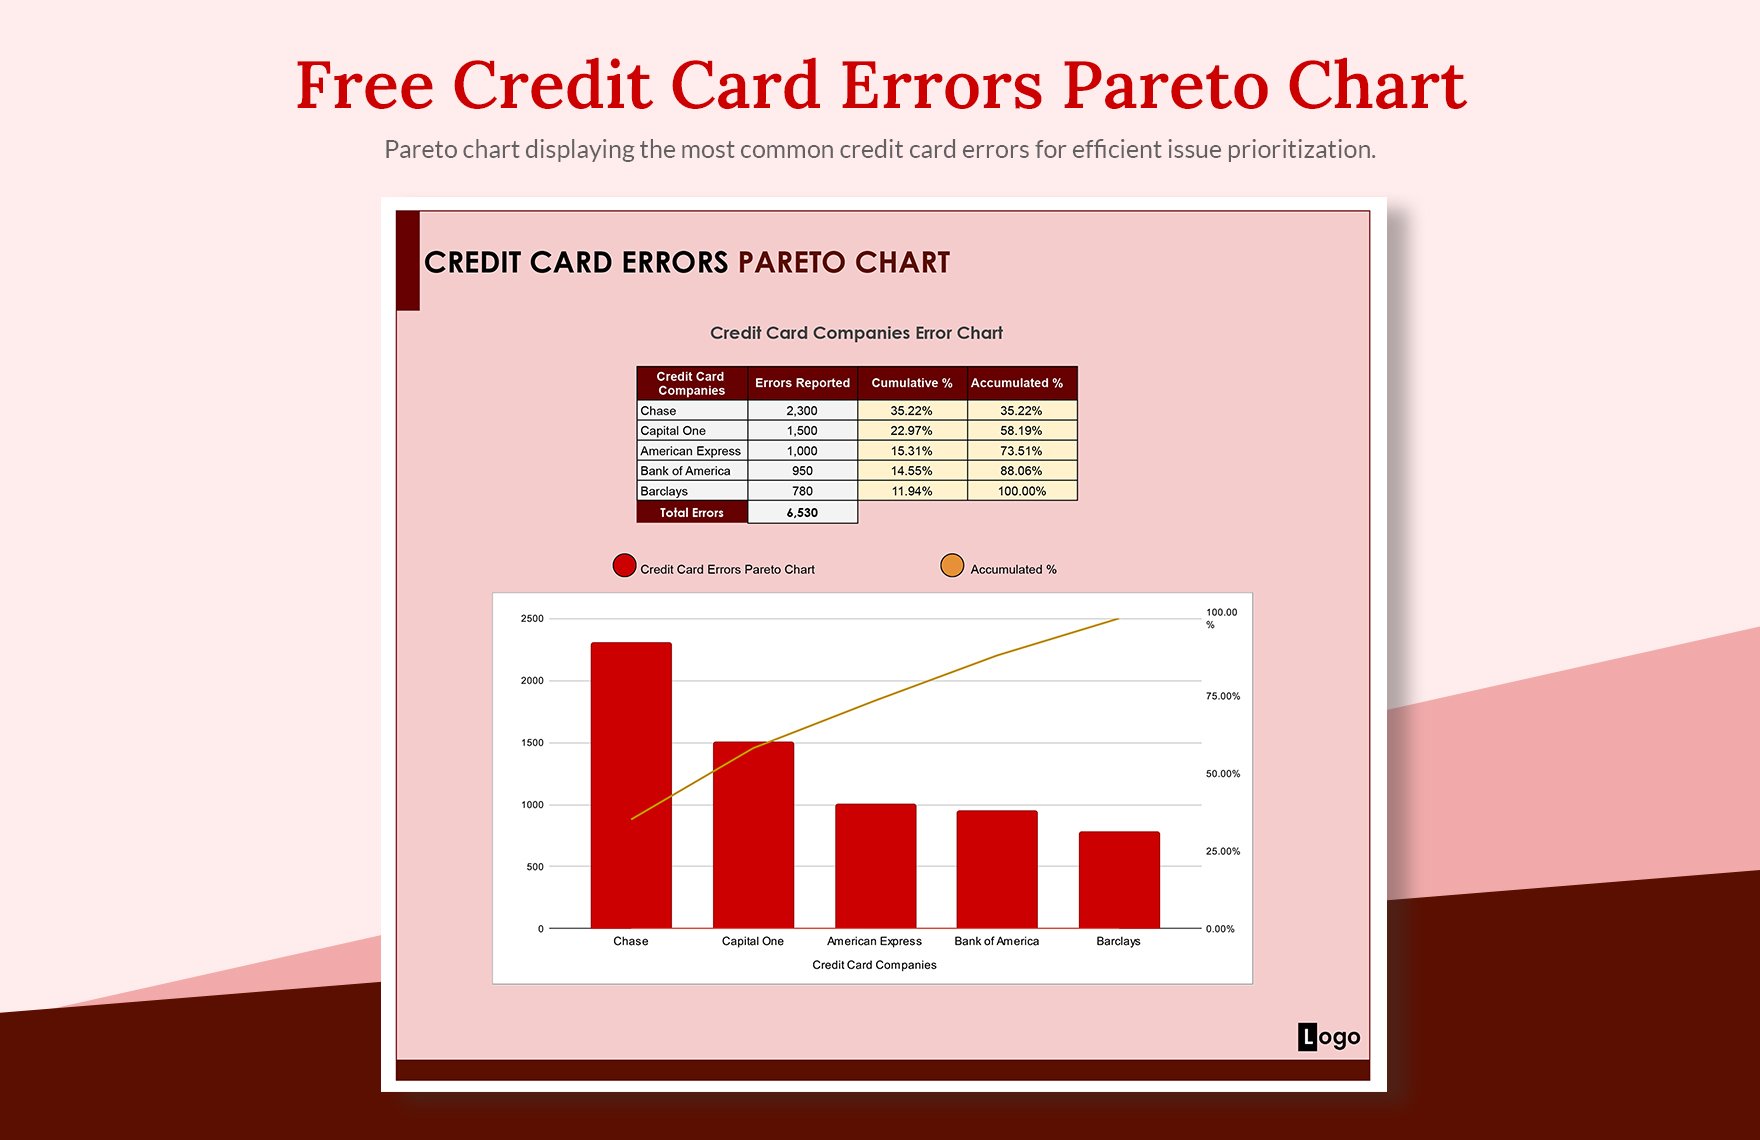
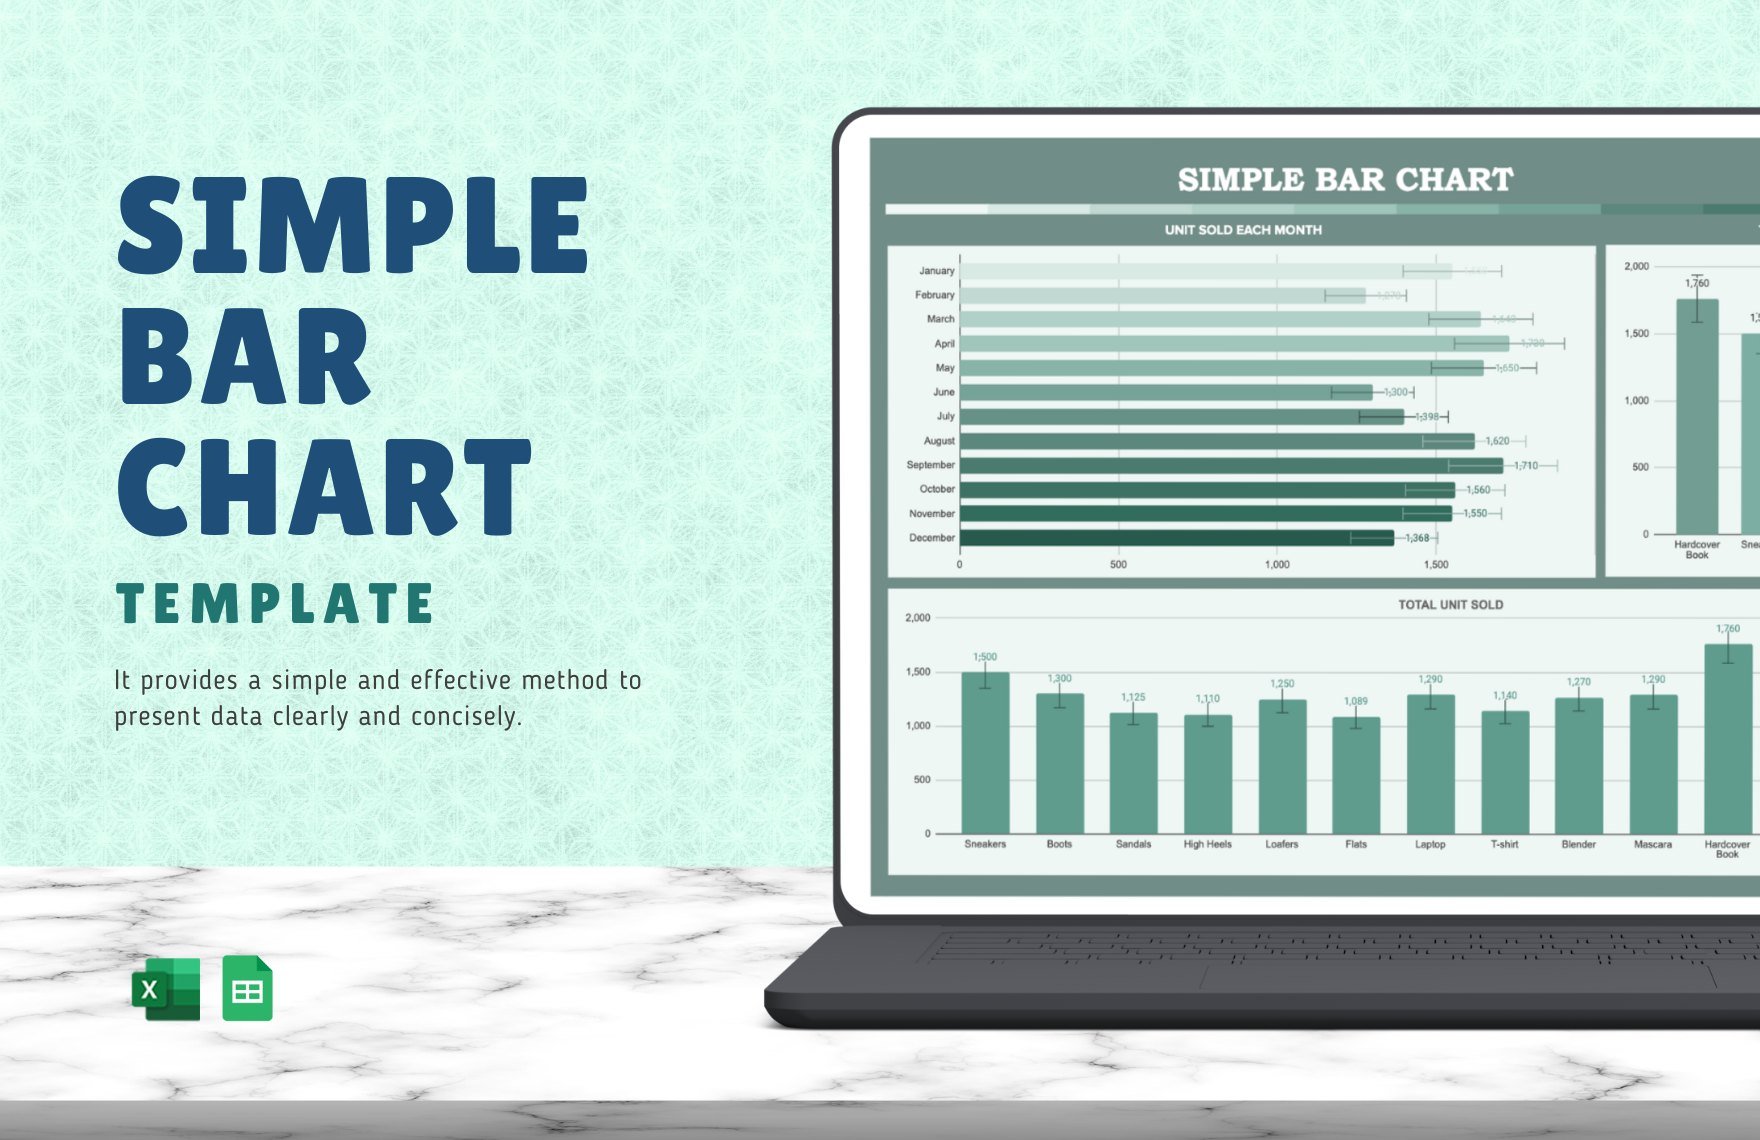
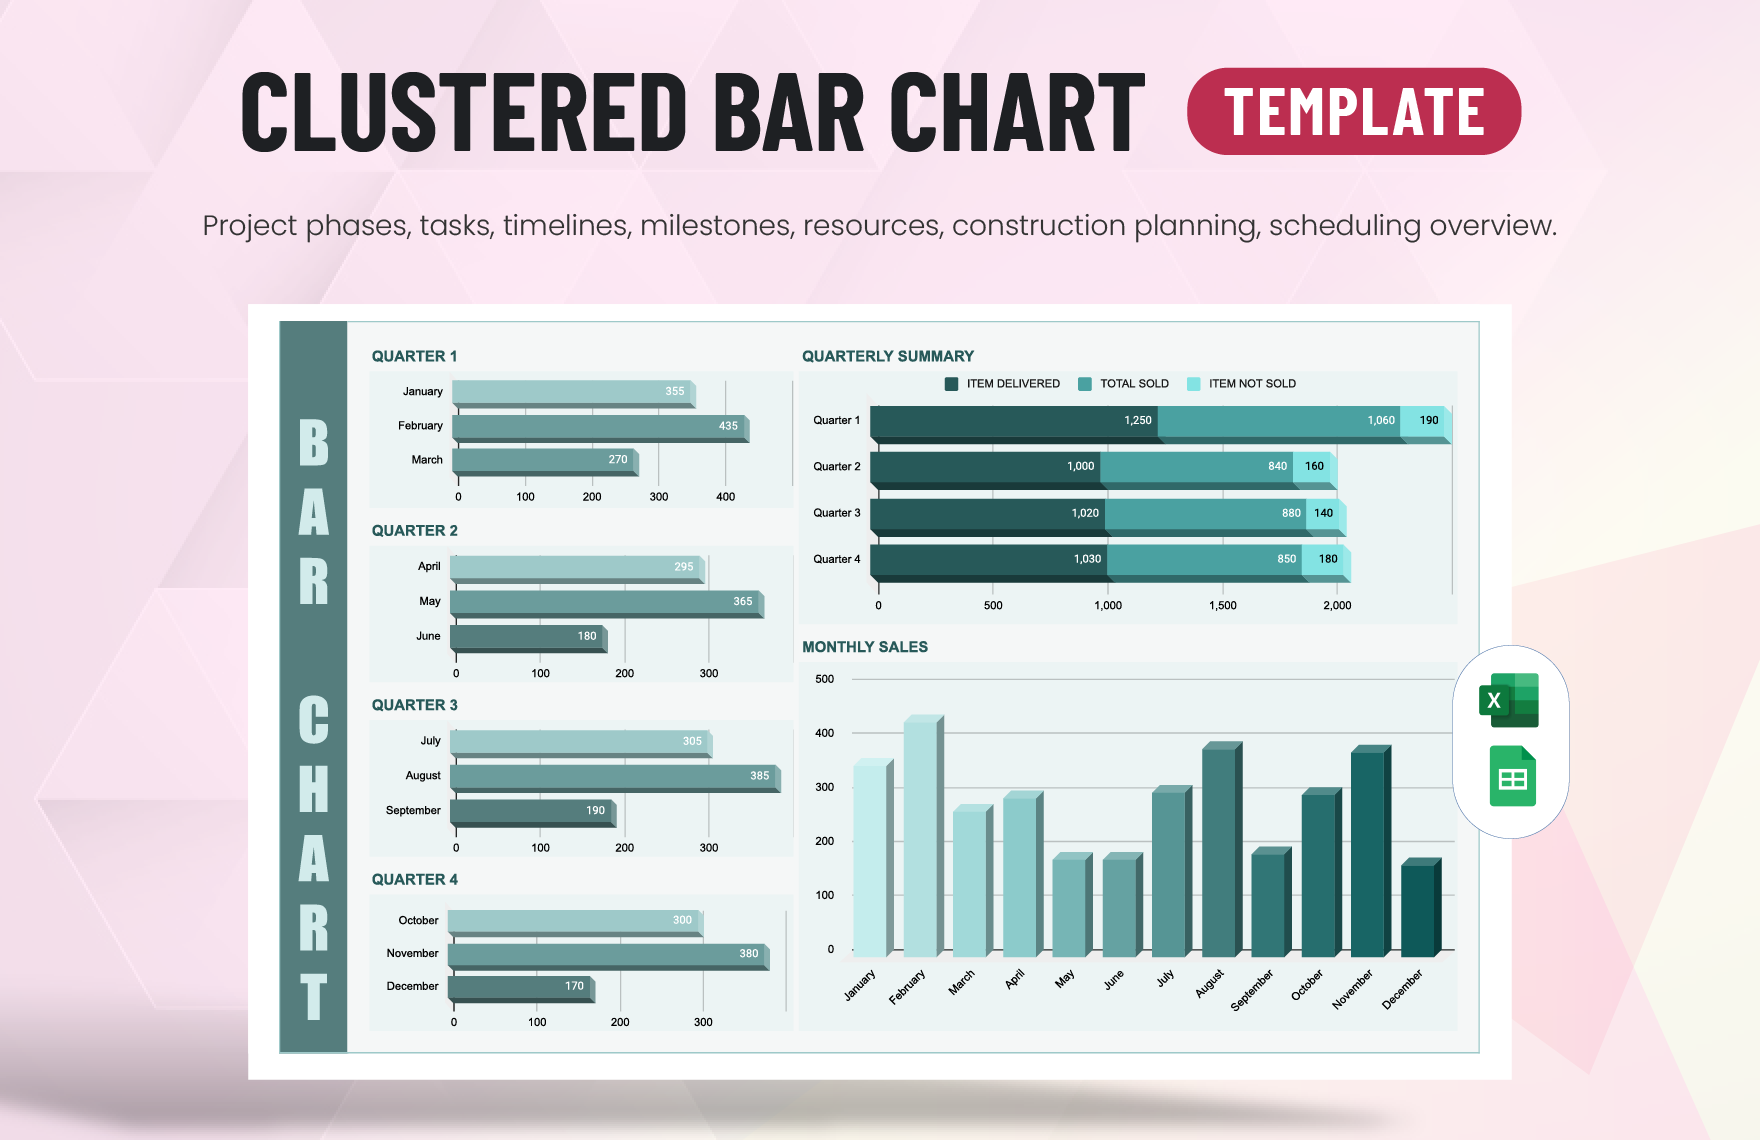
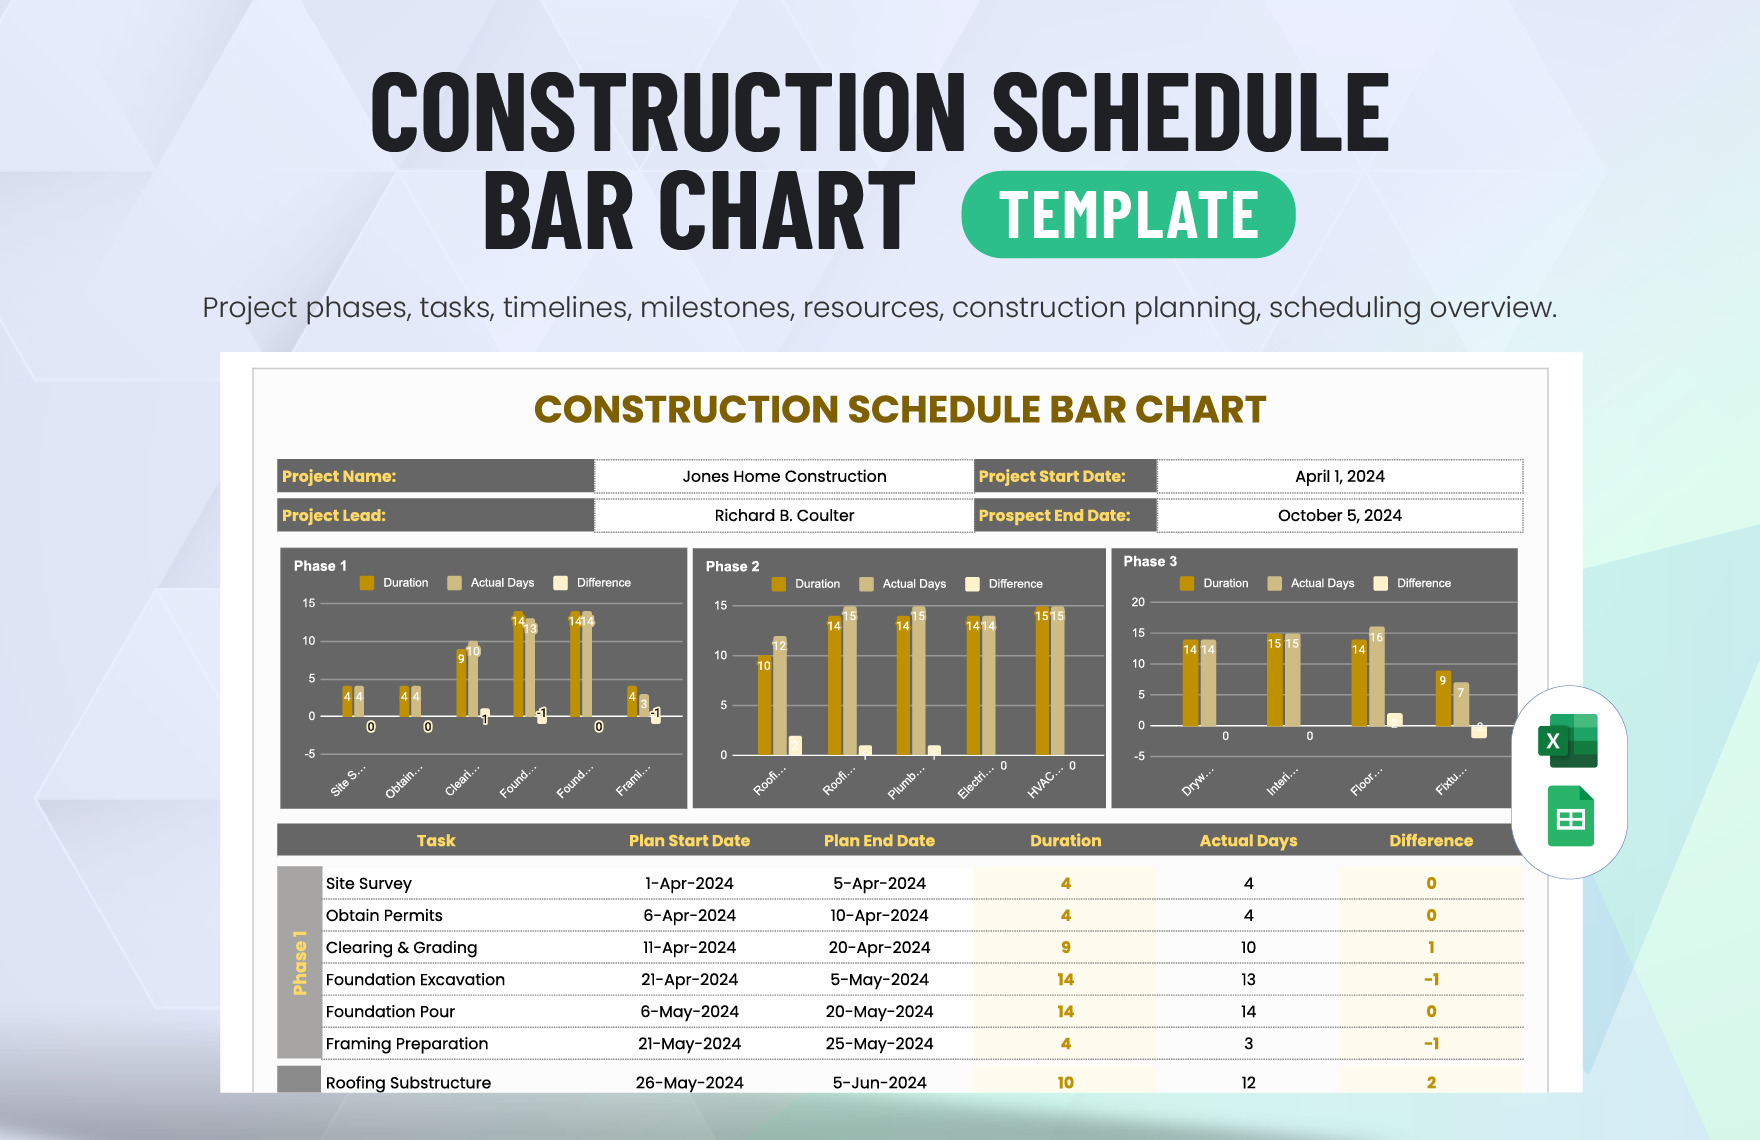
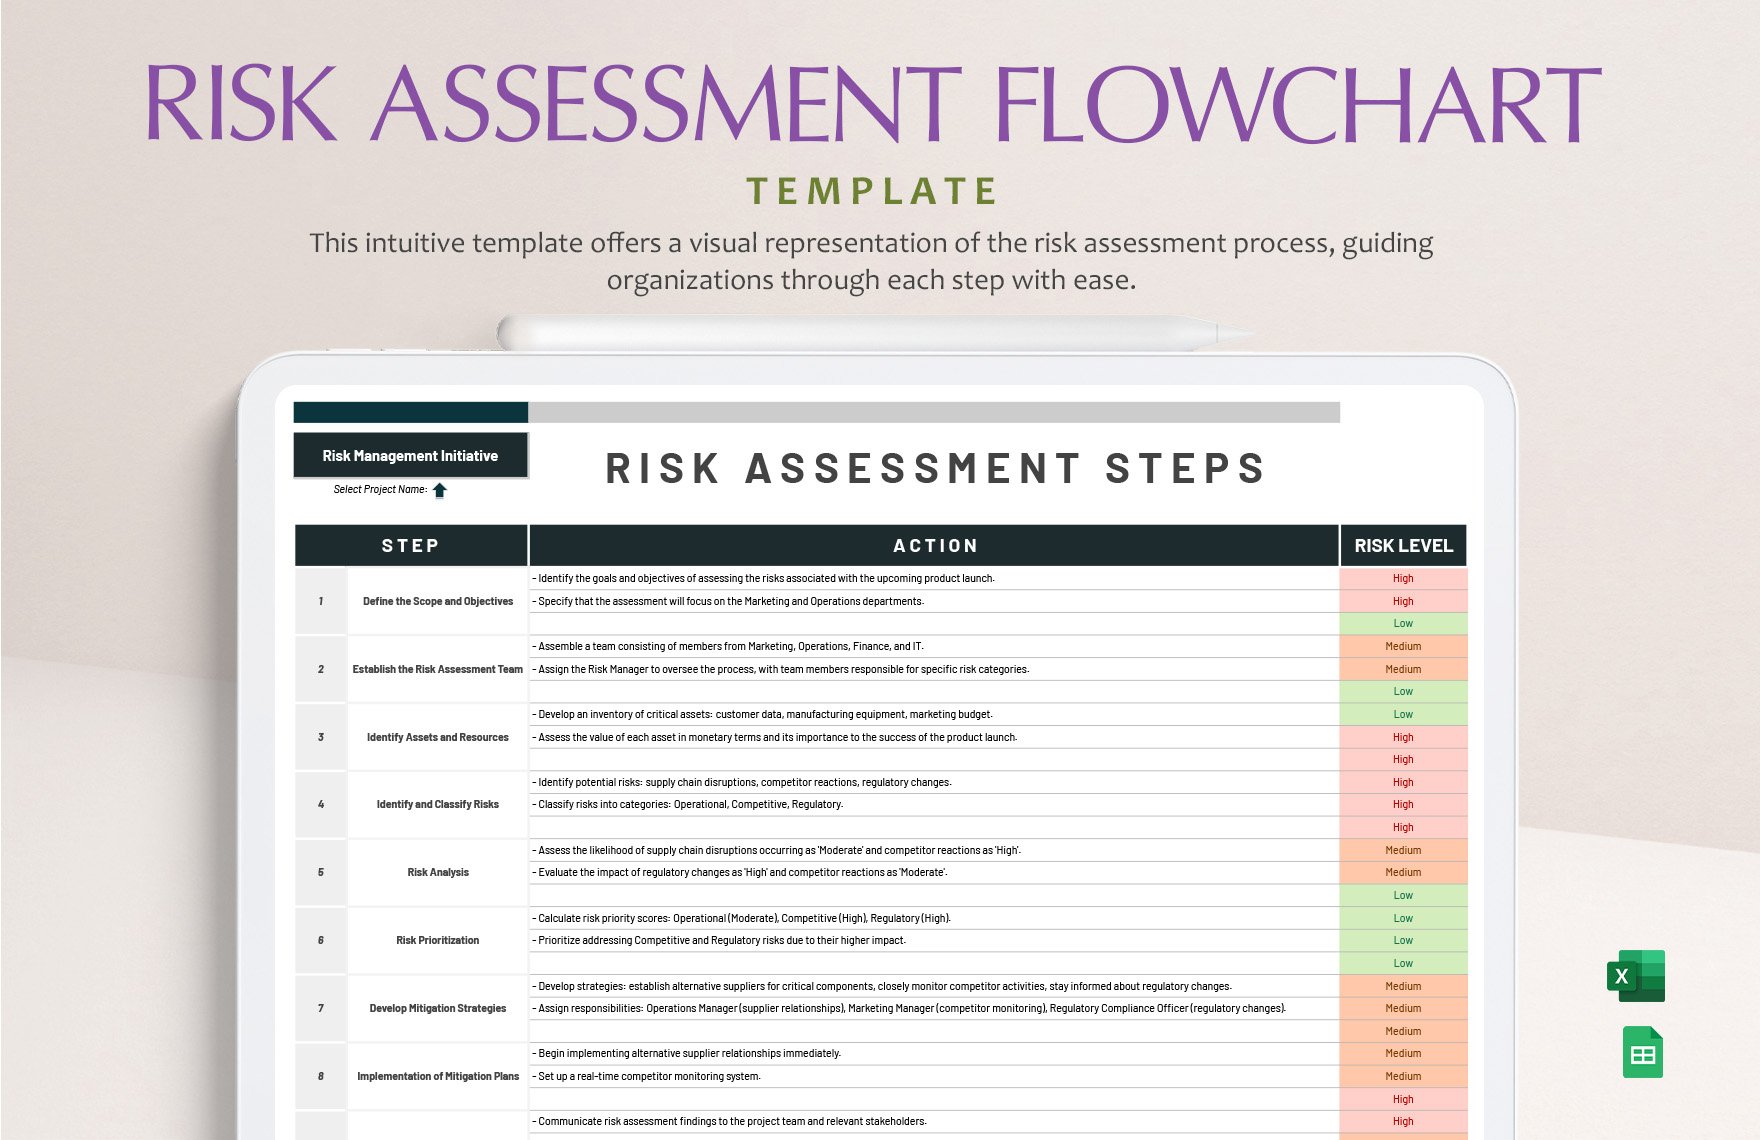
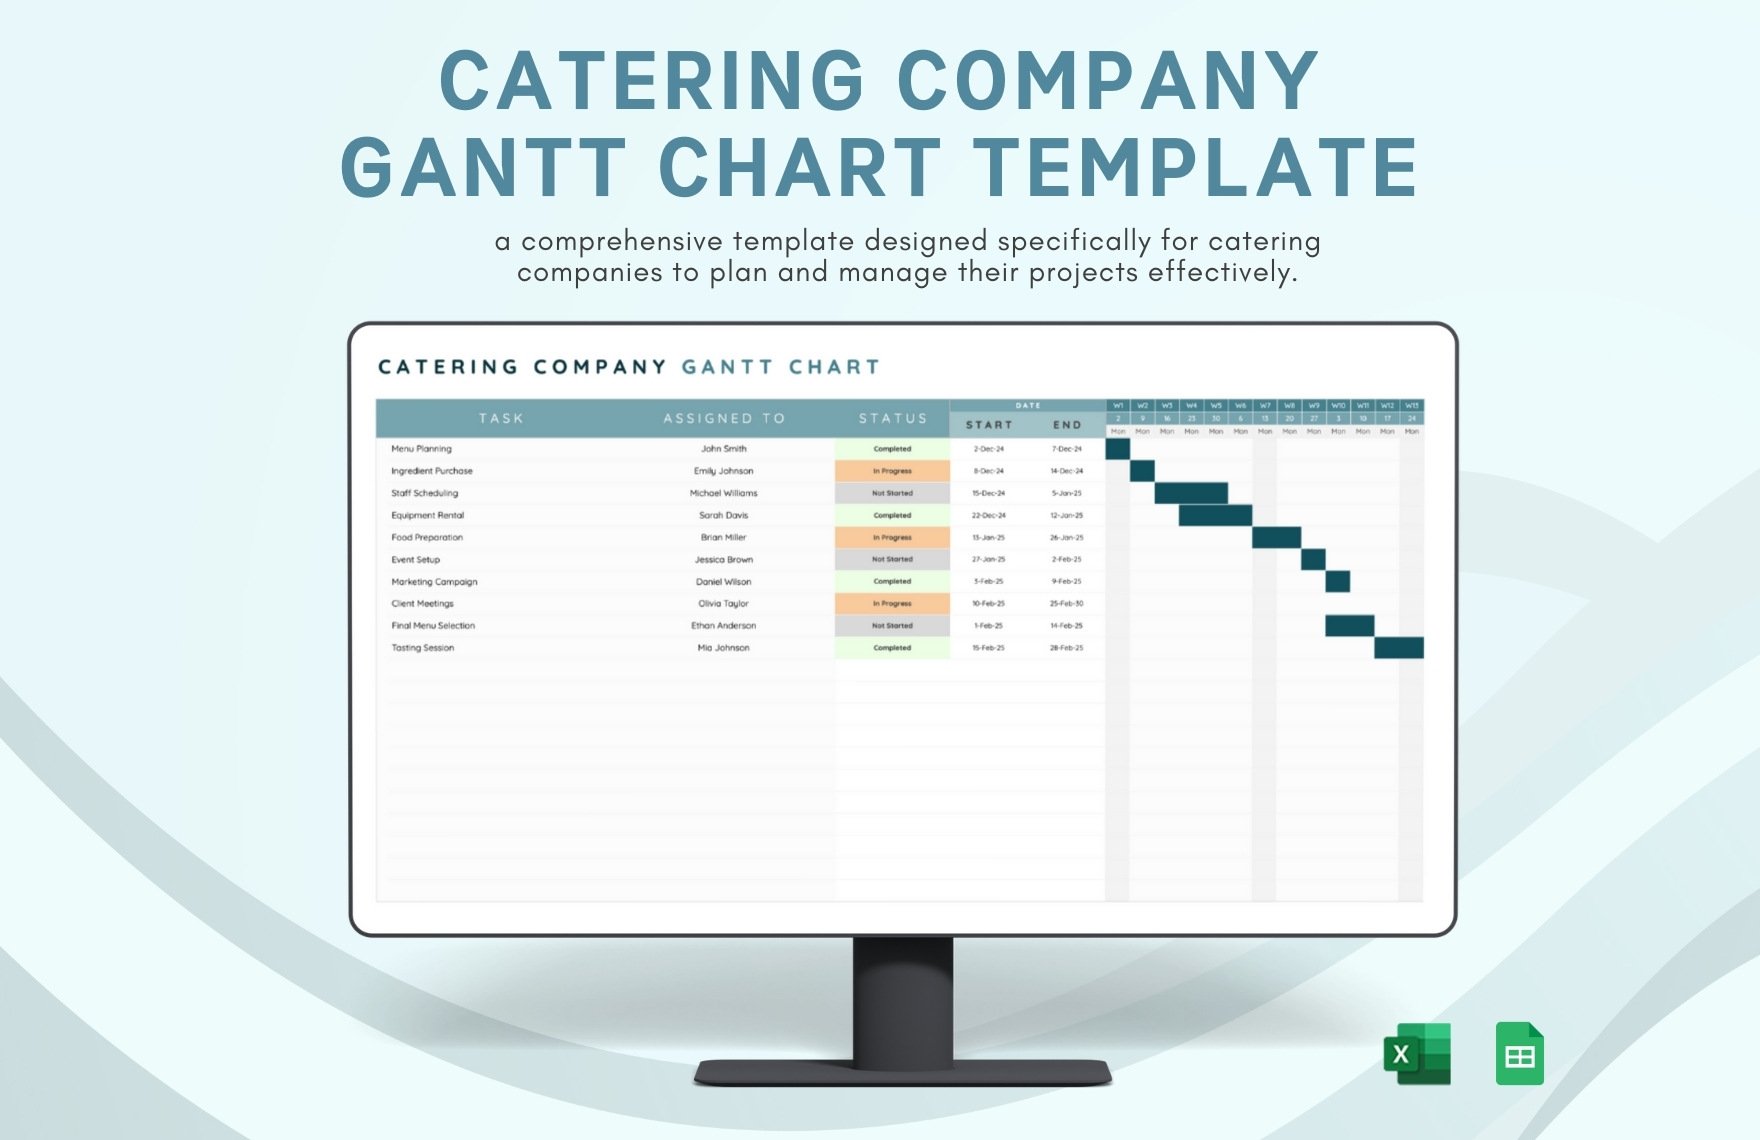
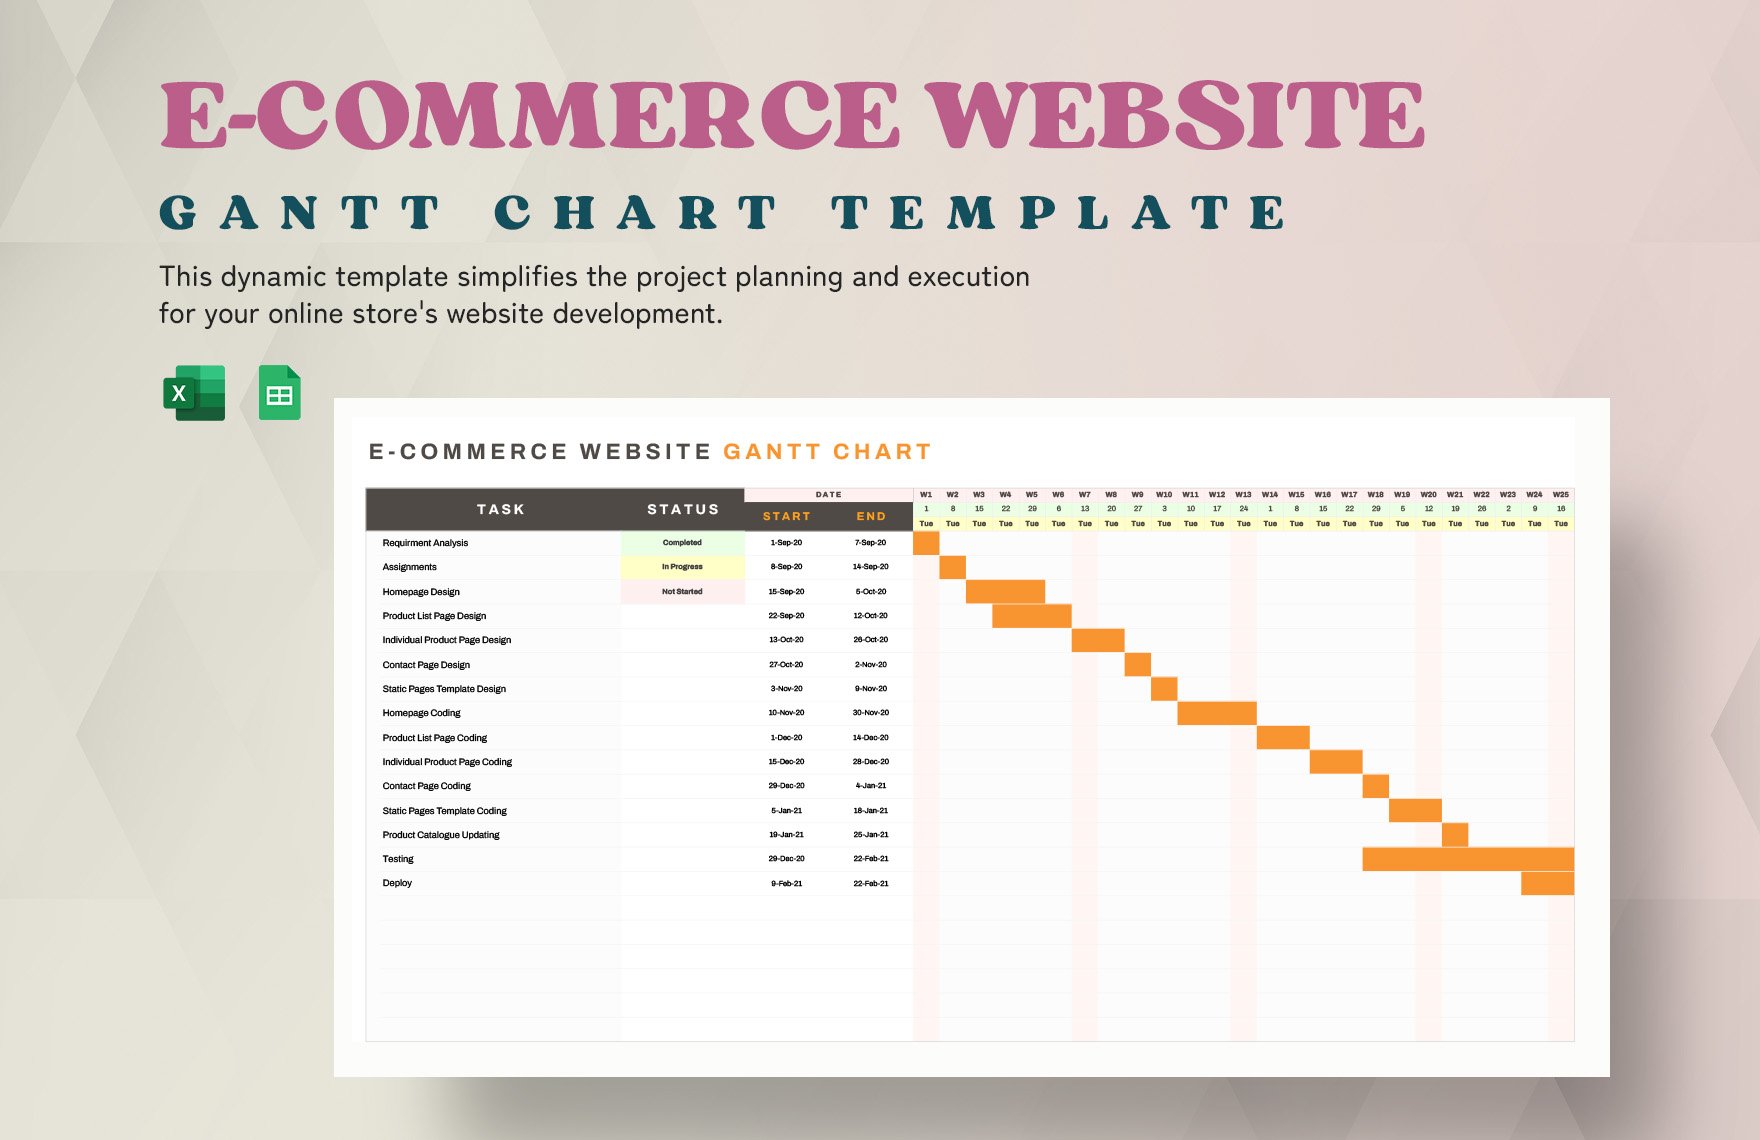
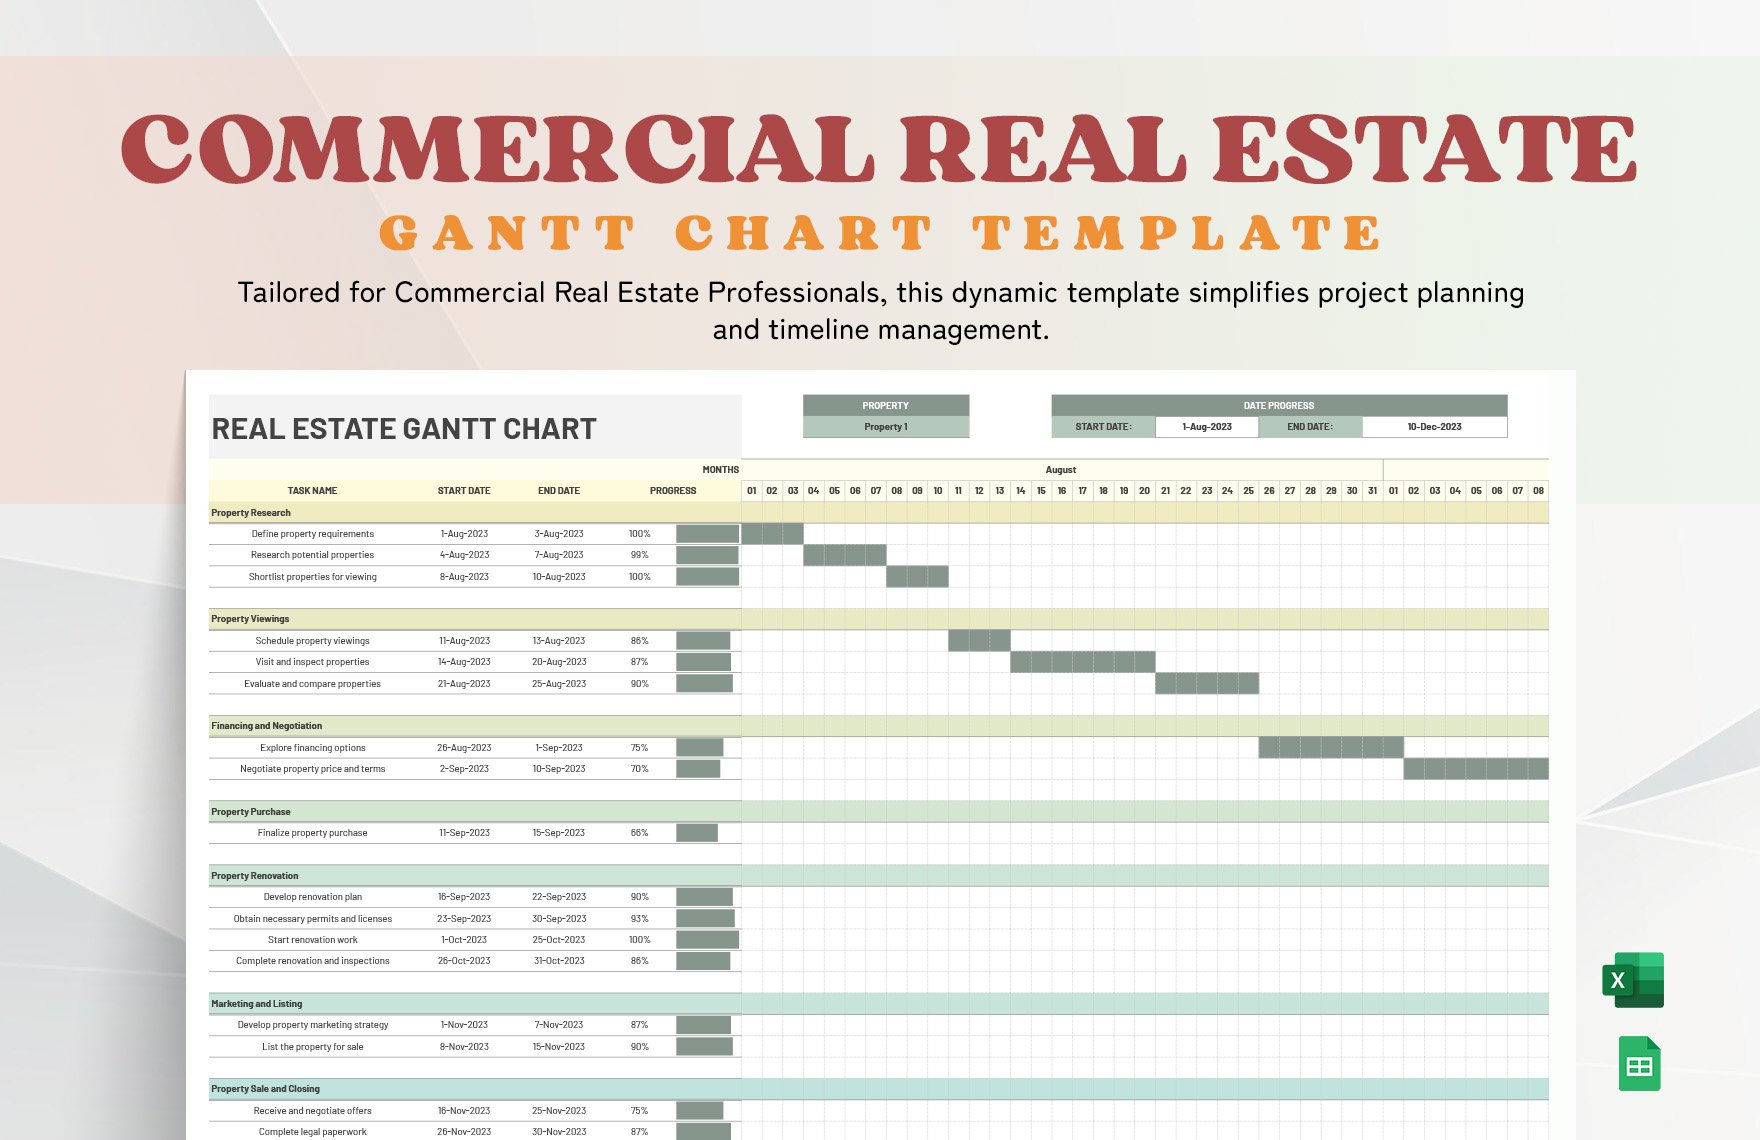
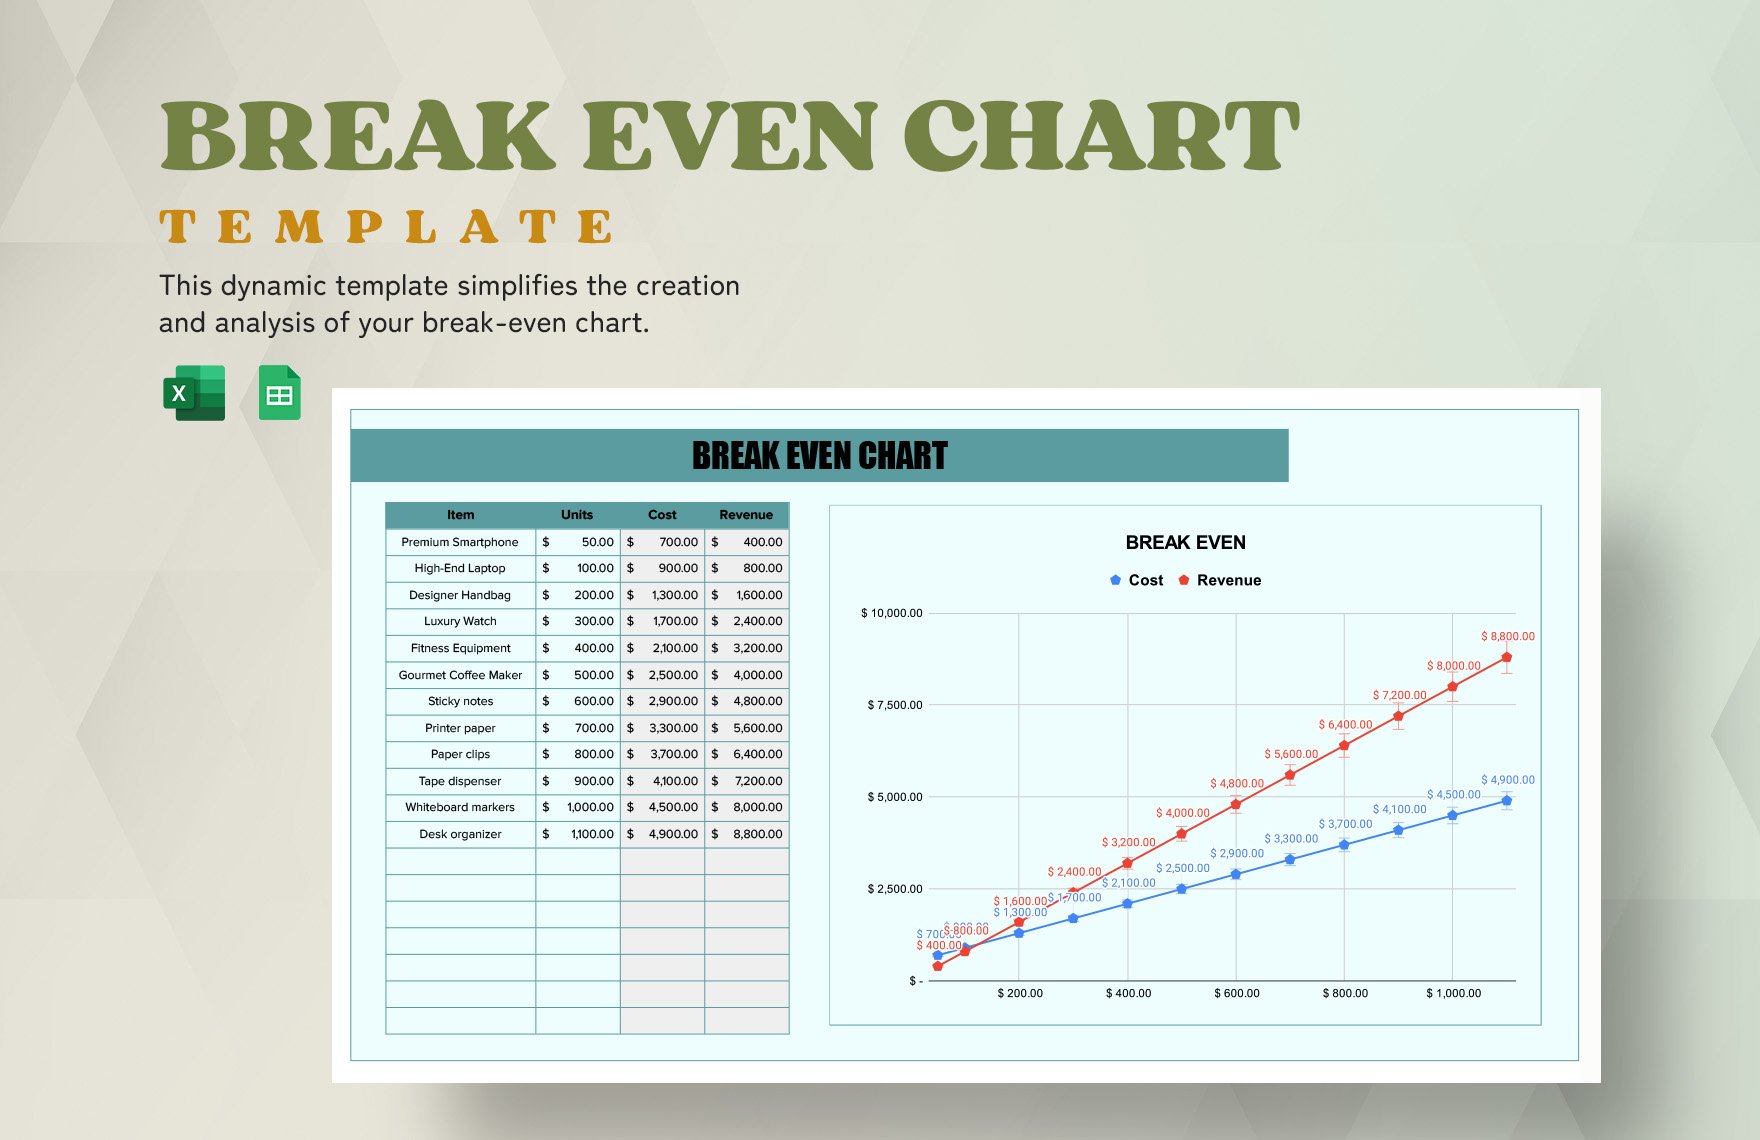
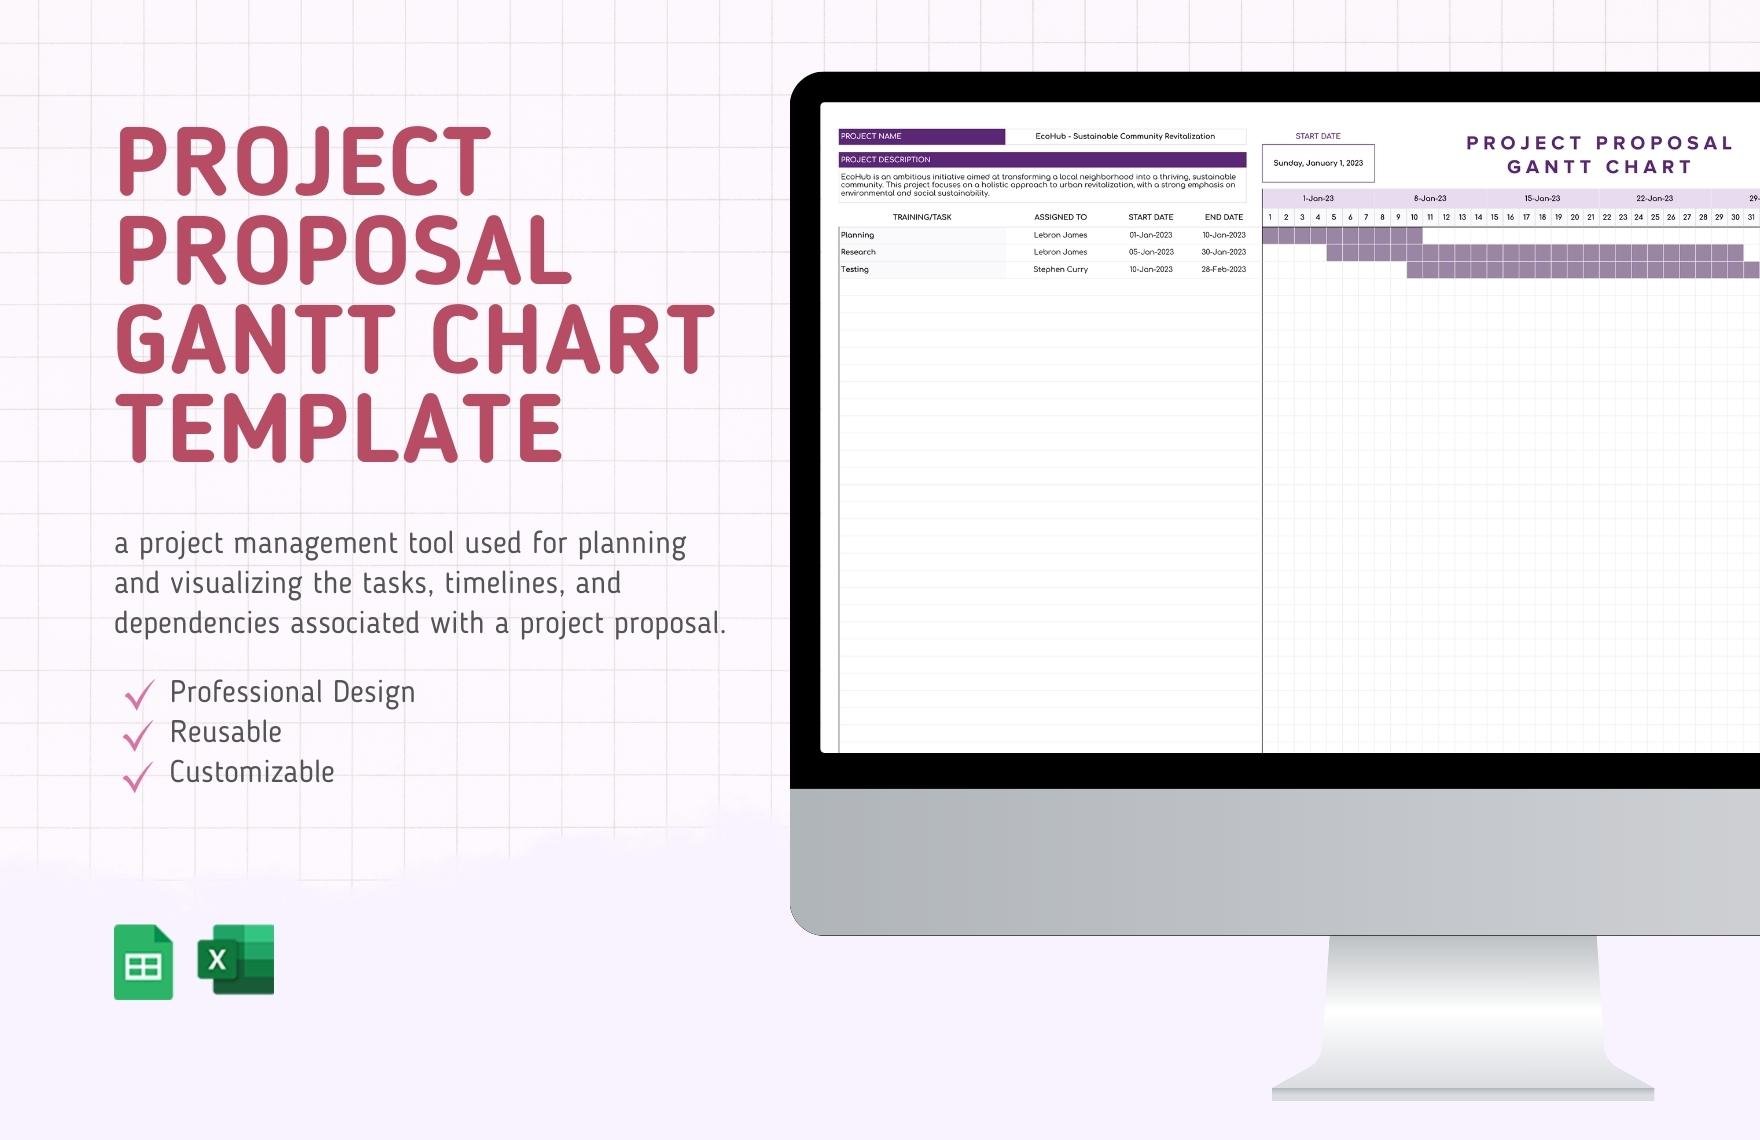
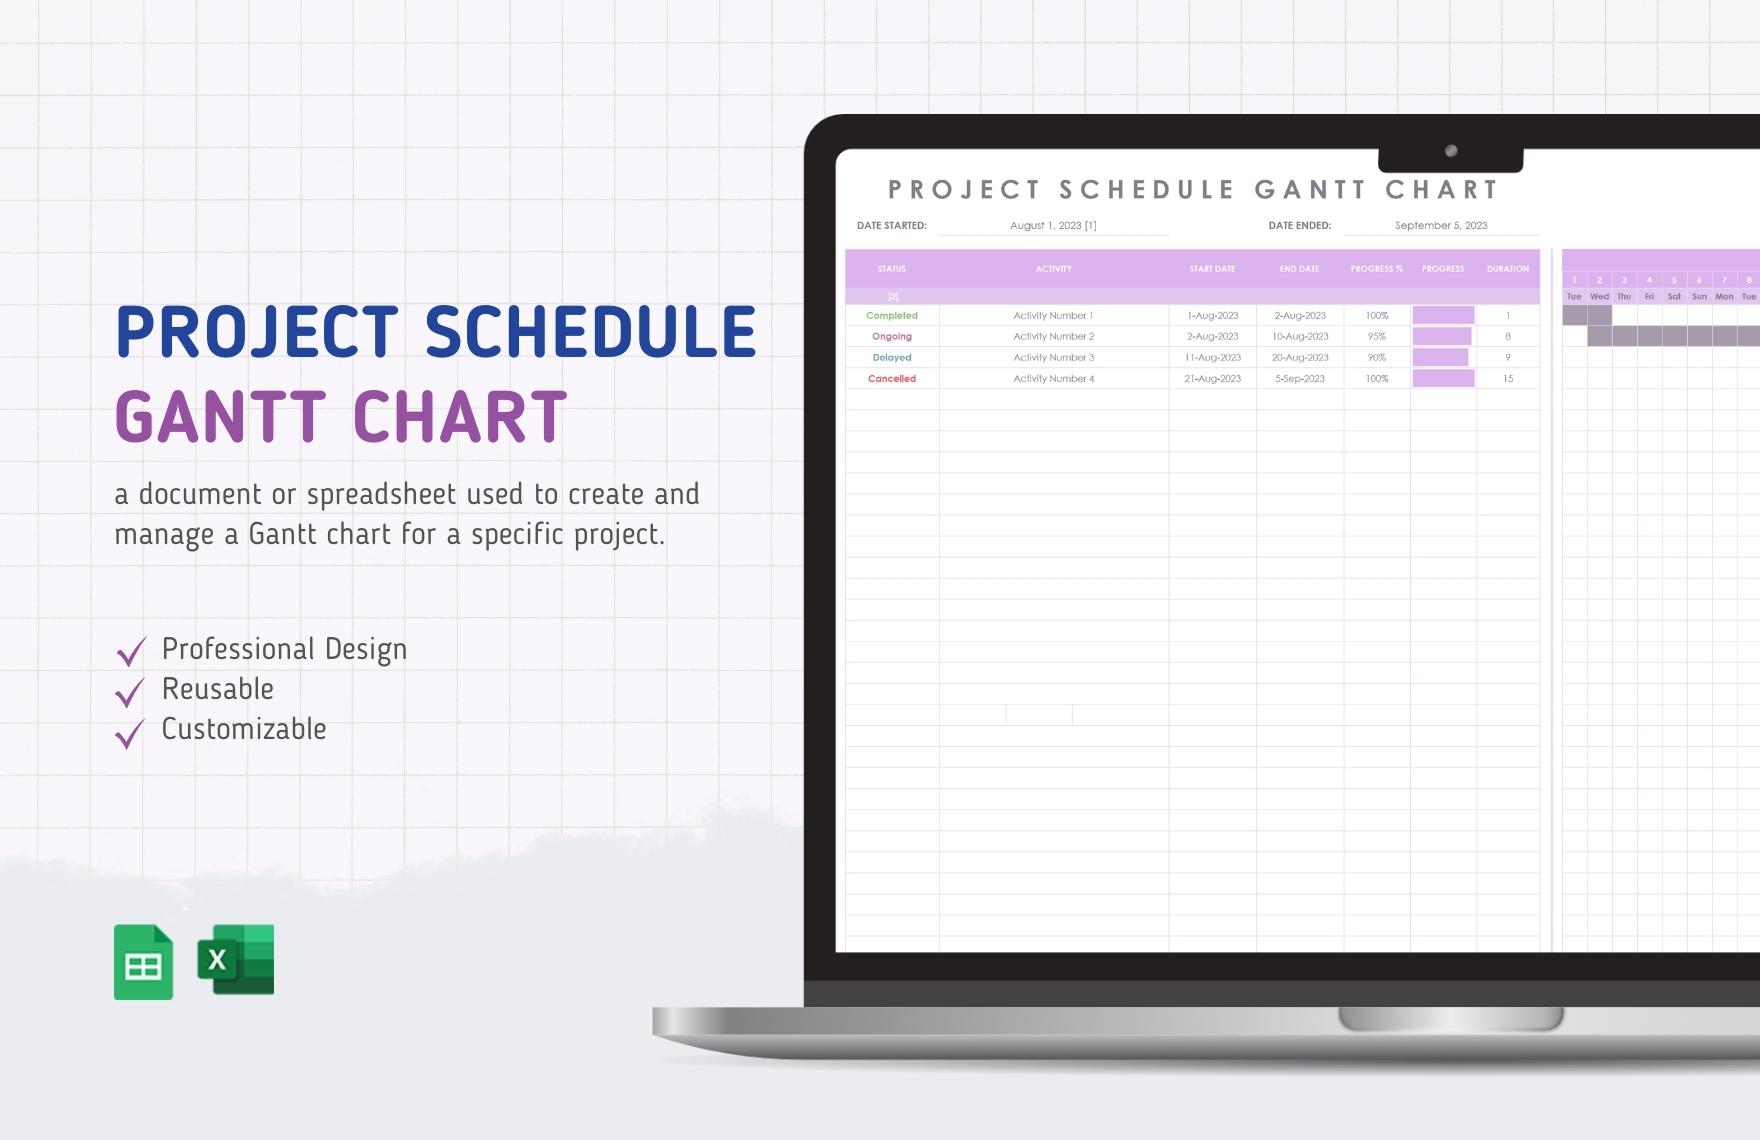
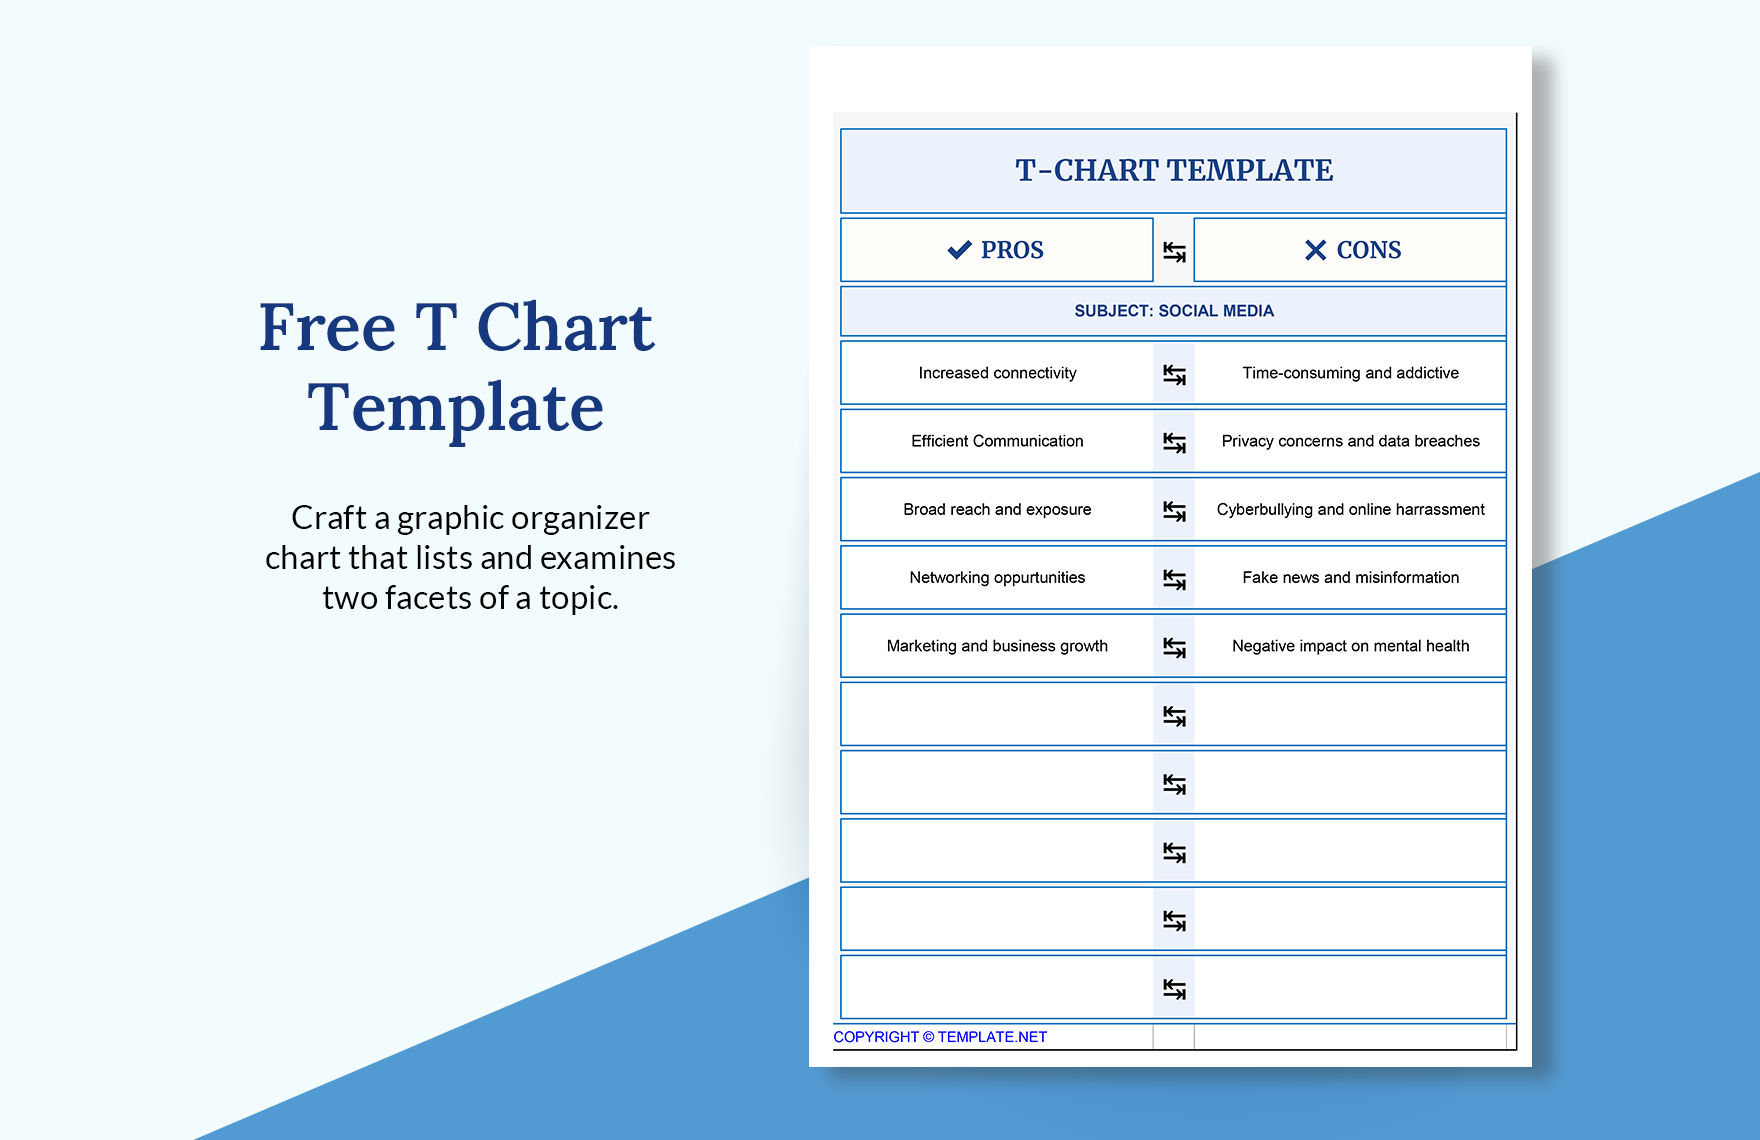
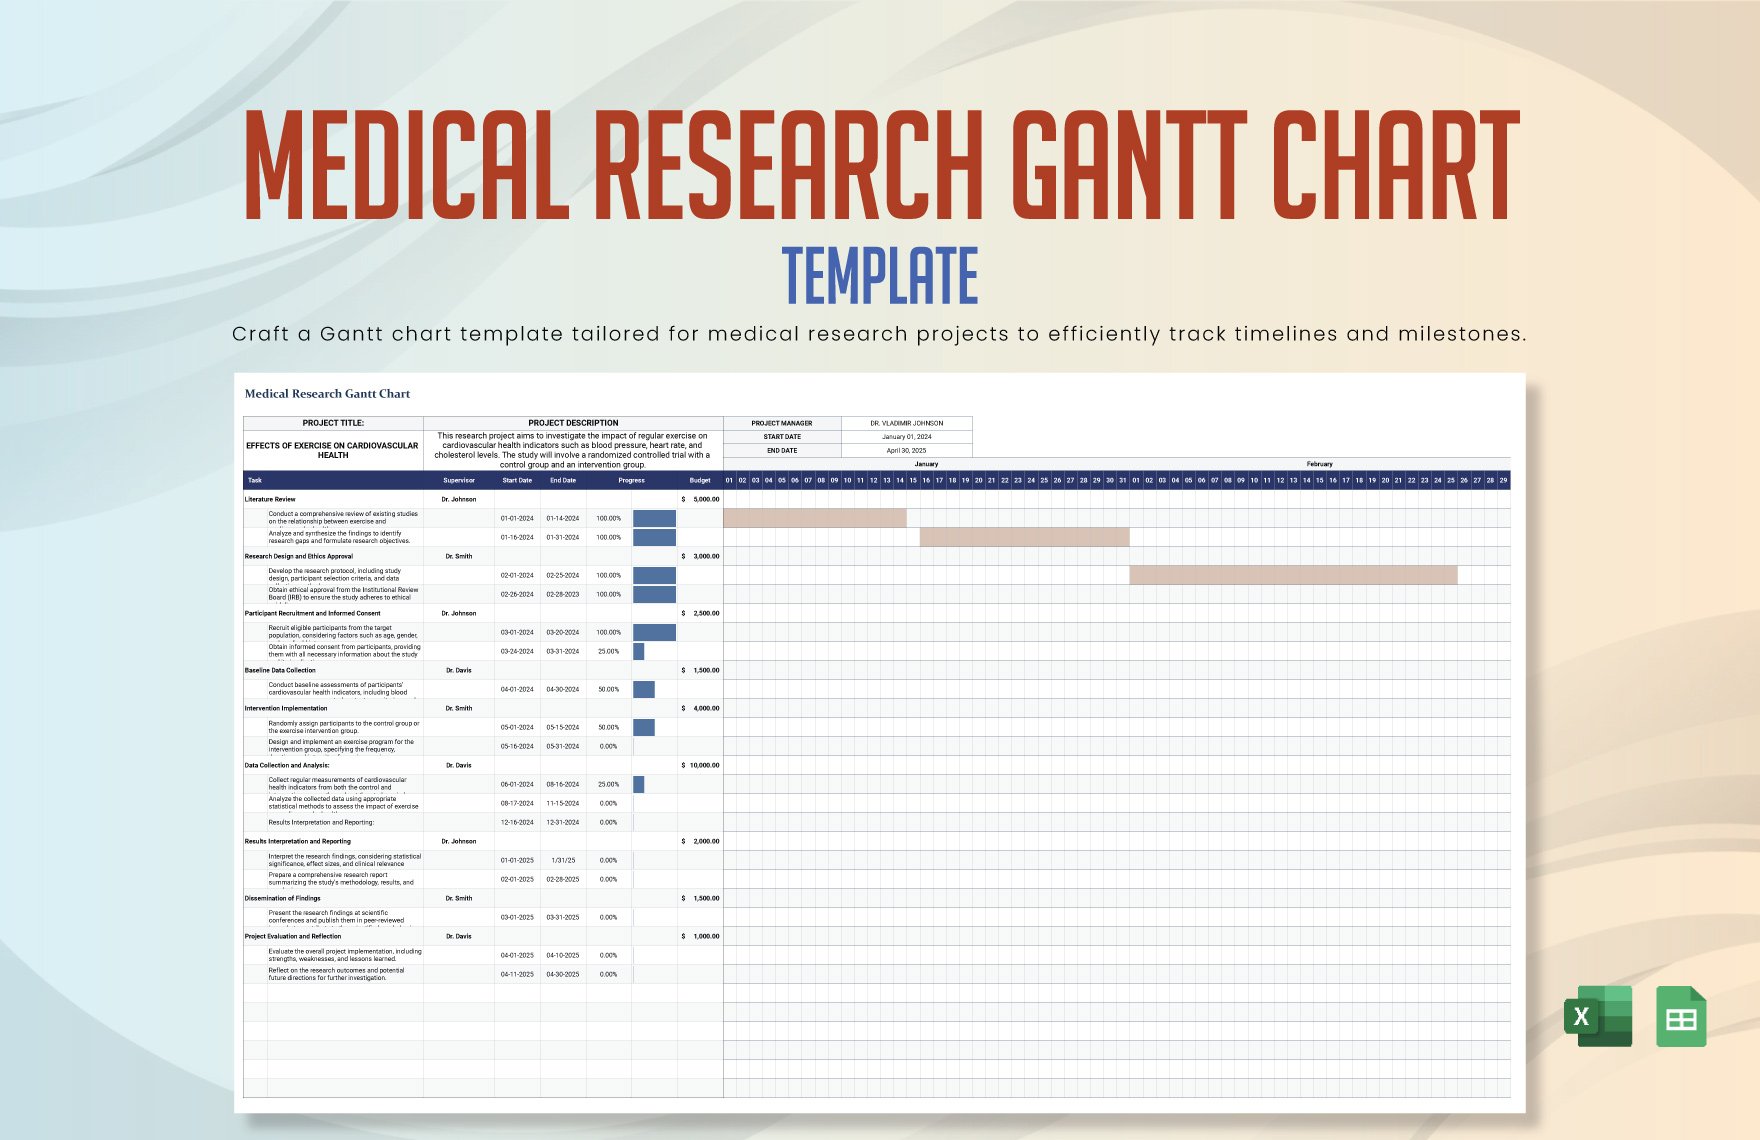
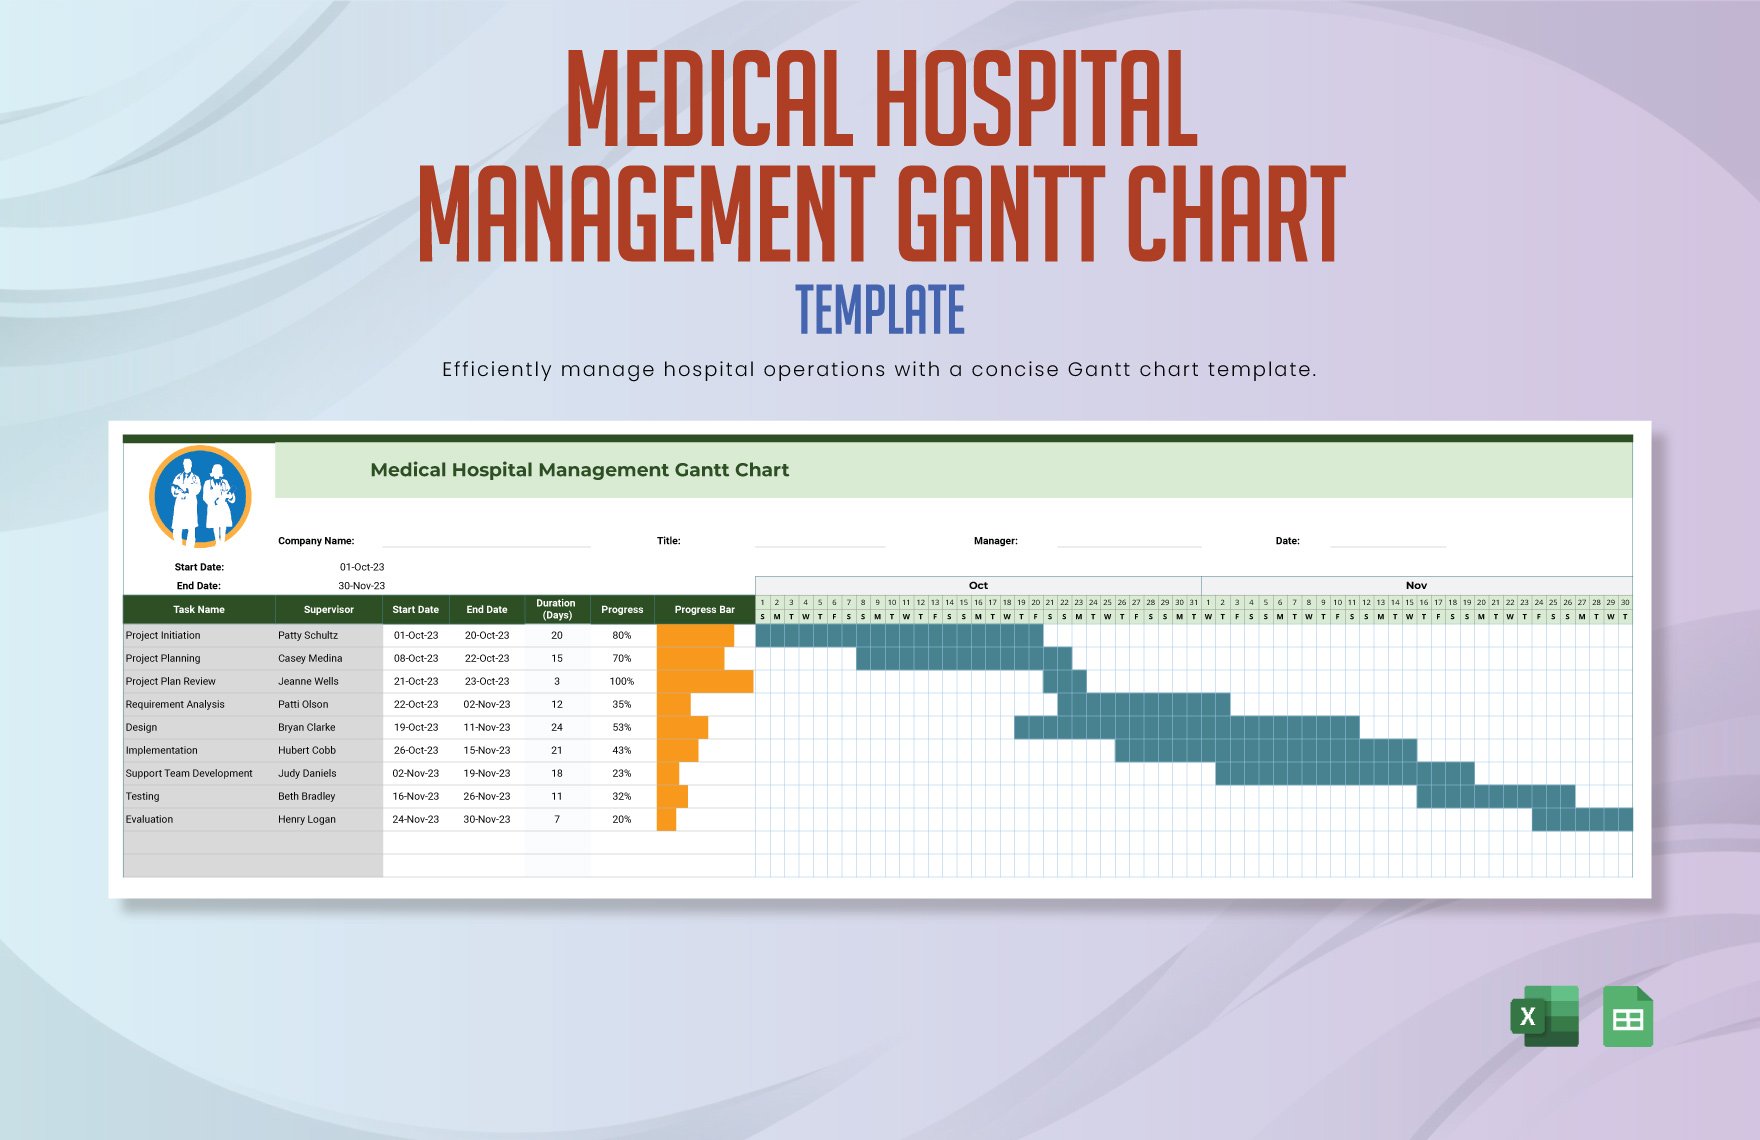
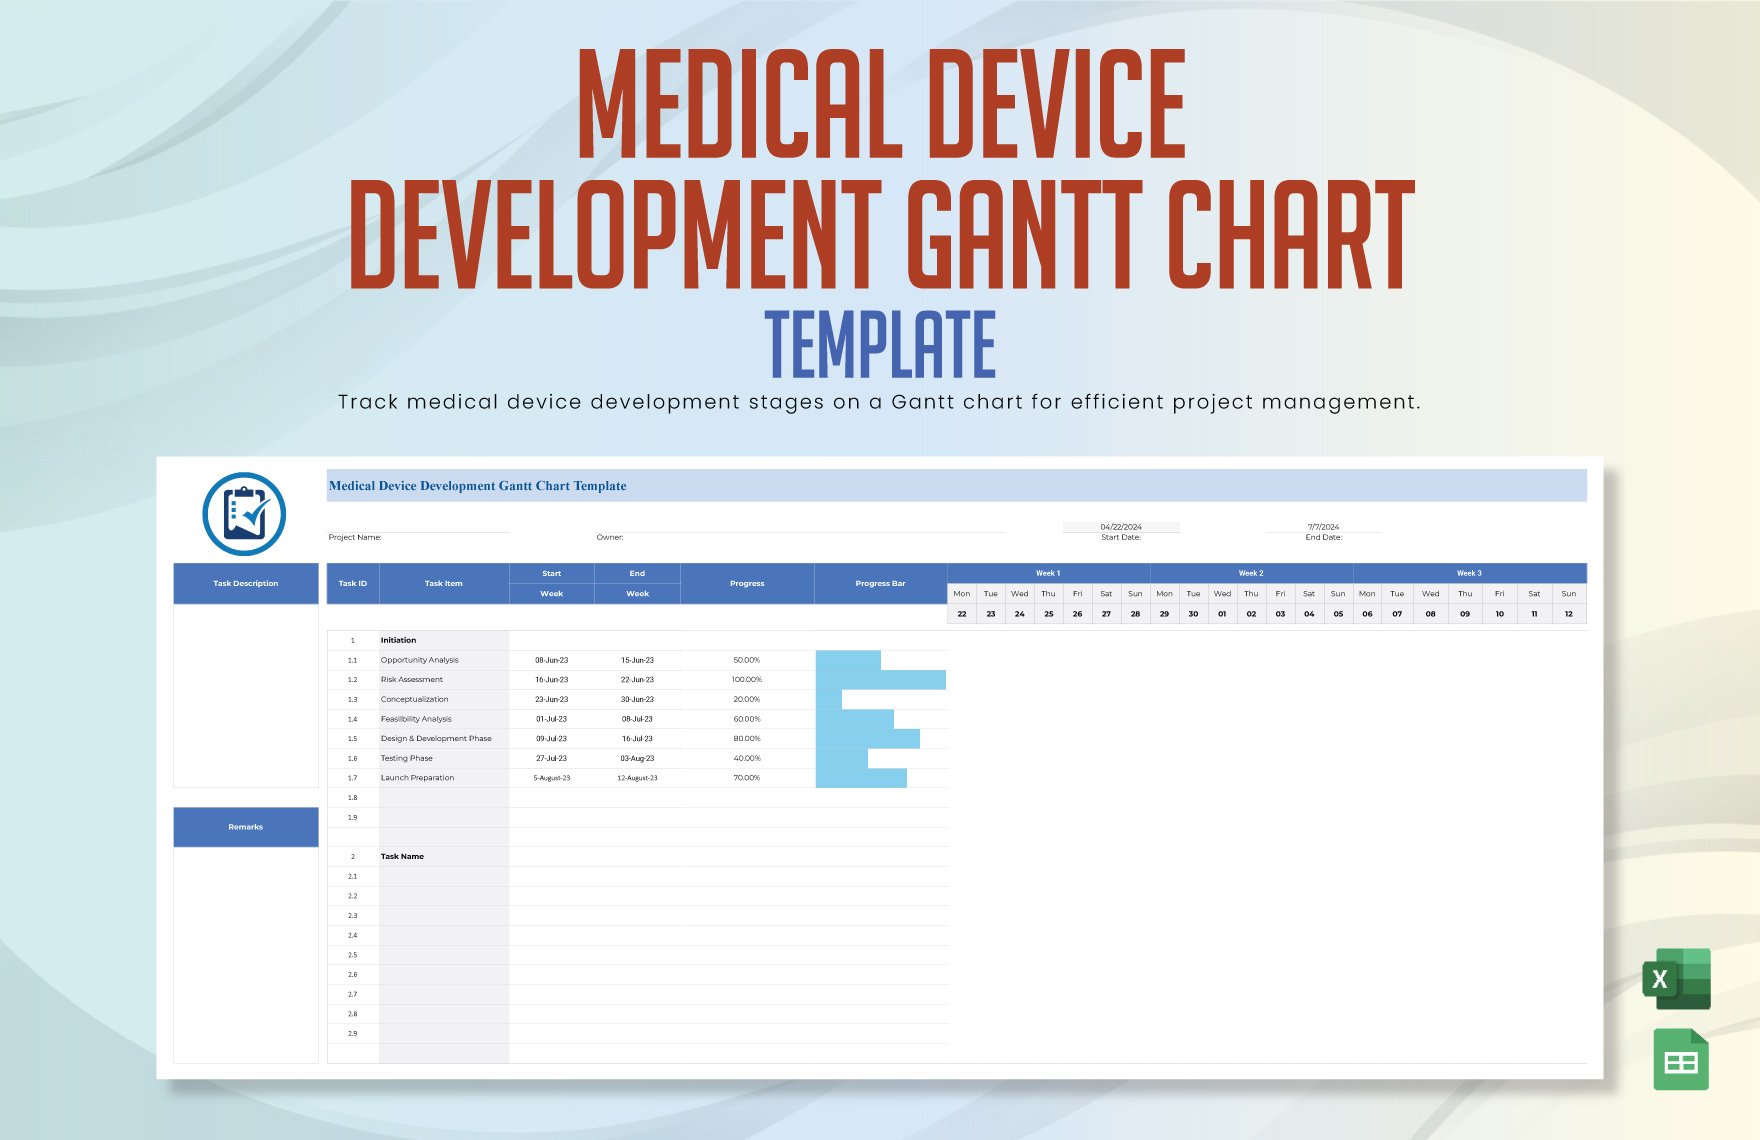
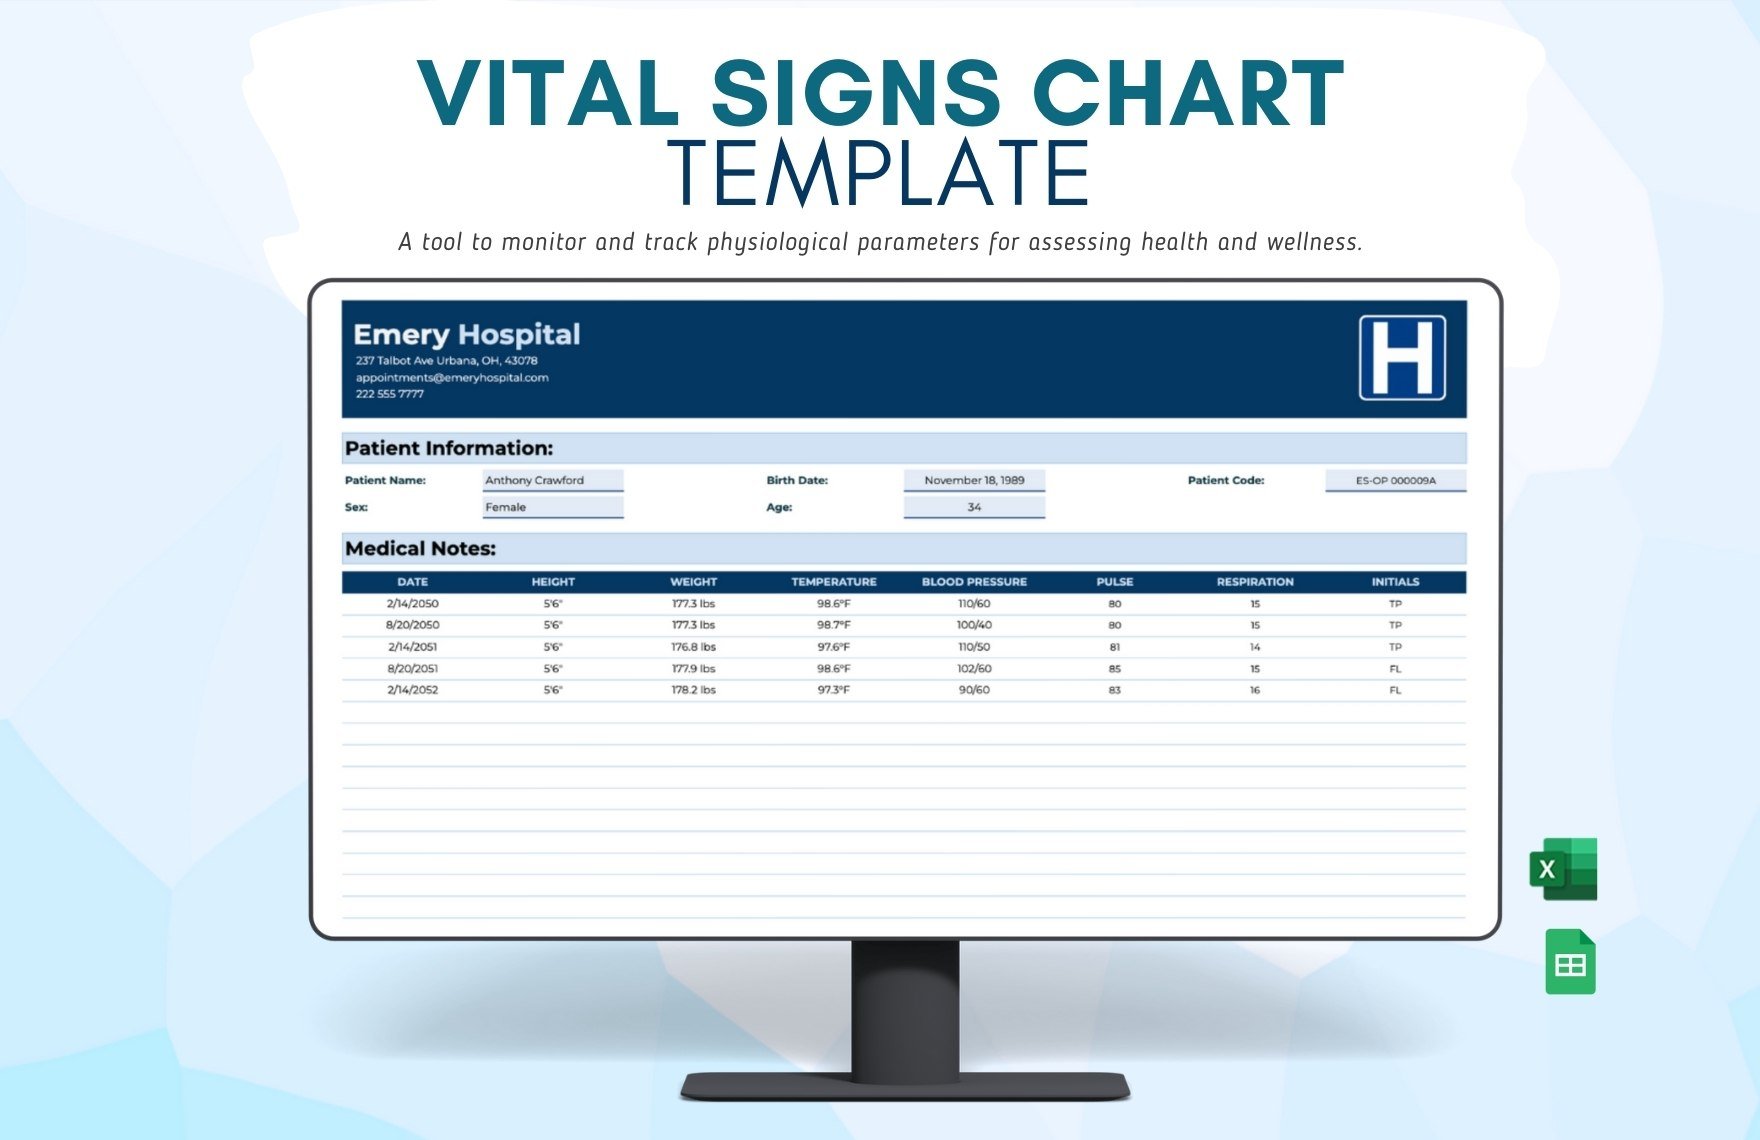
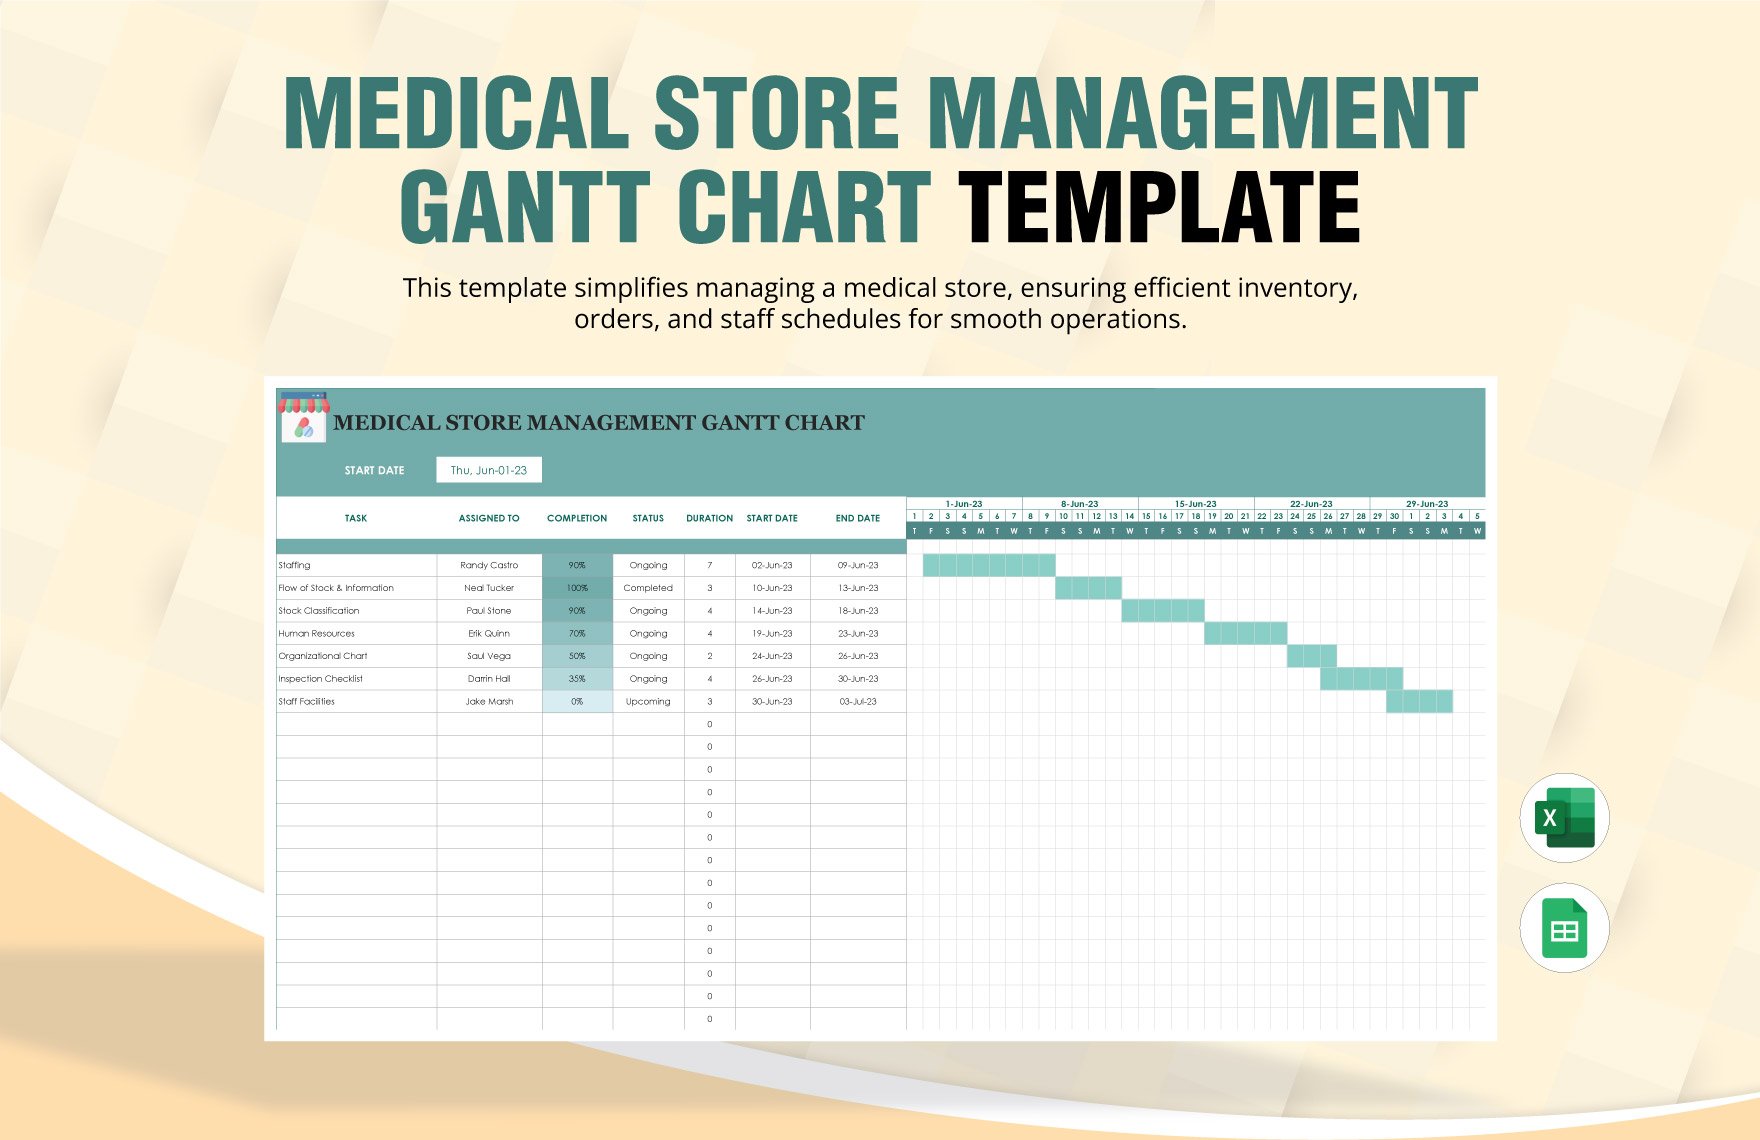
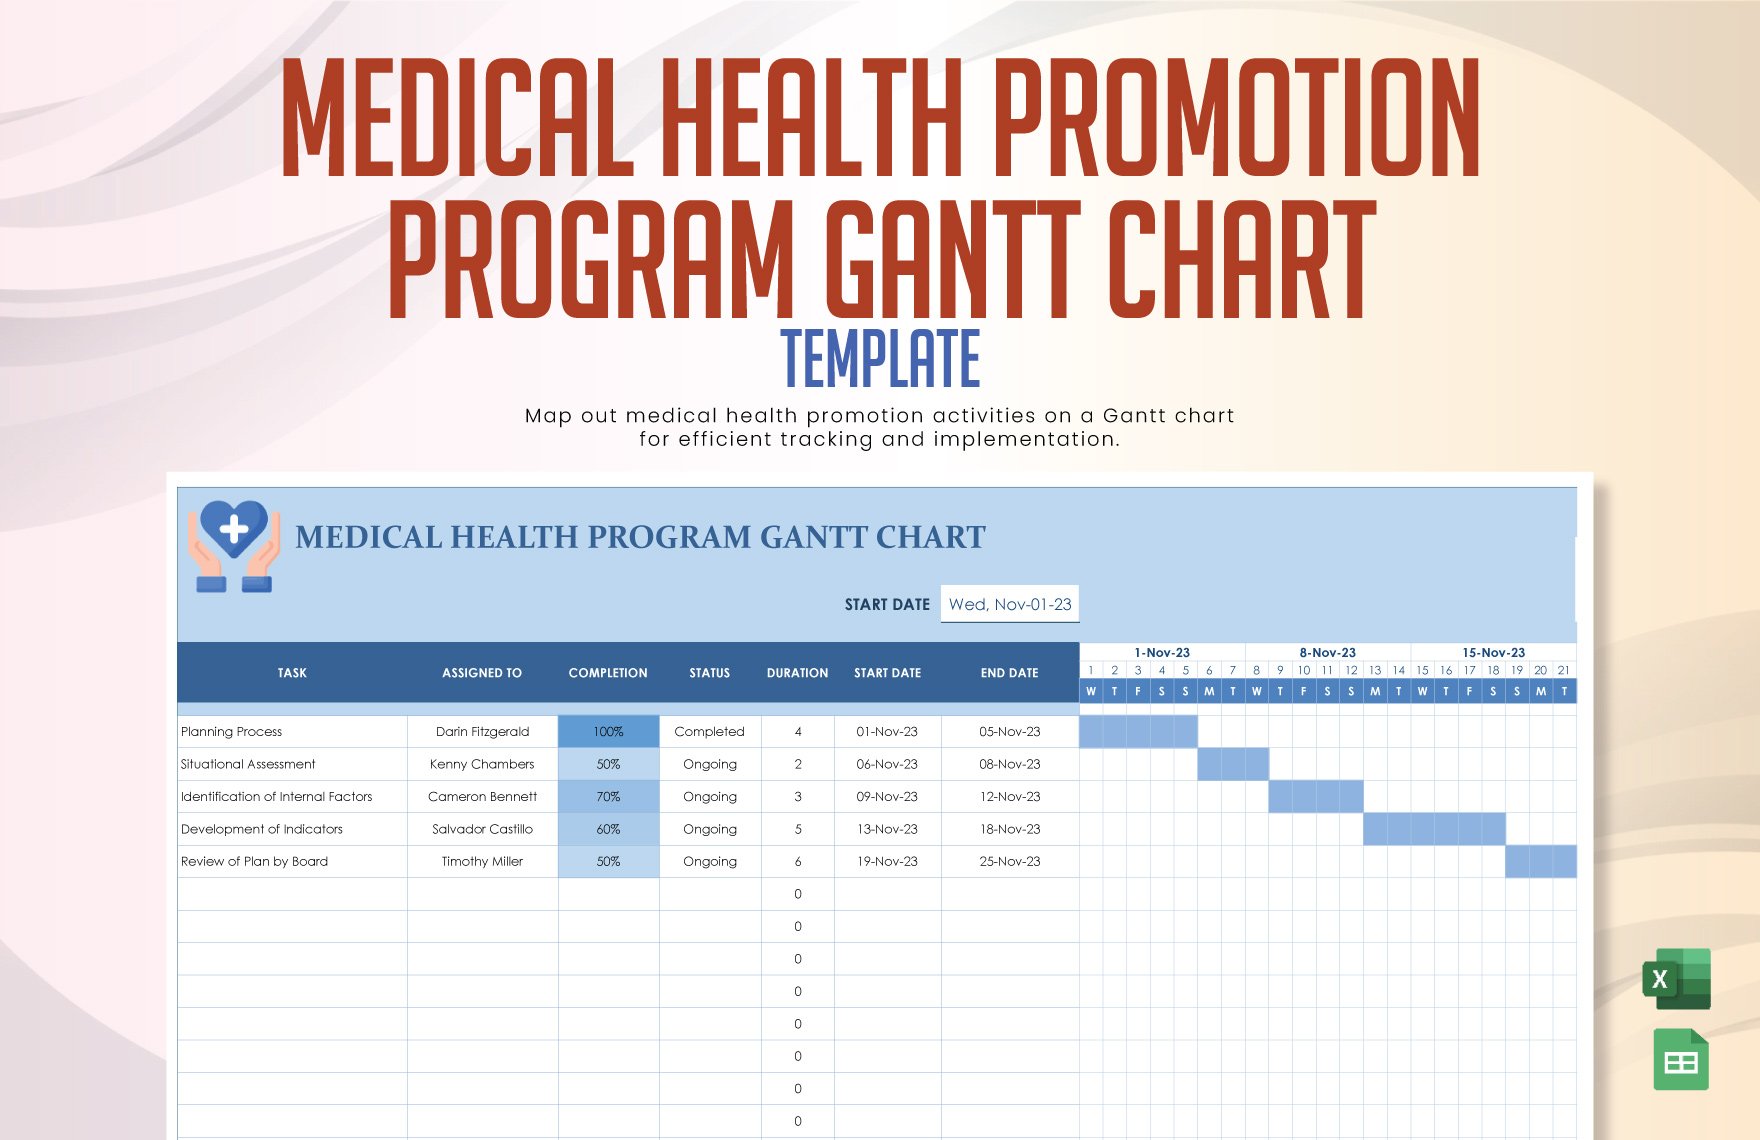
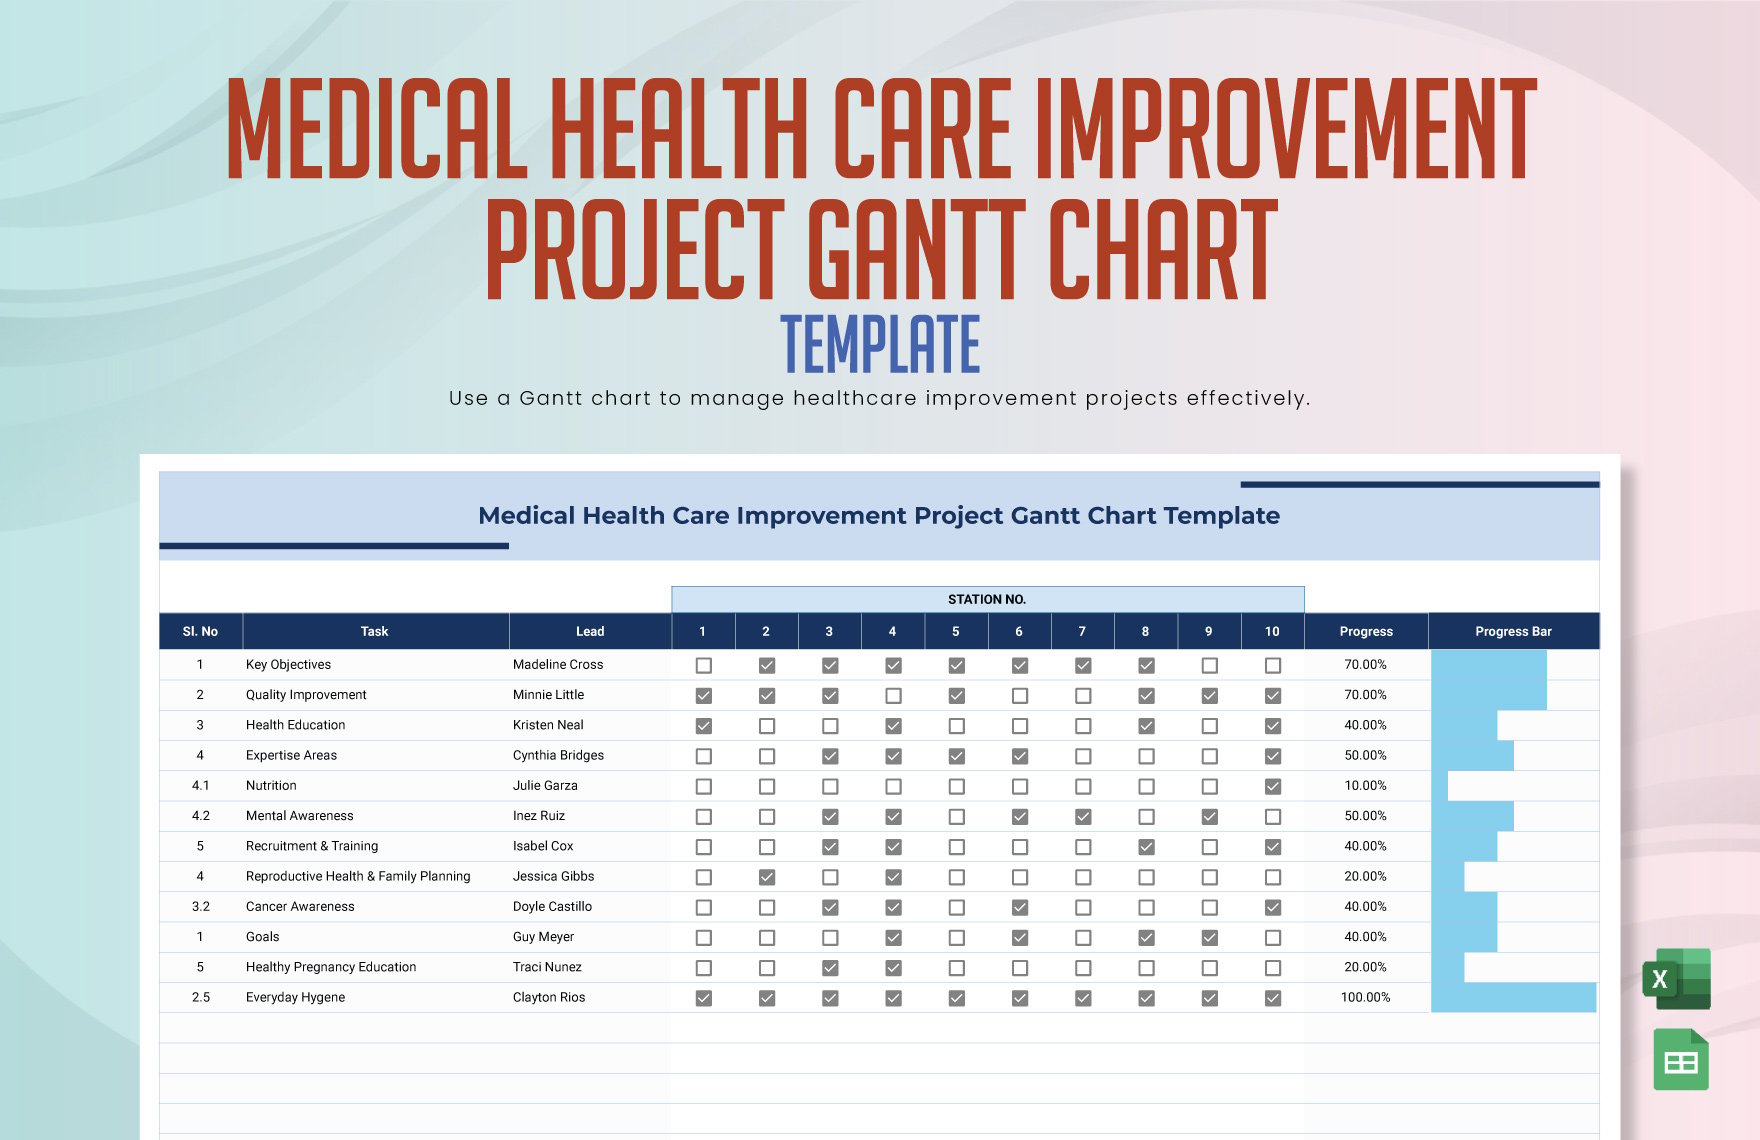
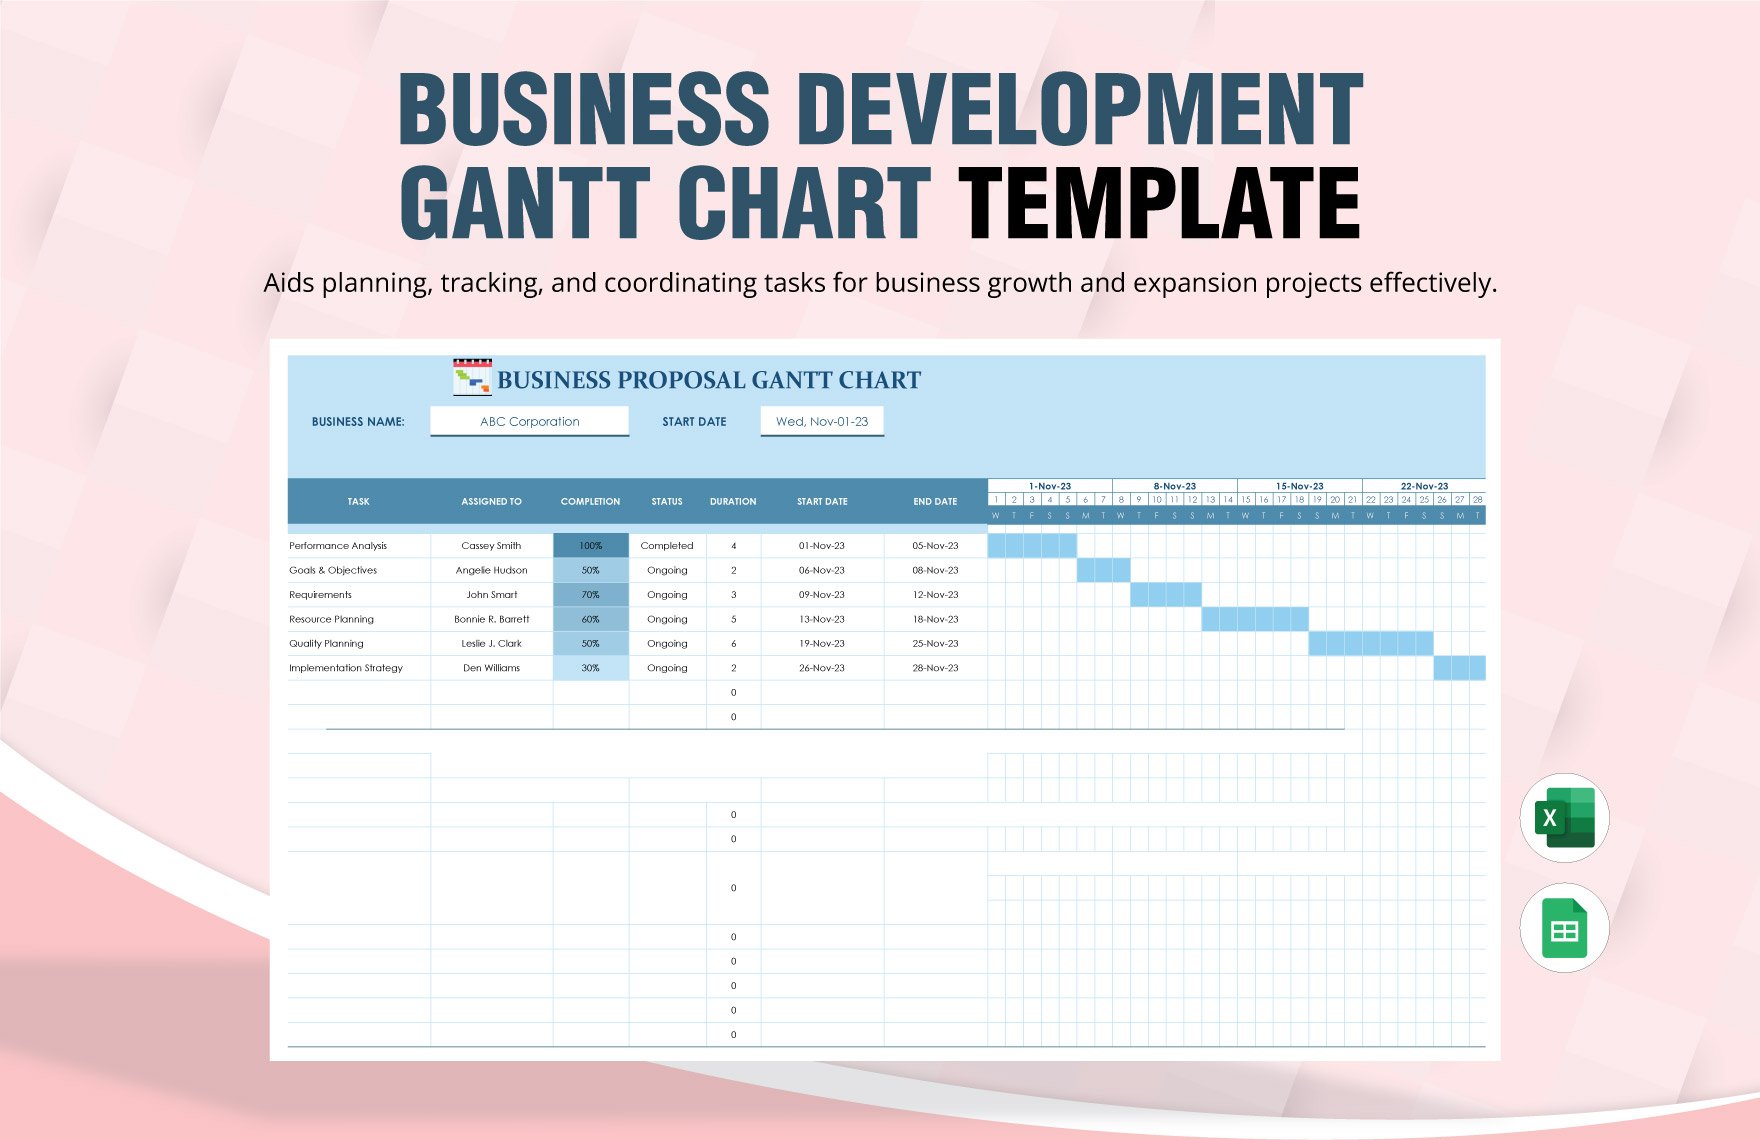
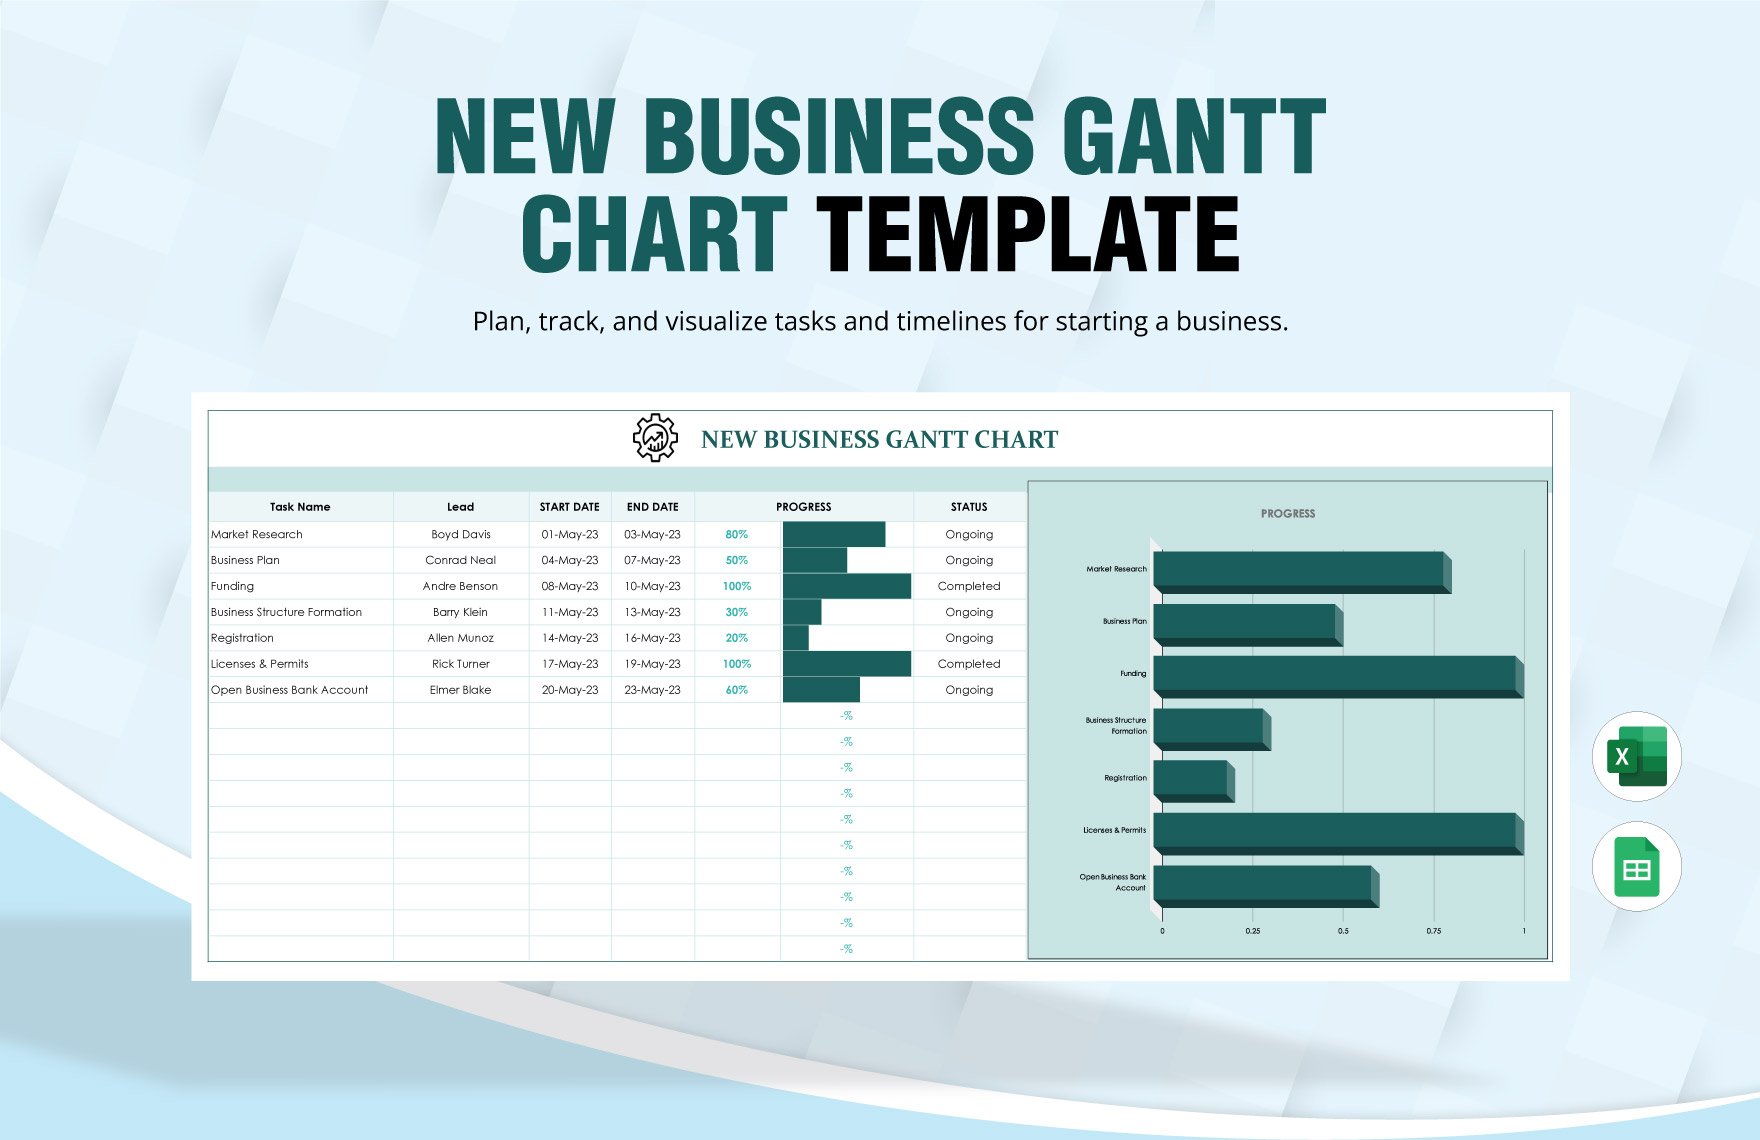
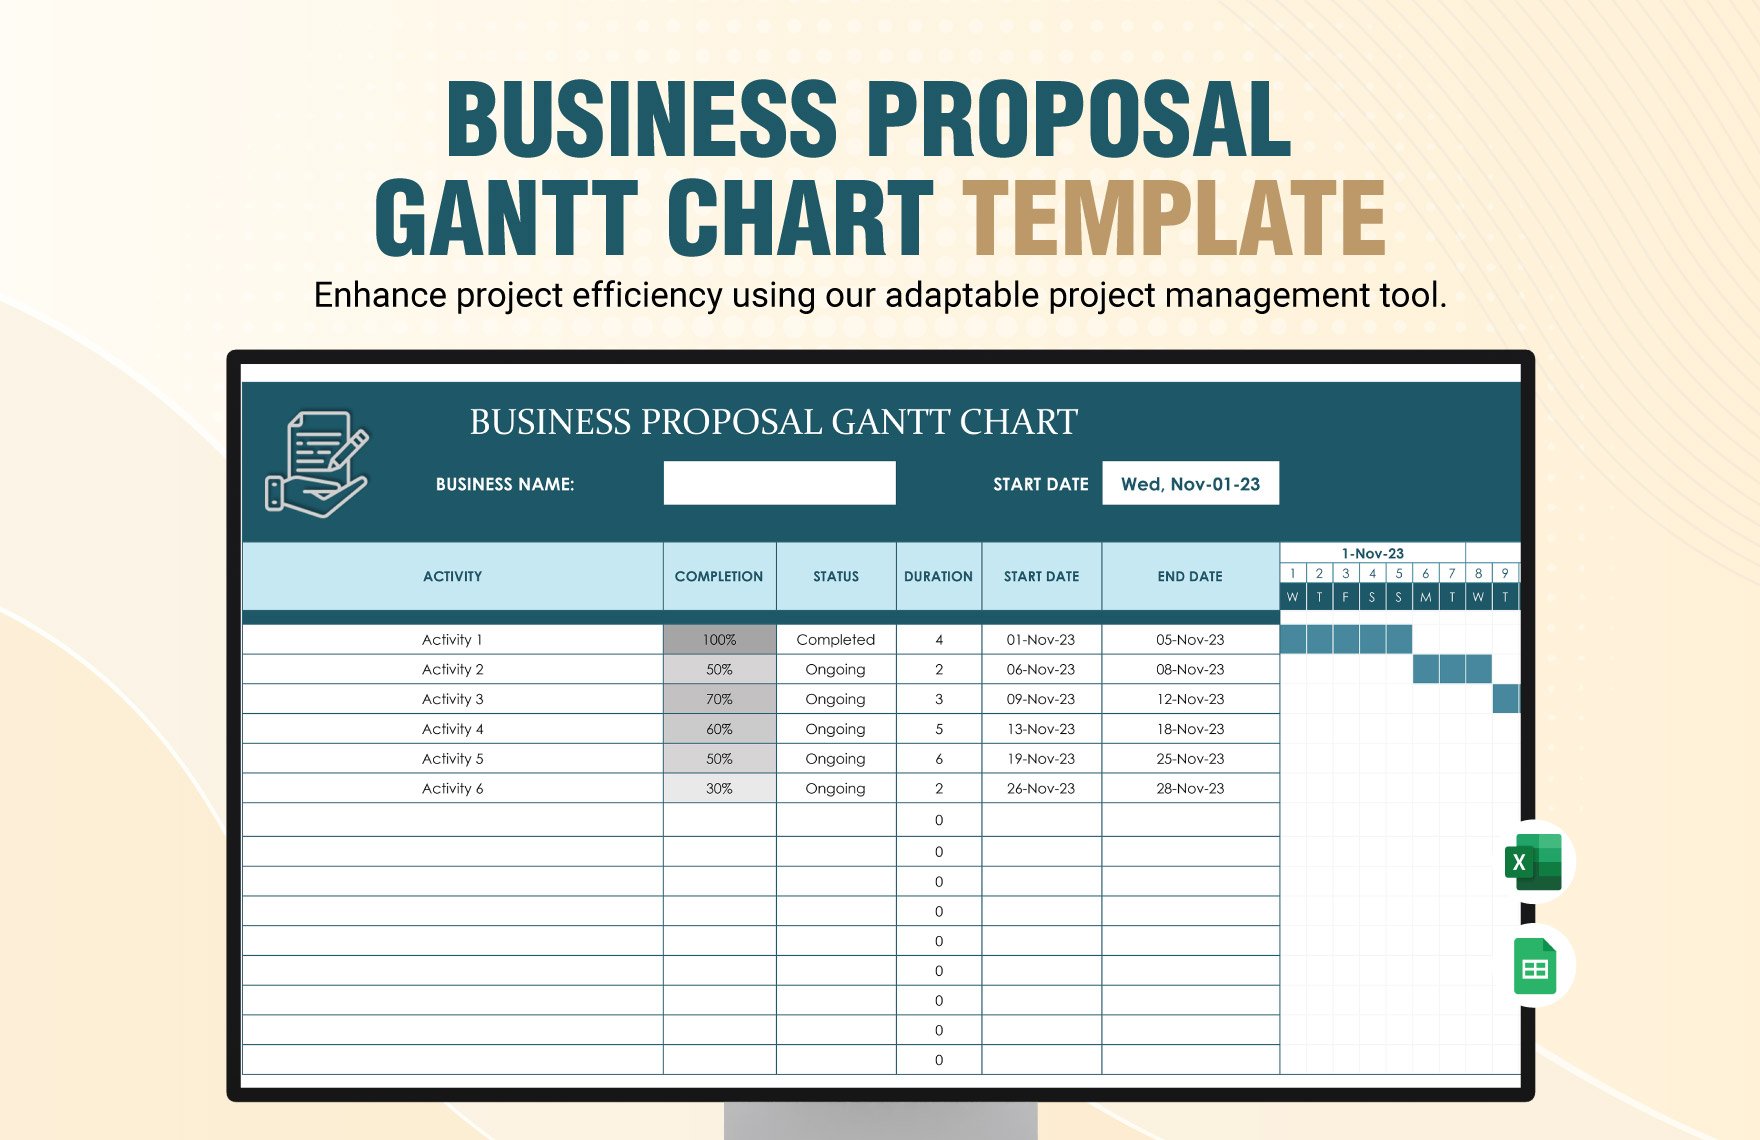
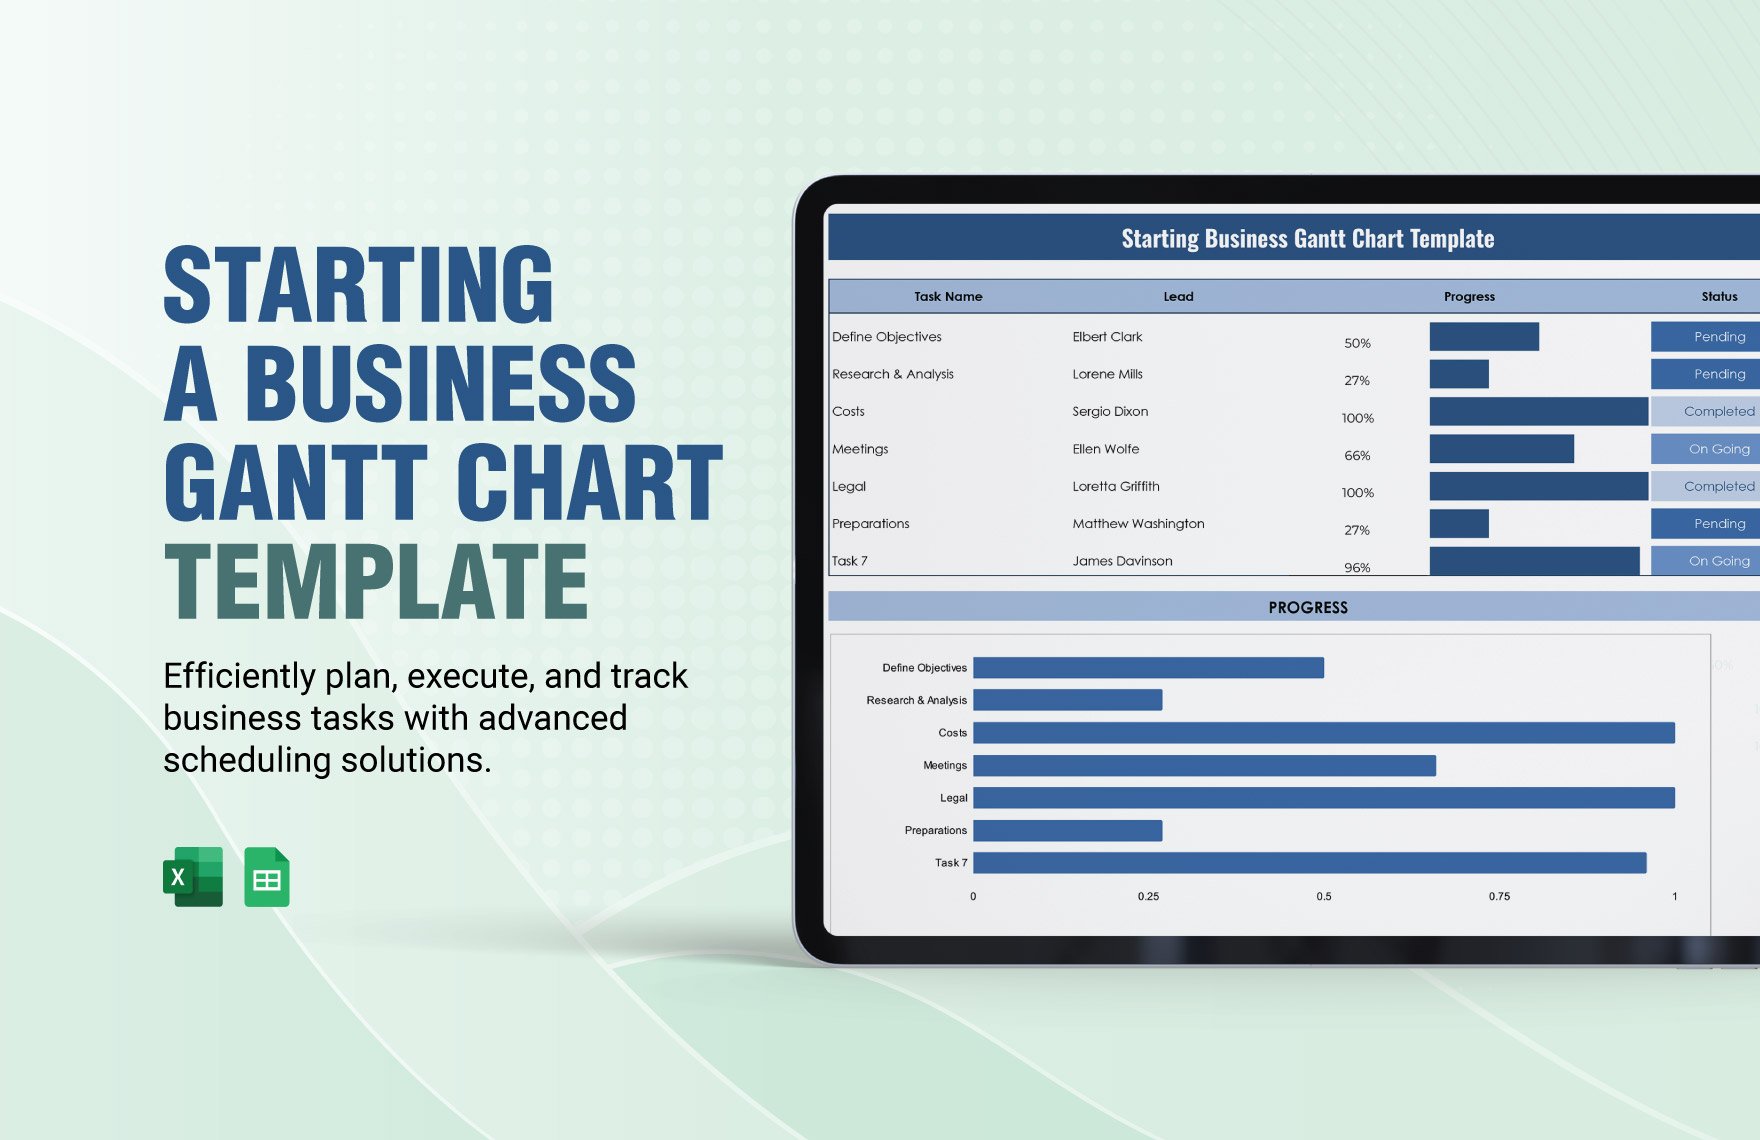
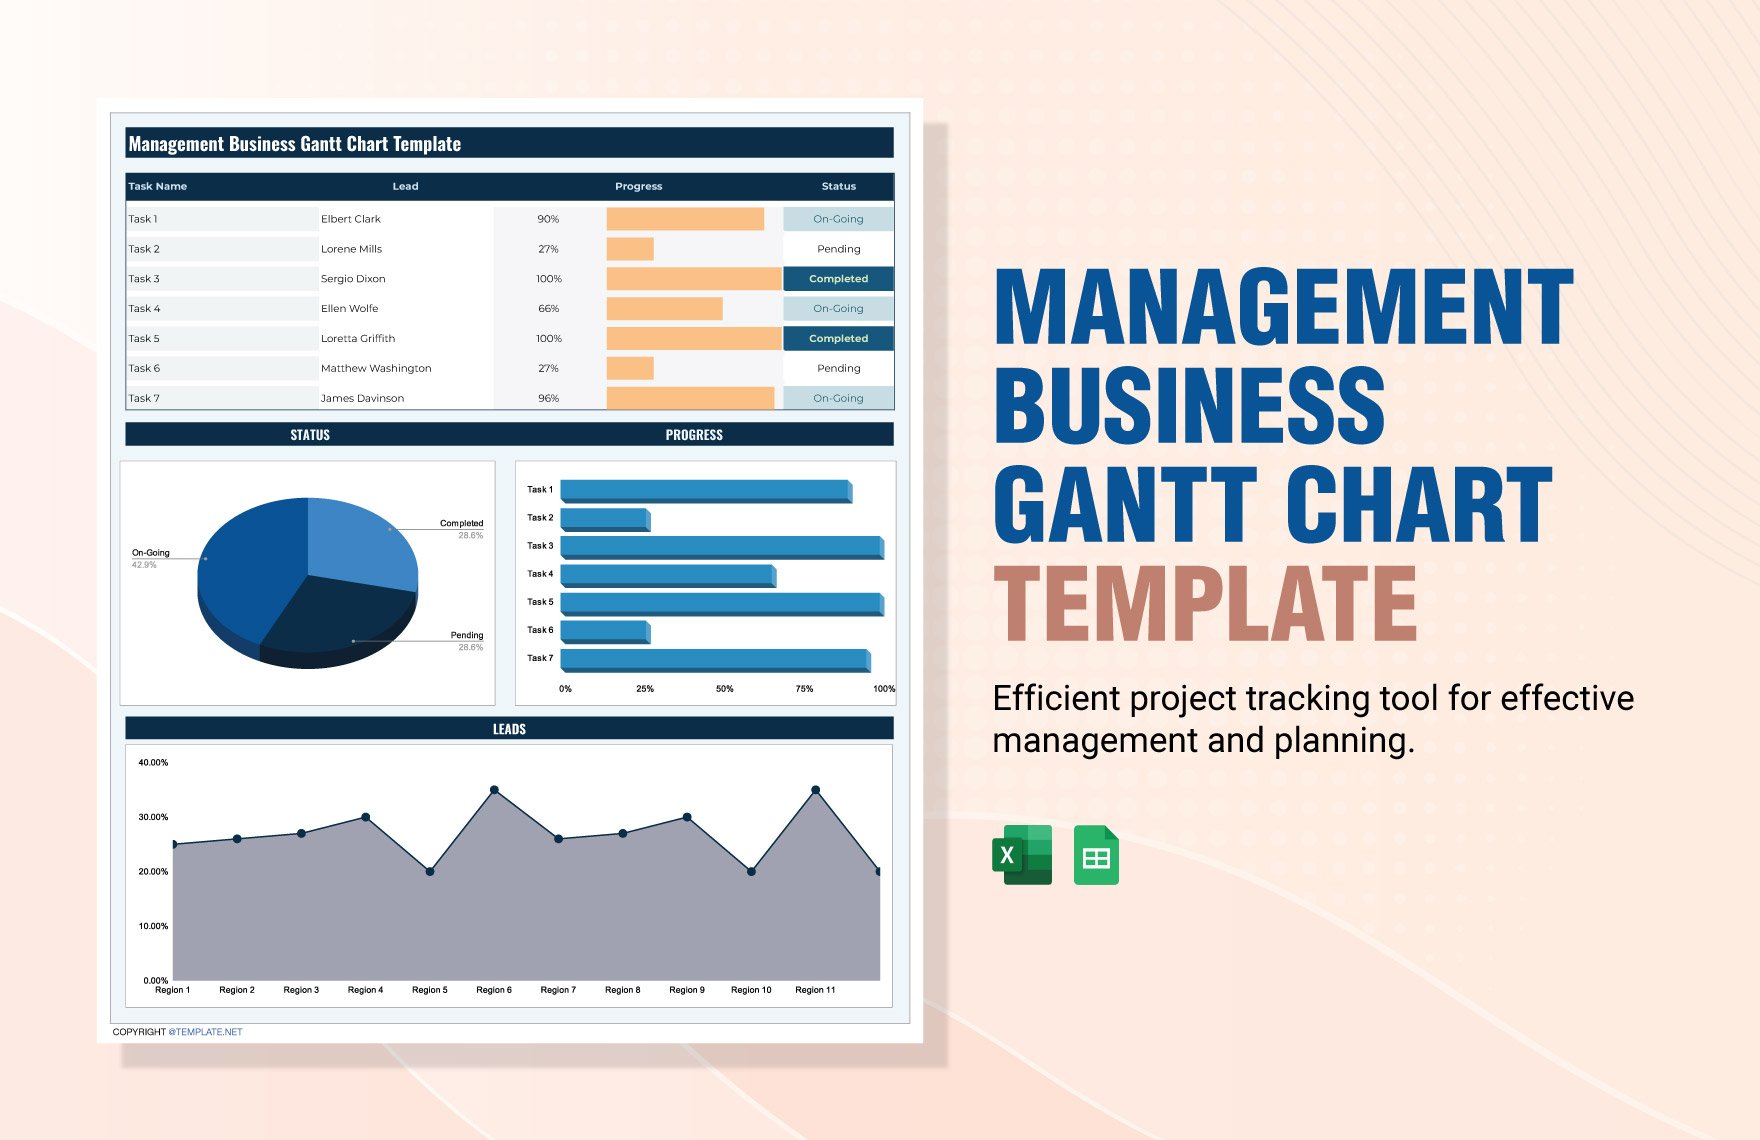
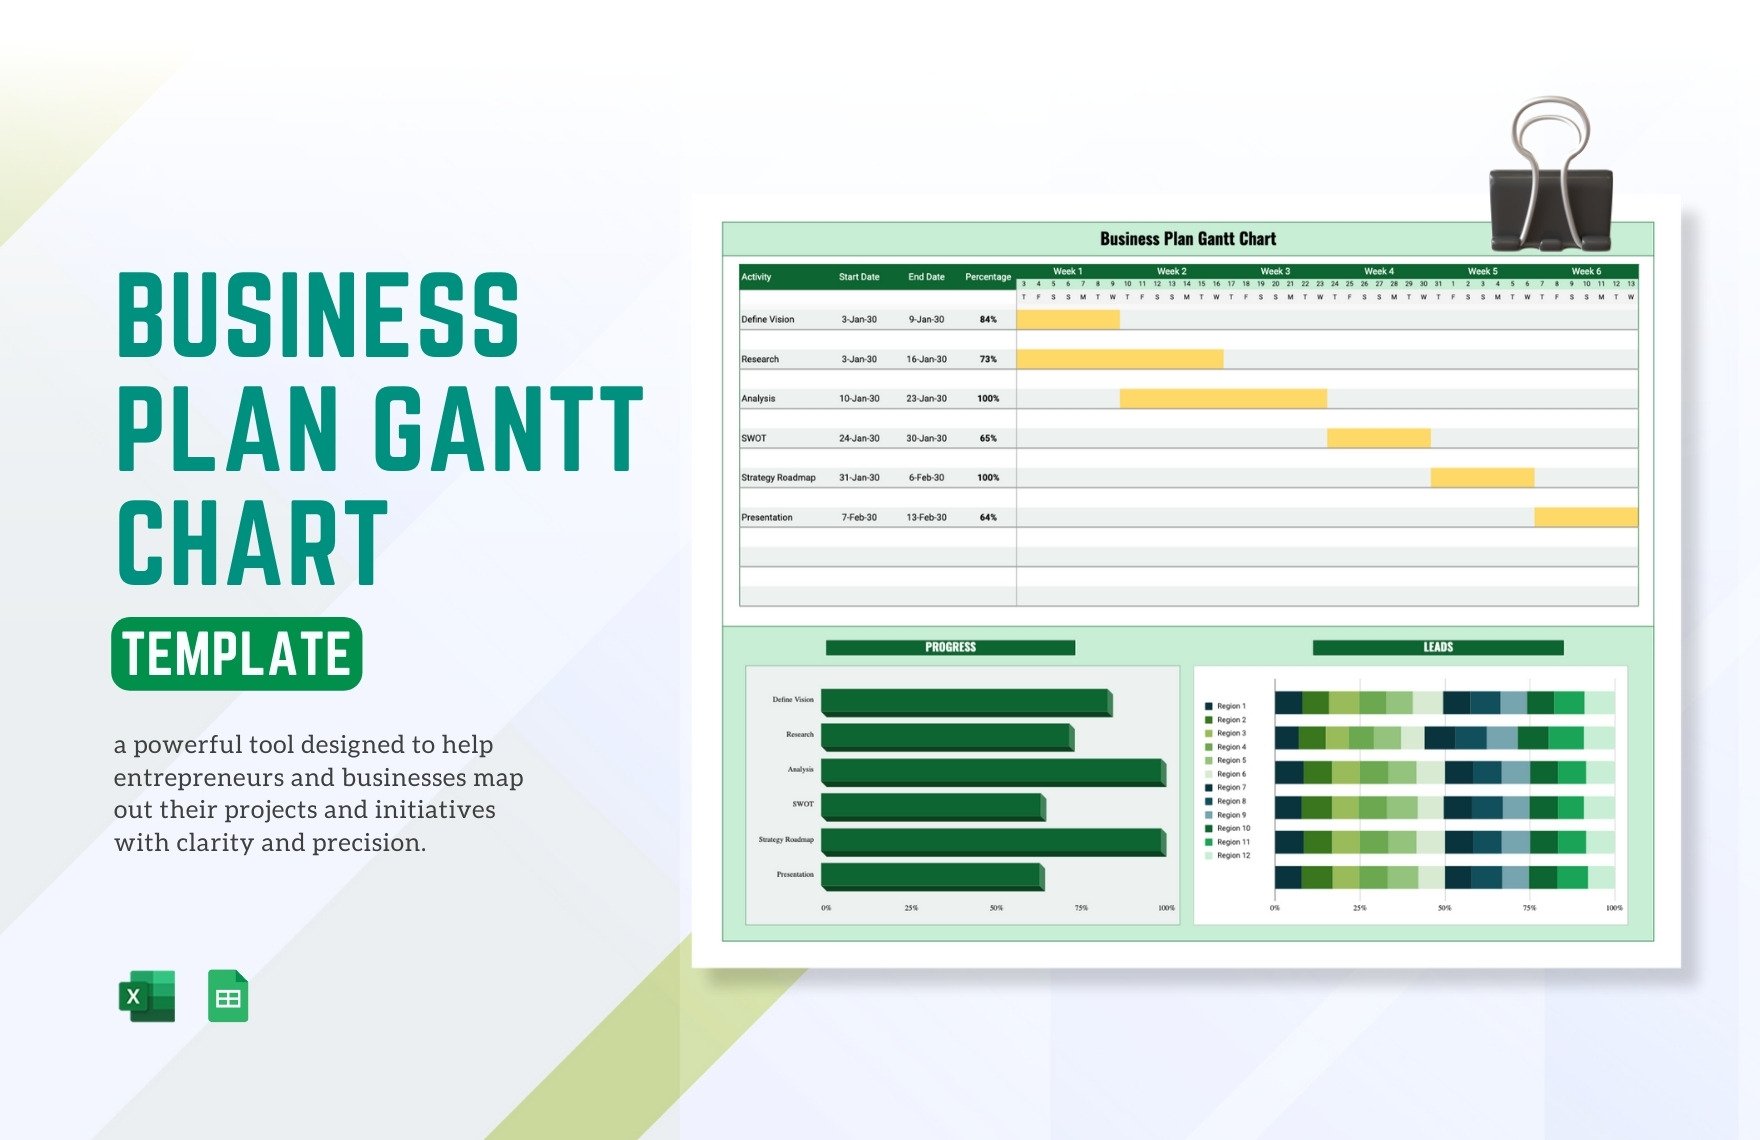
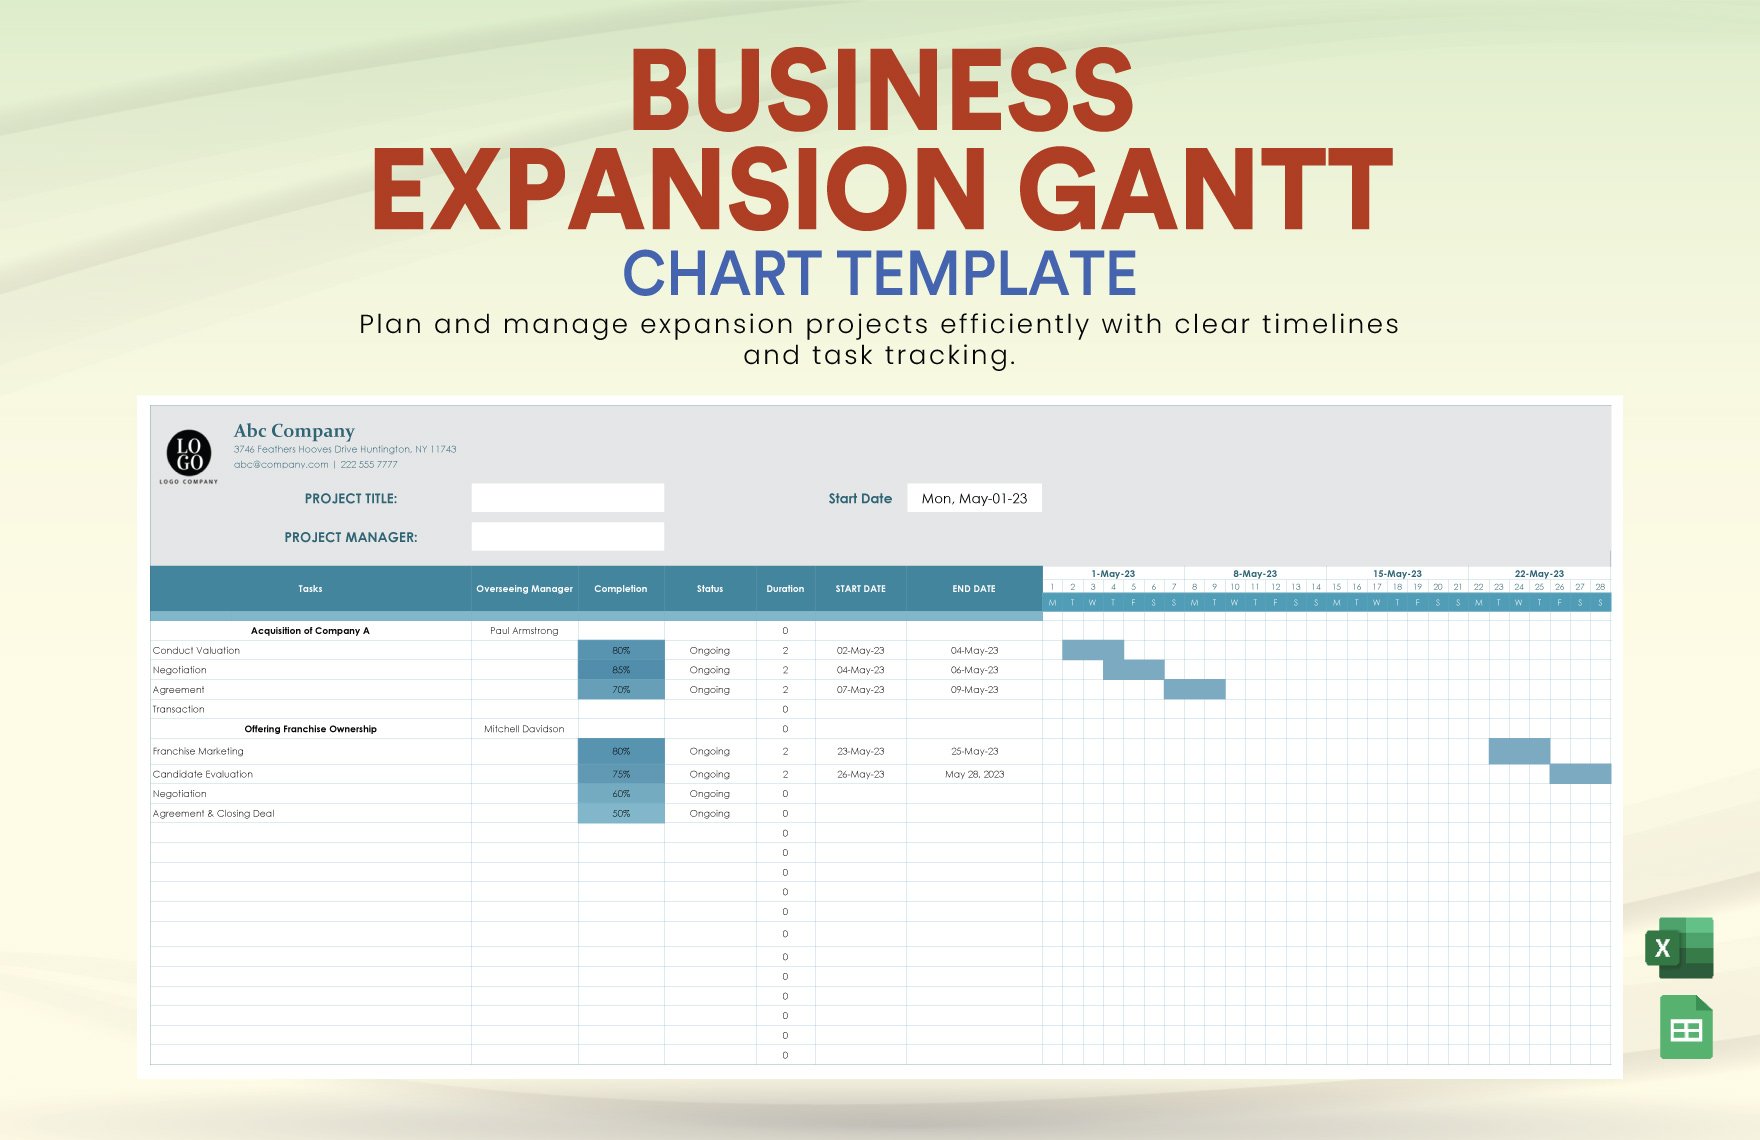
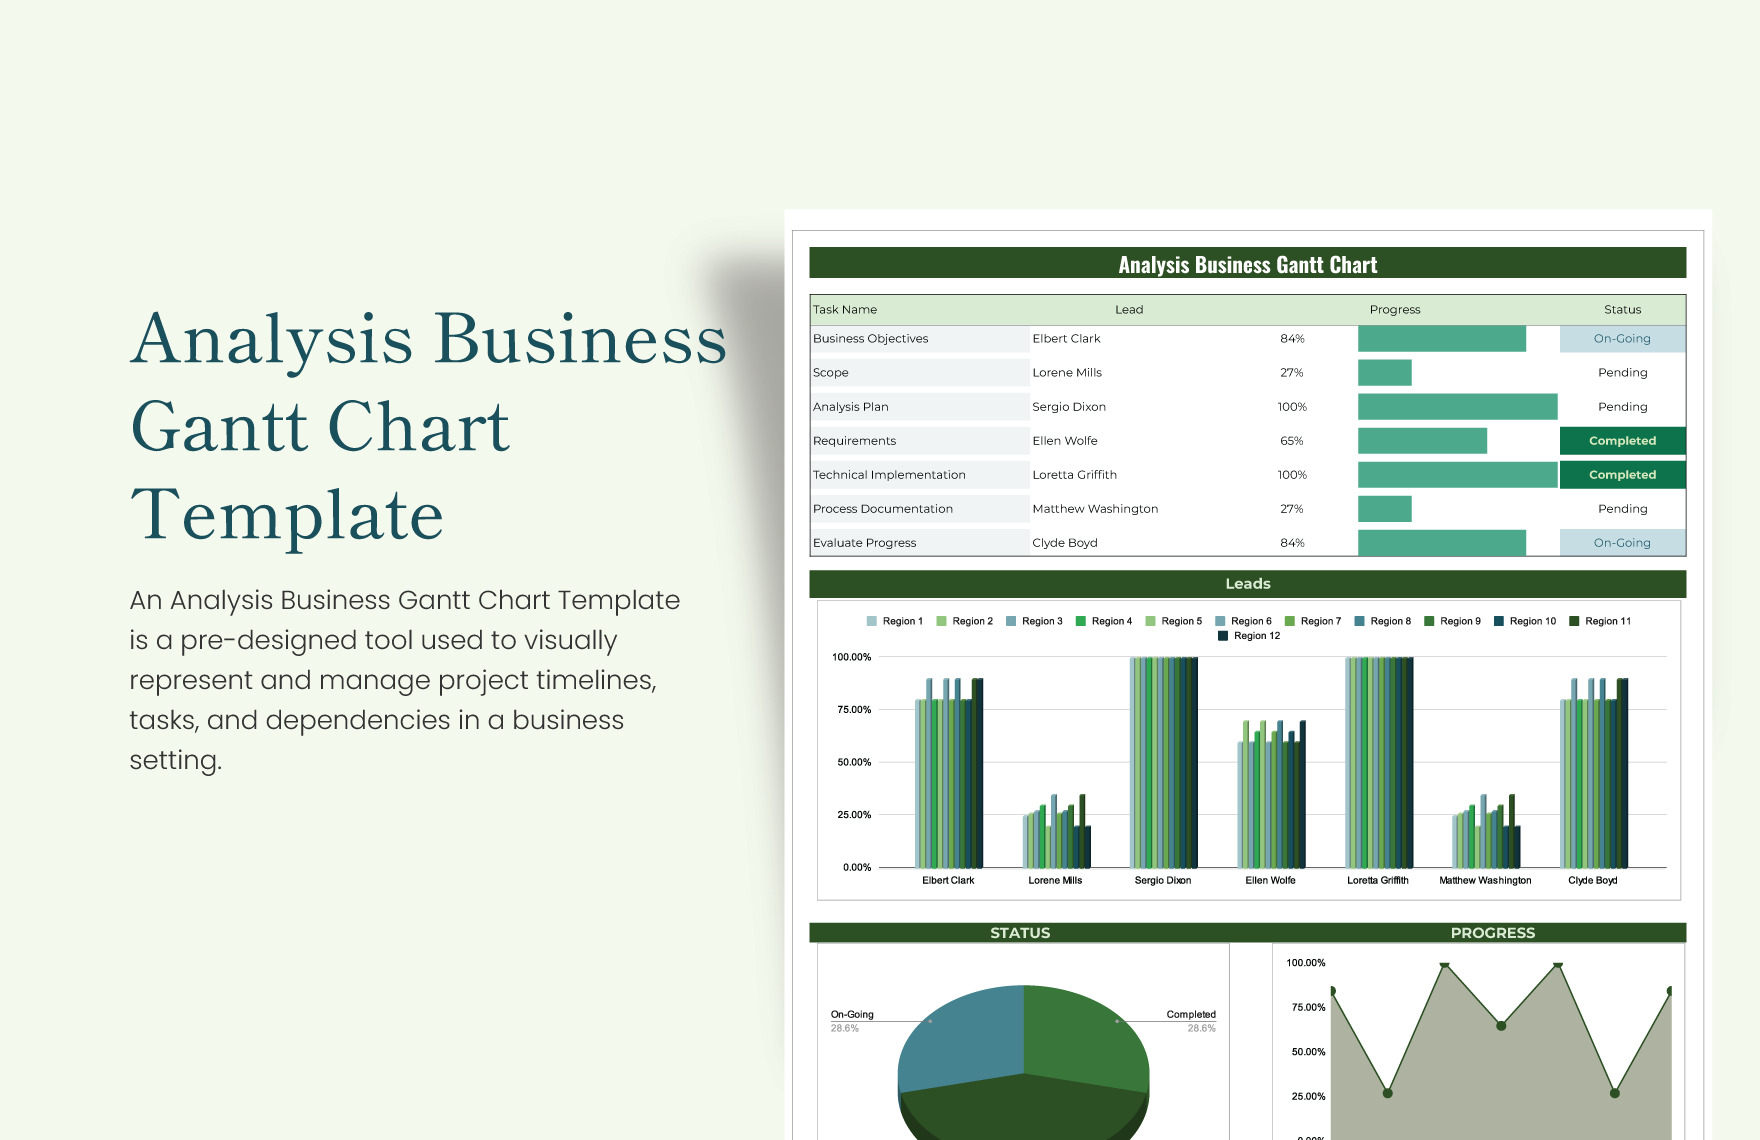
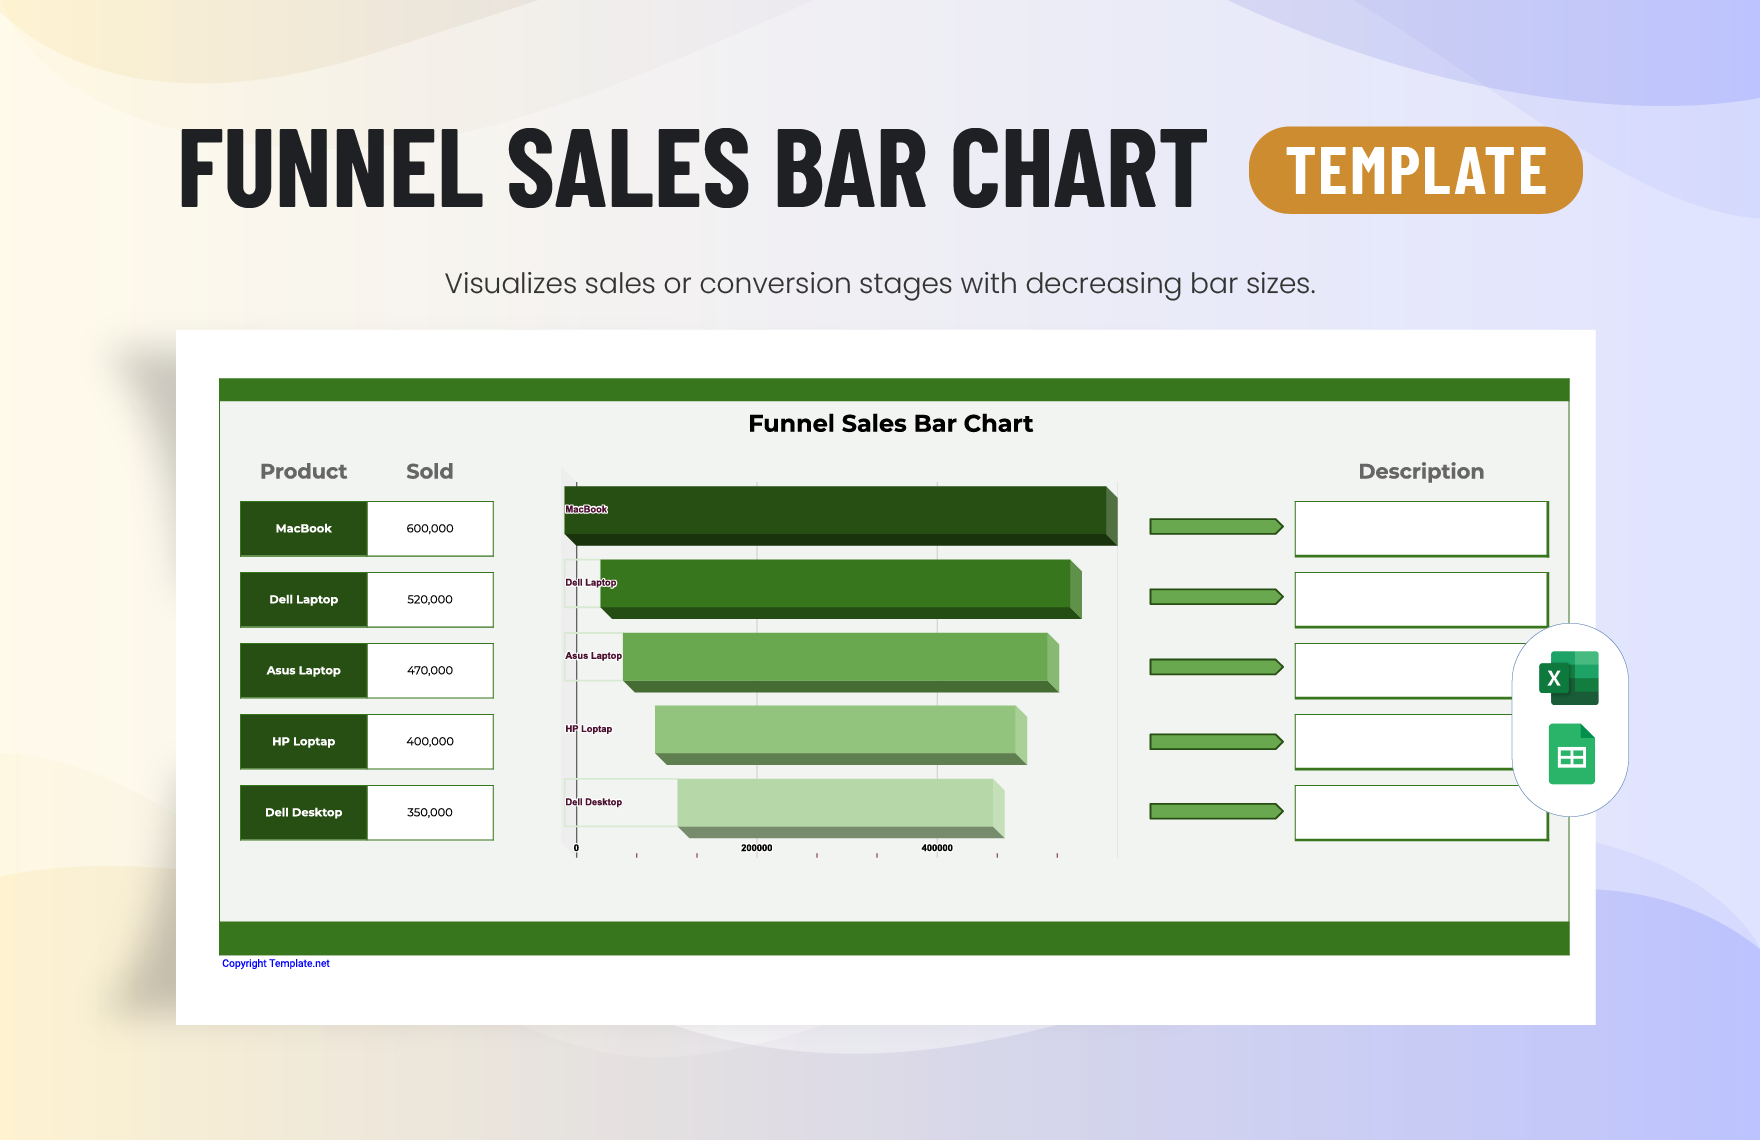
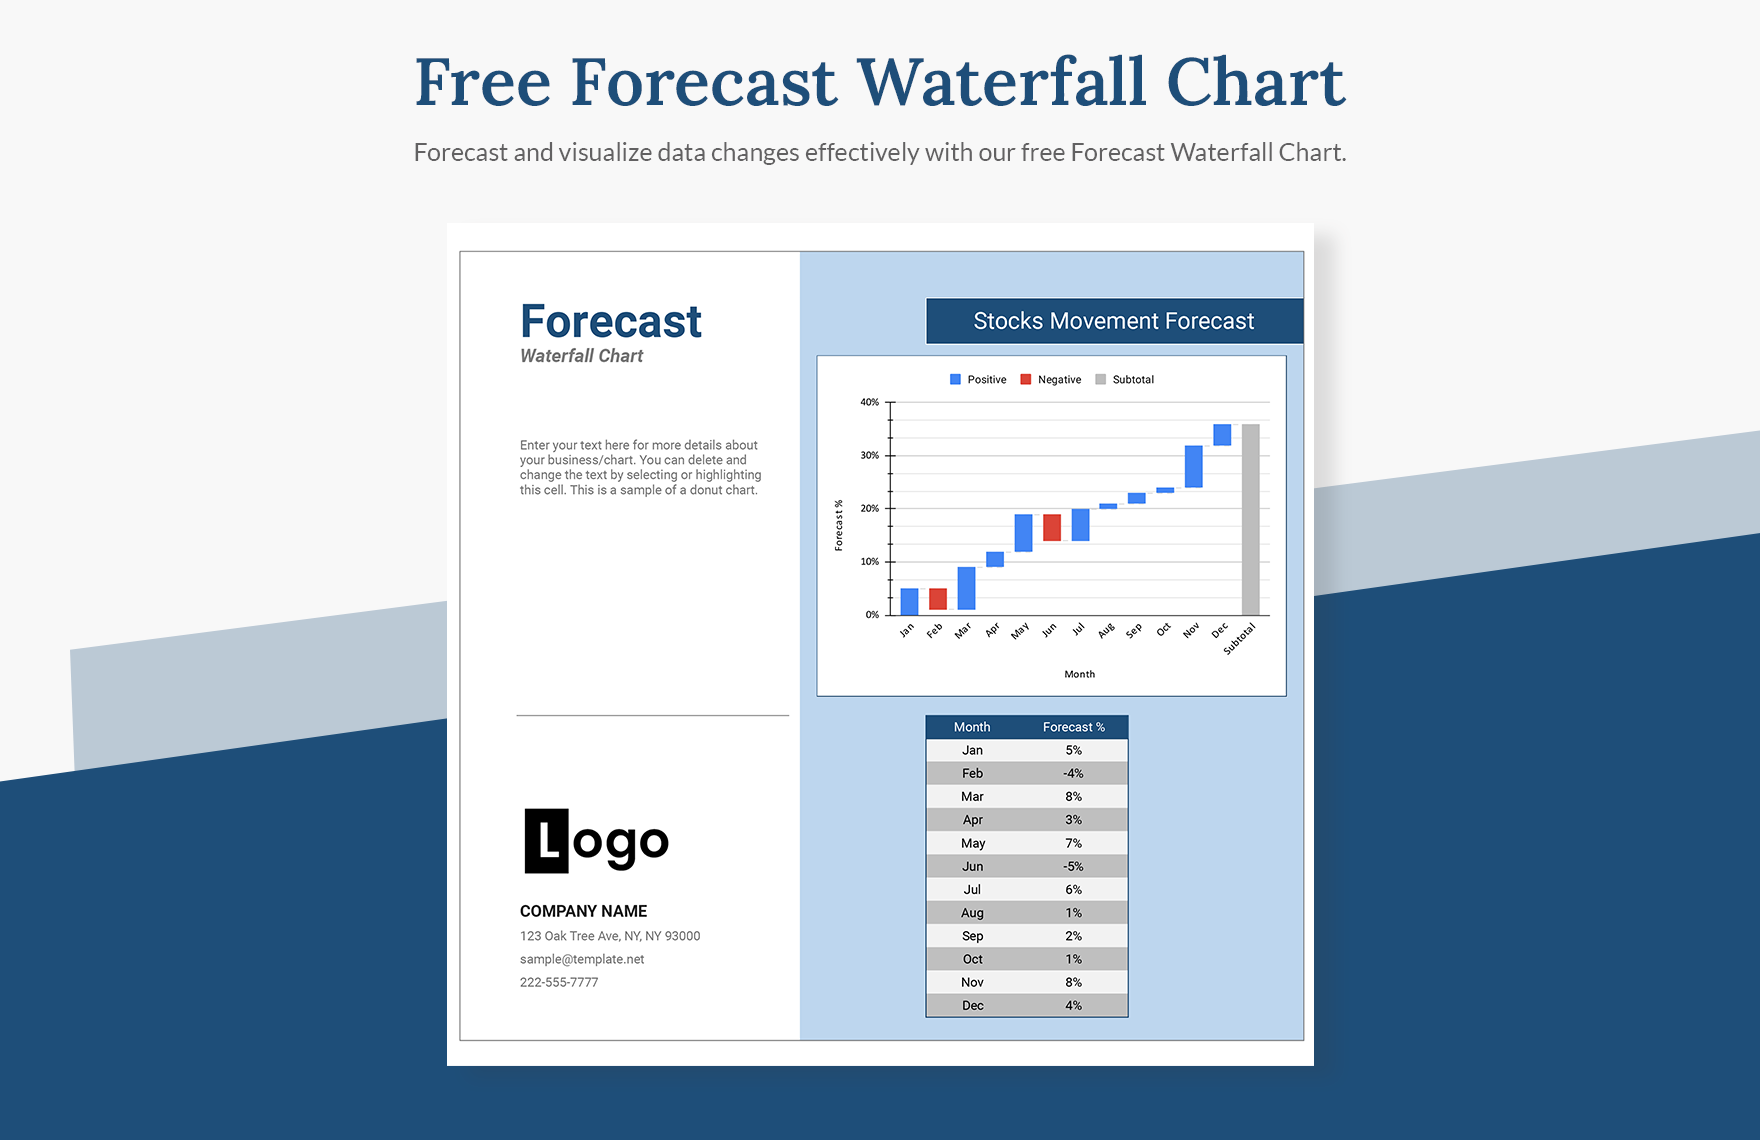
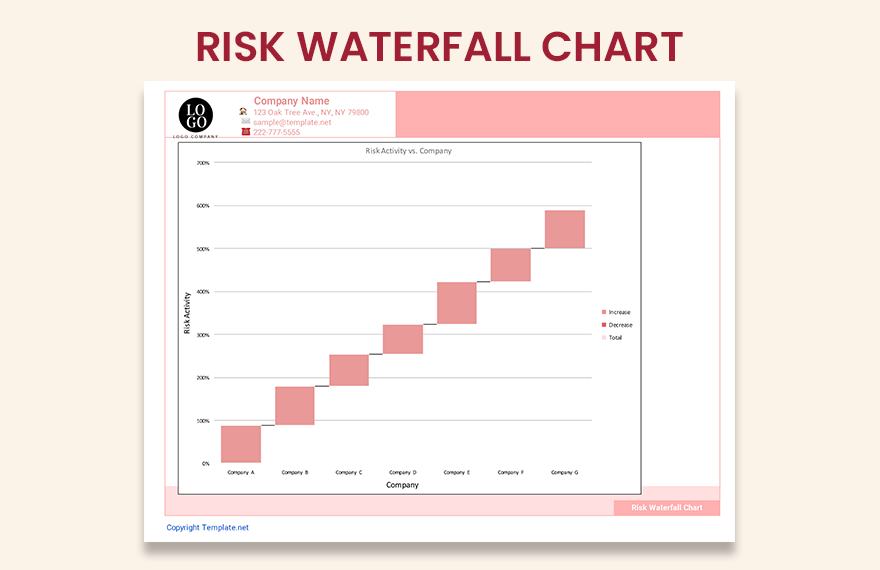
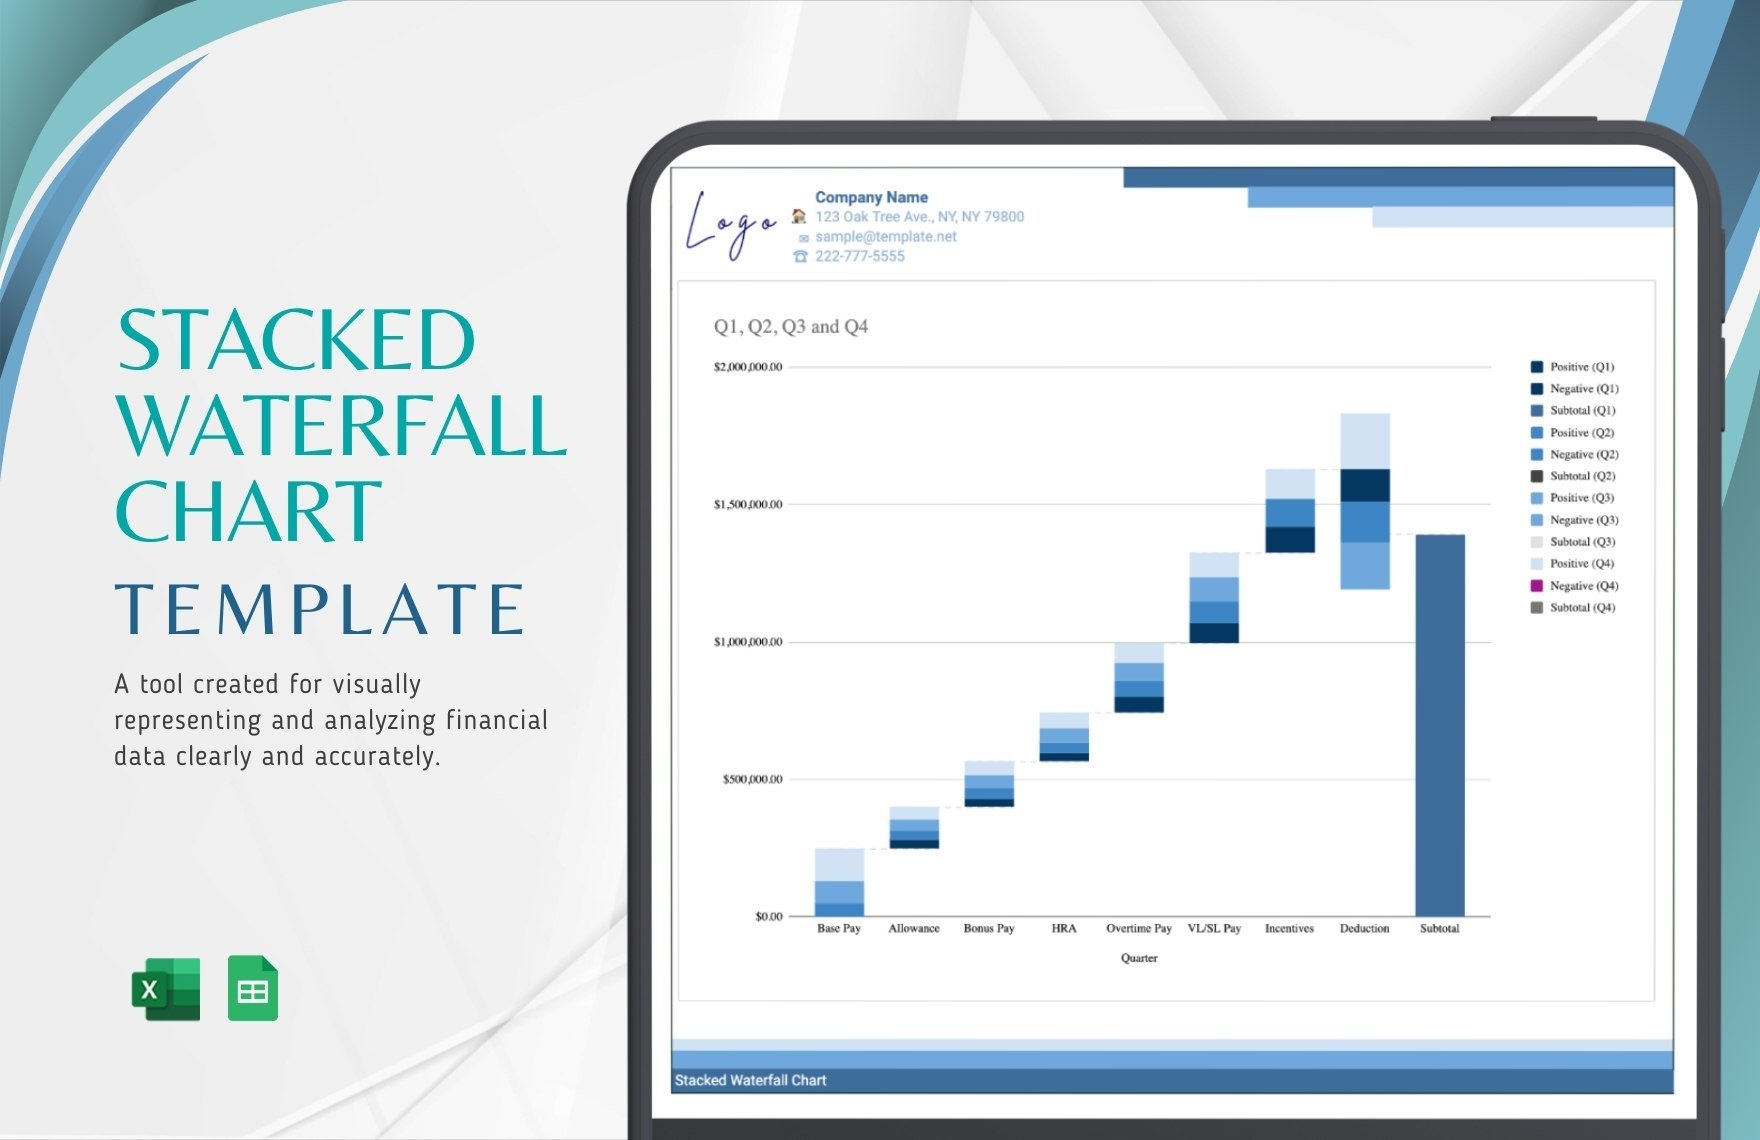
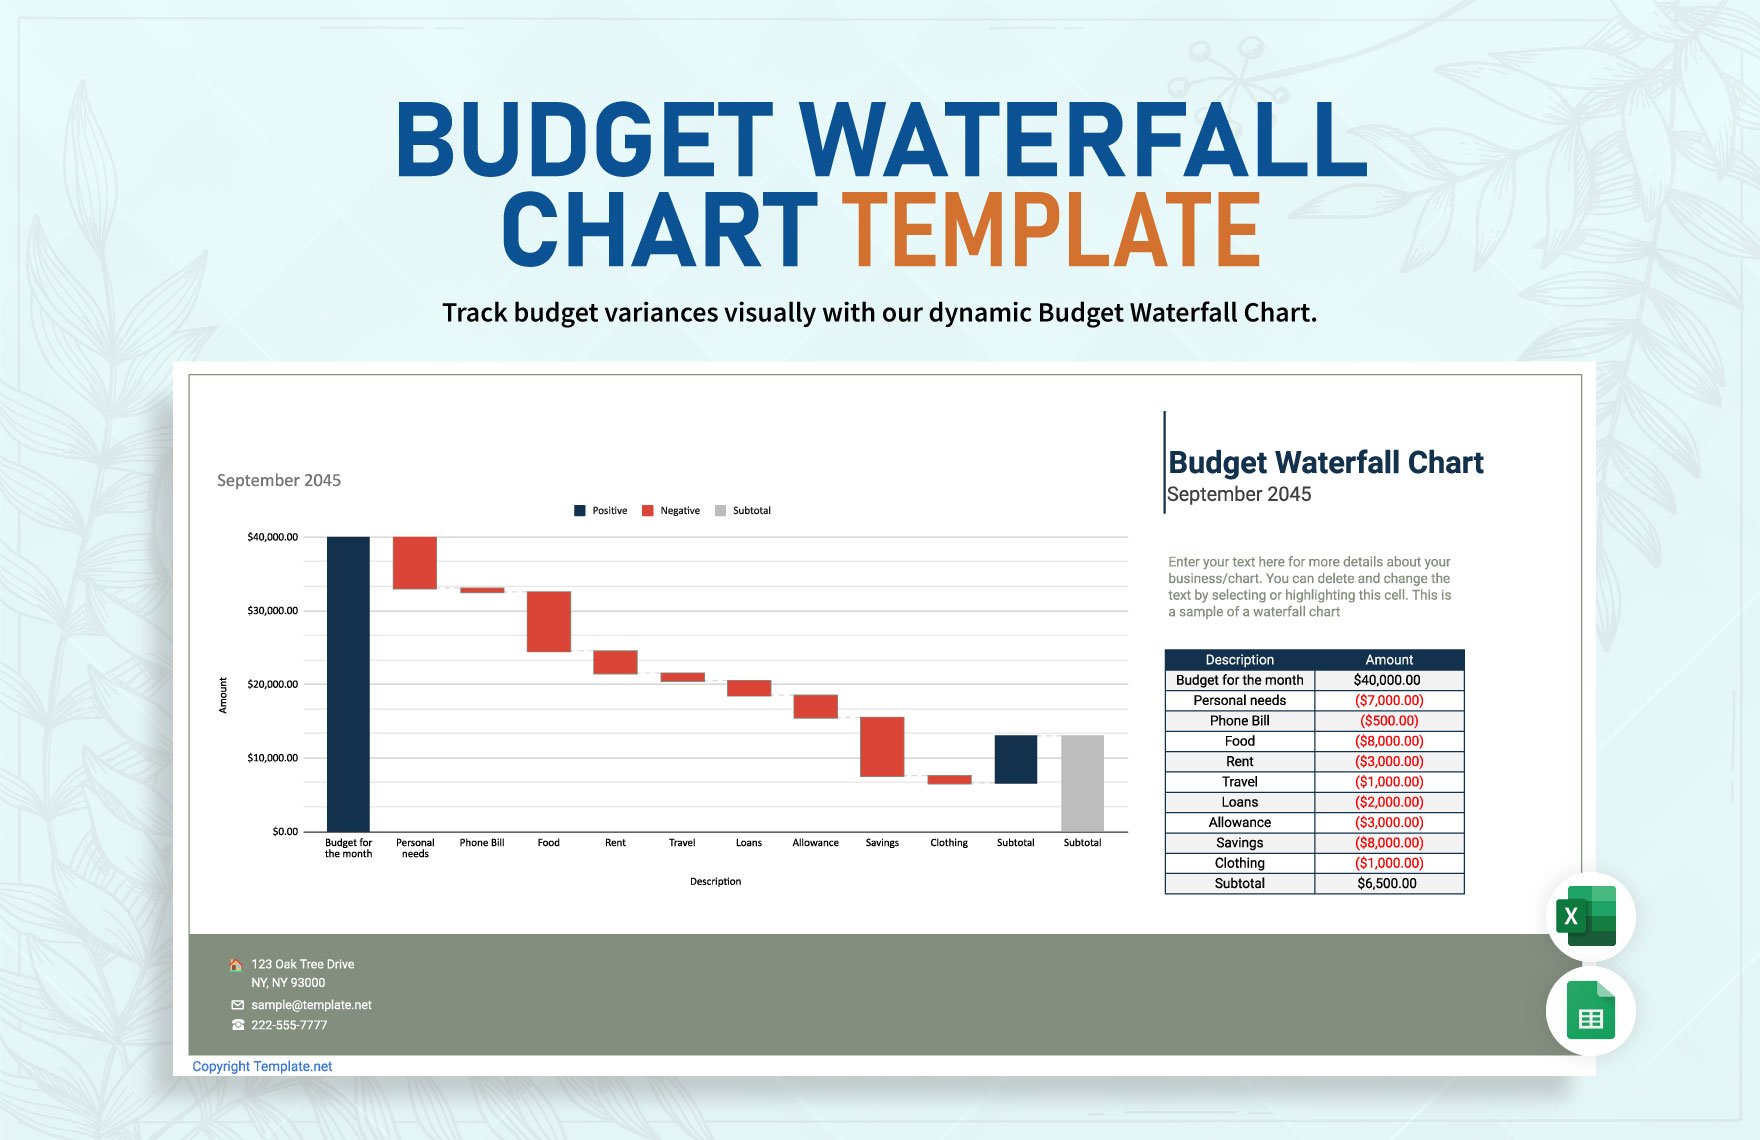
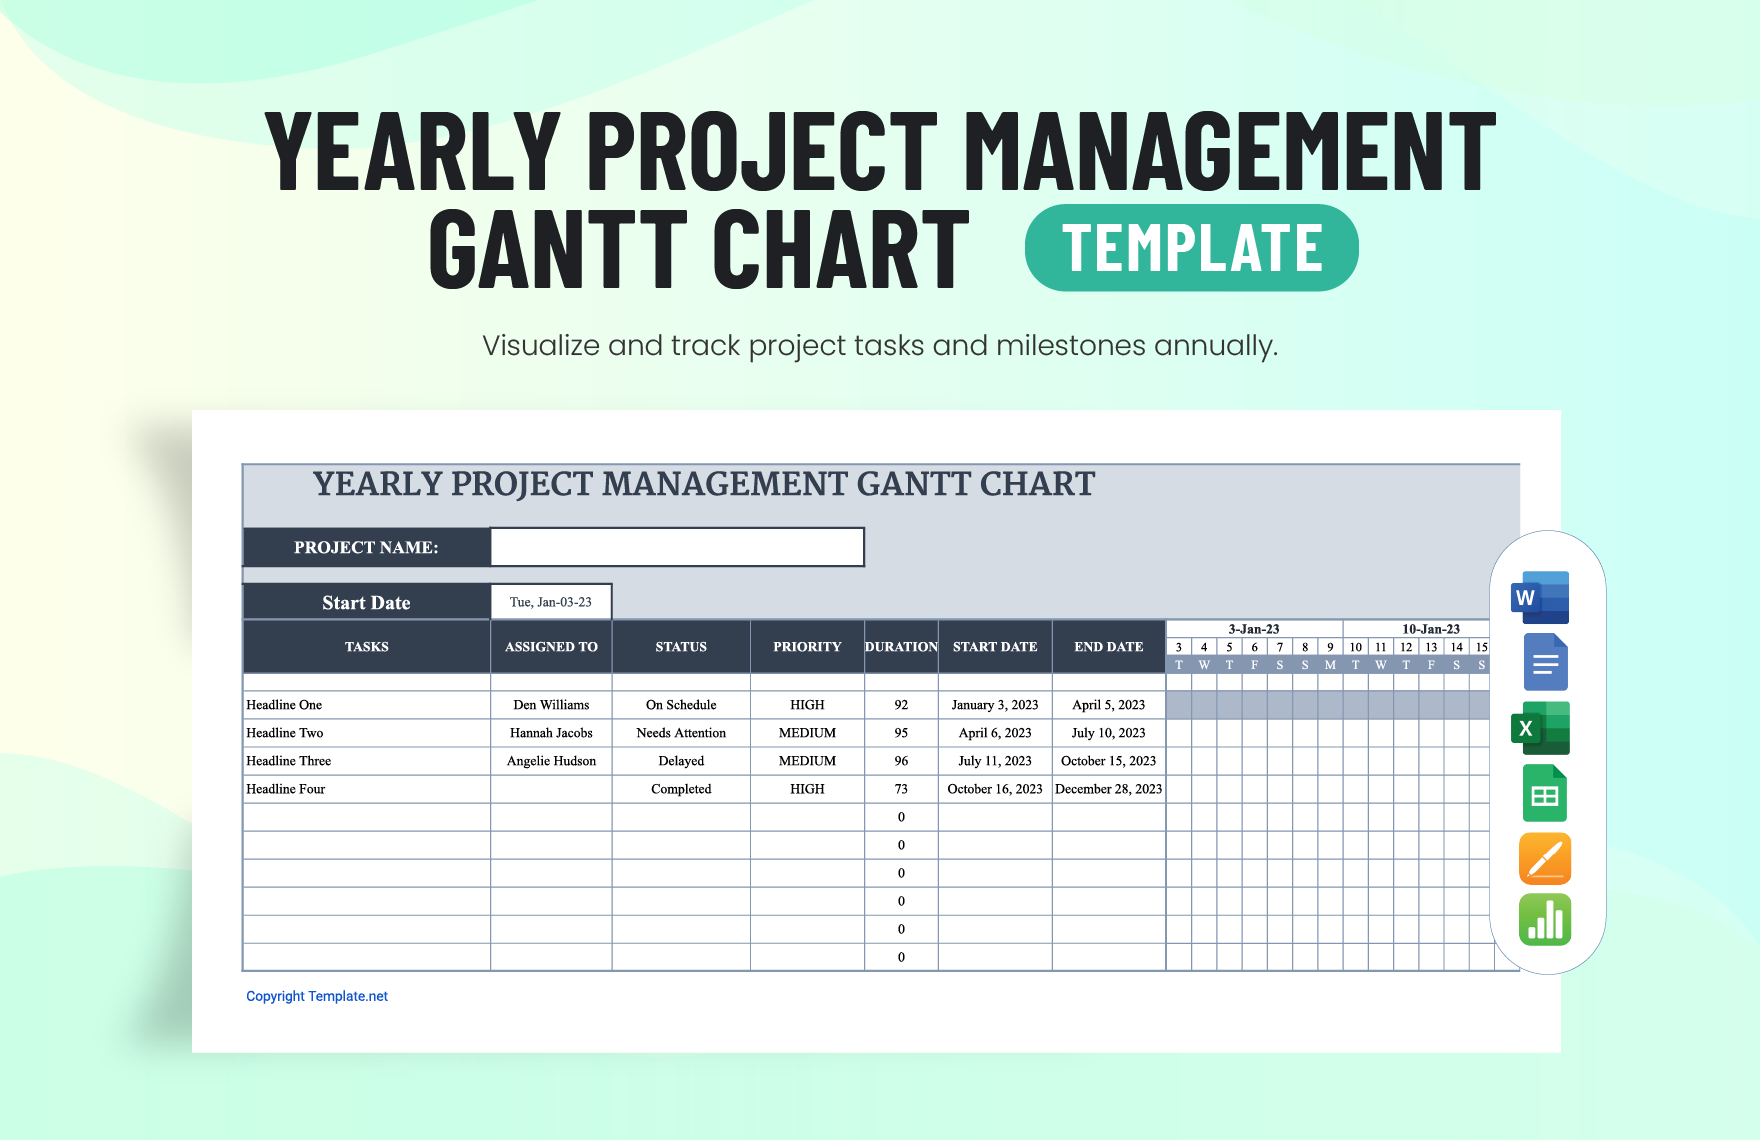
Are you afraid that you might not be able to achieve your desired design for your chart? Worry no more for we can help you make it in time. We offer you our high-quality Editable Chart Templates that are easily-editable and 100% customizable in Google Sheets. The images of these chart templates are royalty-free, so you can freely use them for any of your projects. Our templates are not just functional; they are also visually pleasing, thus providing a visual advantage over mediocre-looking charts. So what are you waiting for? Go on and download our ready-made Editable Chart Templates in Google Sheets right now!
How To Create An Editable Chart In Google Sheets?
An editable chart is just like any chart that we're familiar with. The only difference is that it's created with the use of a template or sample that you can freely edit. A chart, in general, serves a lot of purposes, more specifically for personal-use and business-use. The primary purpose of a chart is that it showcases information regarding a data comparison, a work process flow, a guide of a company's organizational hierarchy, a personal work schedule, and so much more. Moving on, we have gathered a few basic tips below that might help you to create a chart for whatever purpose.
1. Opt To Use Google Sheets
Almost any editing software, such as Apple Numbers and MS Excel, is fully capable of creating a chart, whether a simple one or a dynamic one. However, we encourage you to use Google Sheets. Why so? If you look at the interface of Google Sheets, you'll realize that it's already one giant chart. Hence, you can expect to create any chart you want with it. You just have to make some adjustments and modifications. Moreover, if you have a Google account, you can access Google Sheets in no time.
2. Be Careful With The Alignments
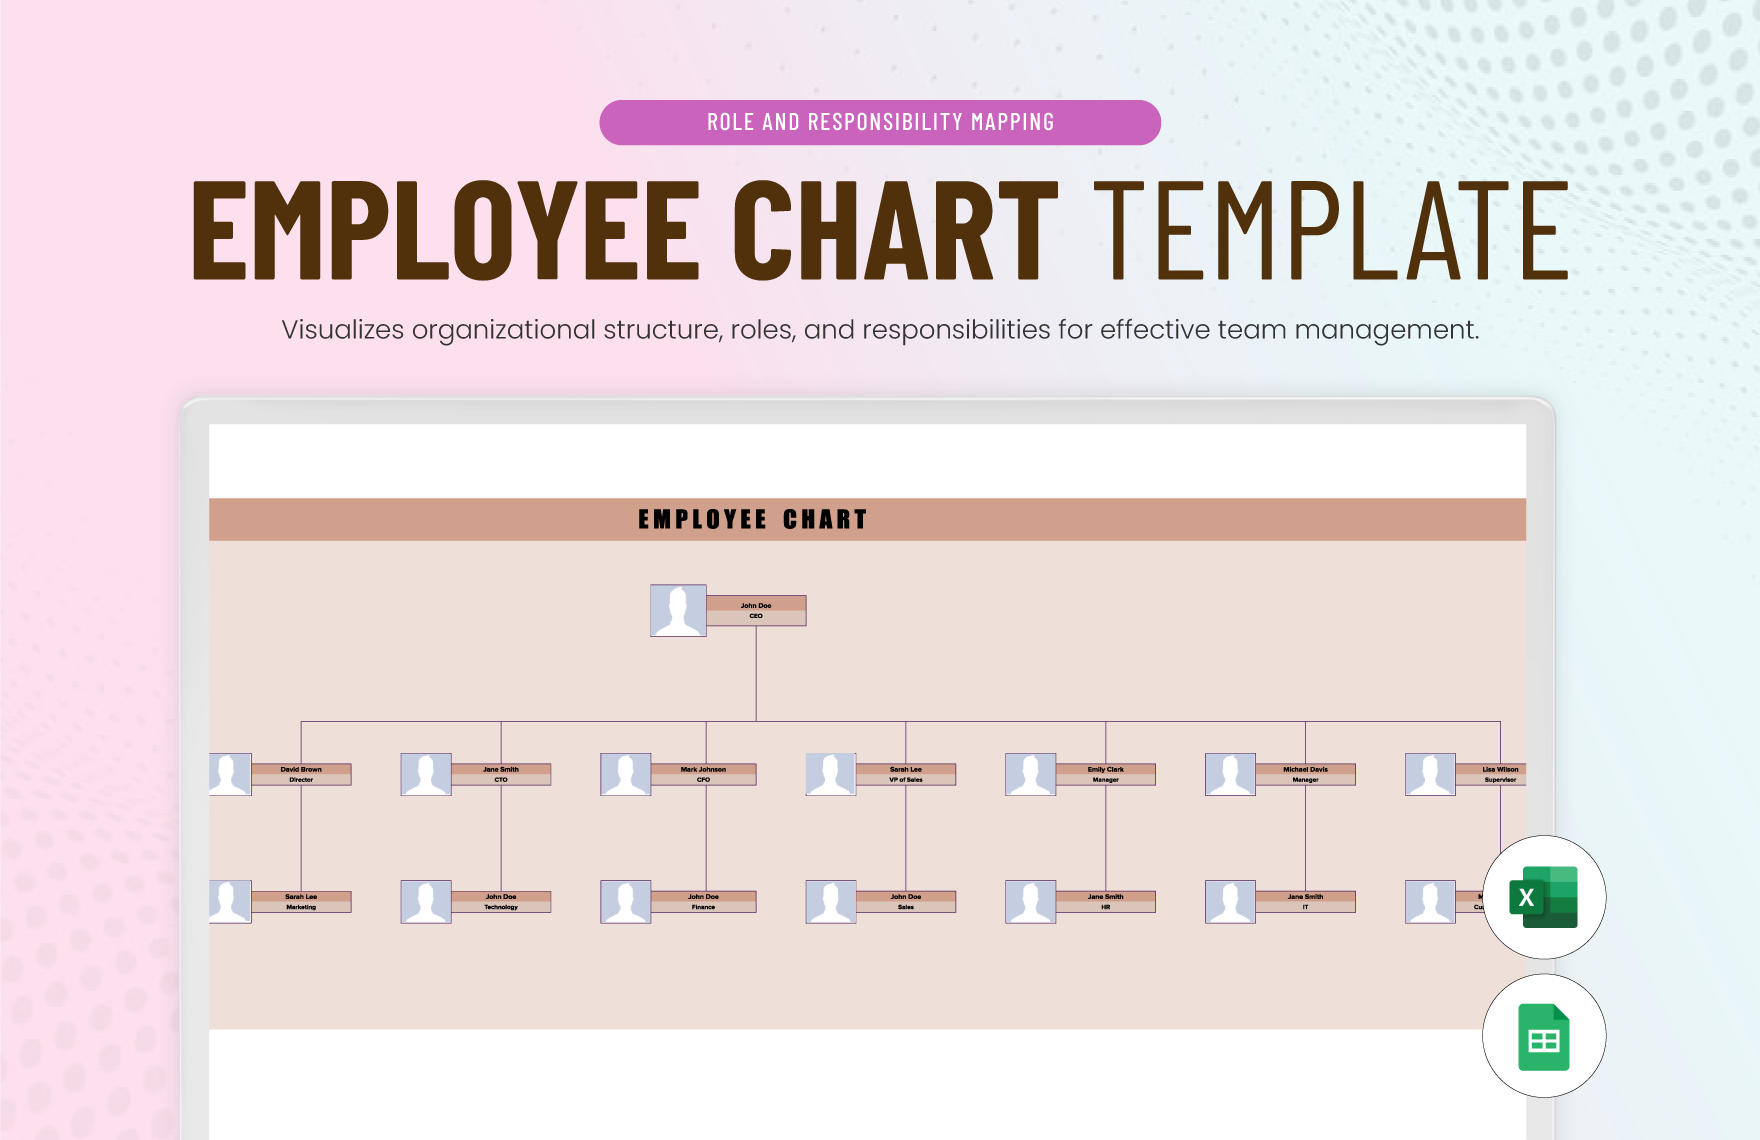
It's expected that a chart will consist of boxes, connecting lines, columns, and rows. Those are the primary components of a chart's physical attributes, and they play a vital role in organizing the information you wish to inject to it. With that in mind, you must be careful with their alignments. To give you an idea of how you must do it, you can view several of our organizational chart templates. You can also use them if ever the chart you're creating is an organizational chart.
3. Gather Every Needed Data
Before you can start injecting contents on your chart, you must first gather every data you need. This approach is more applicable if your chart's purpose is business-related. What you will likely gather are business reports, project progress reports, and status reports.
4. Insert The Gathered Data Accordingly
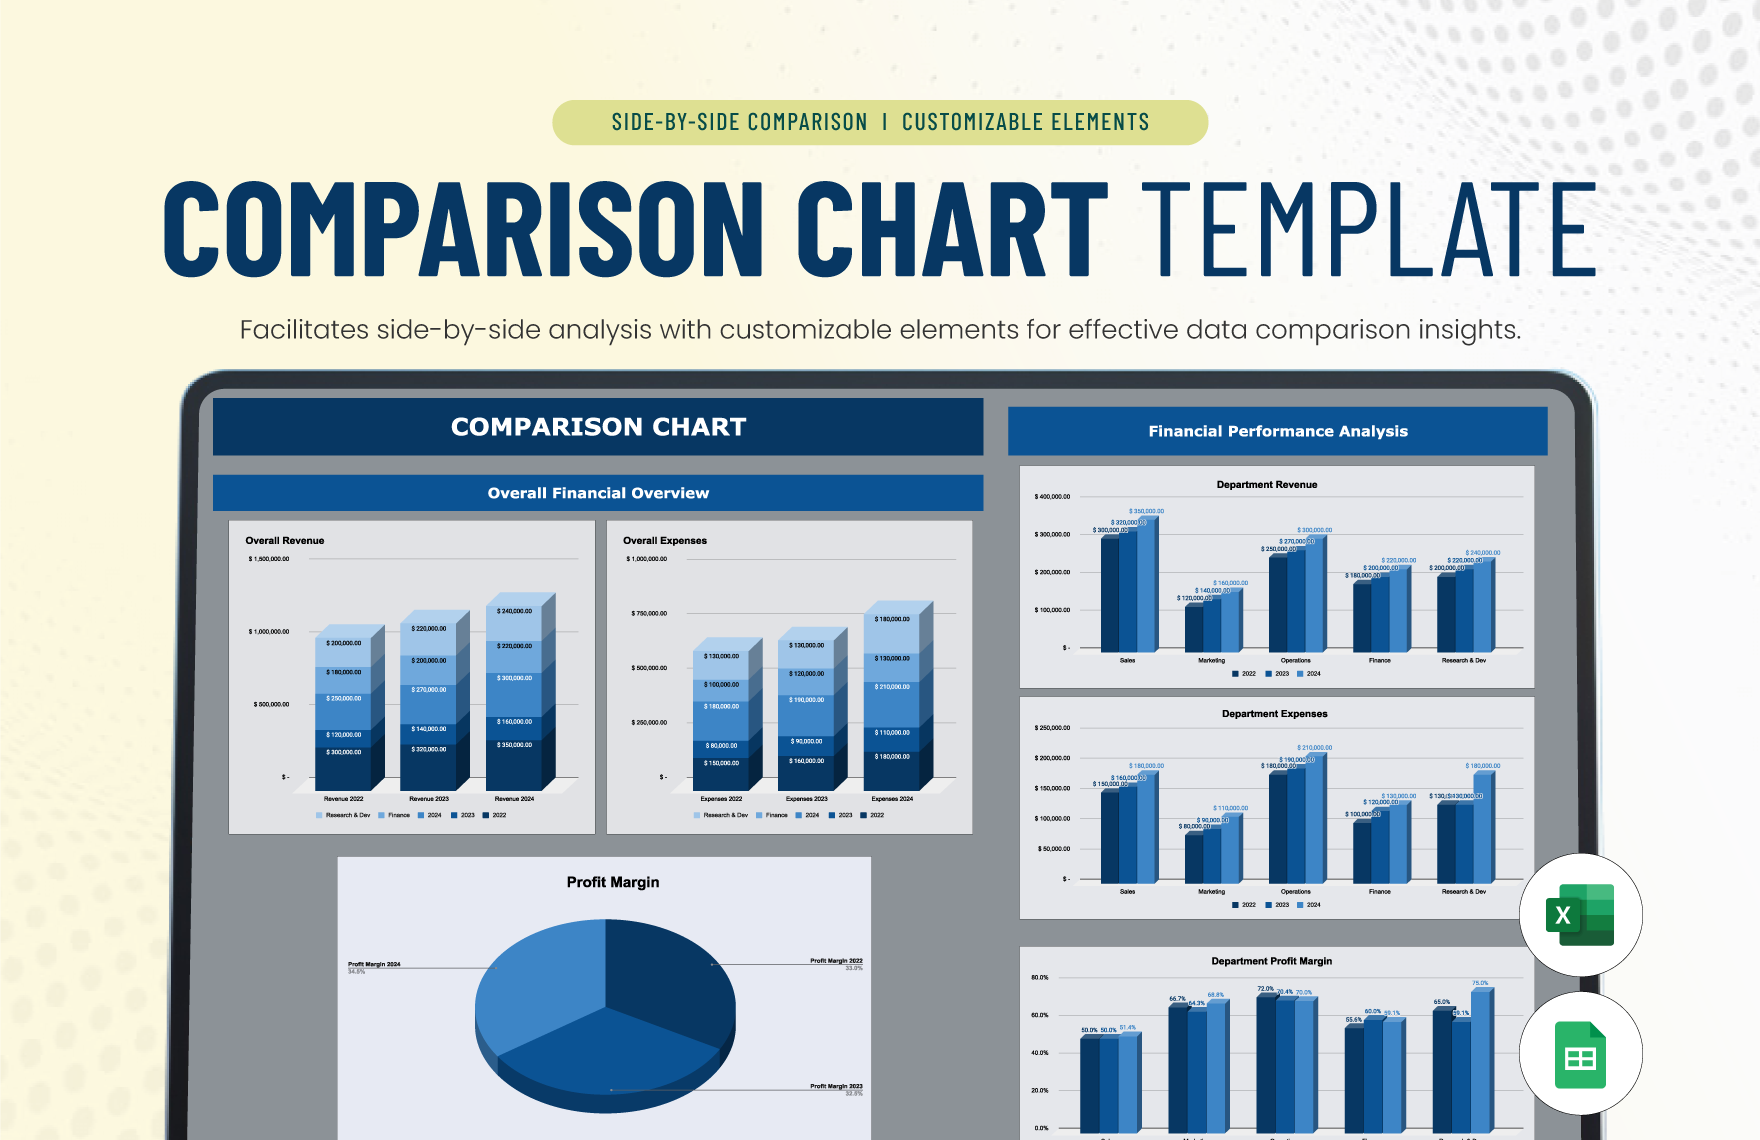
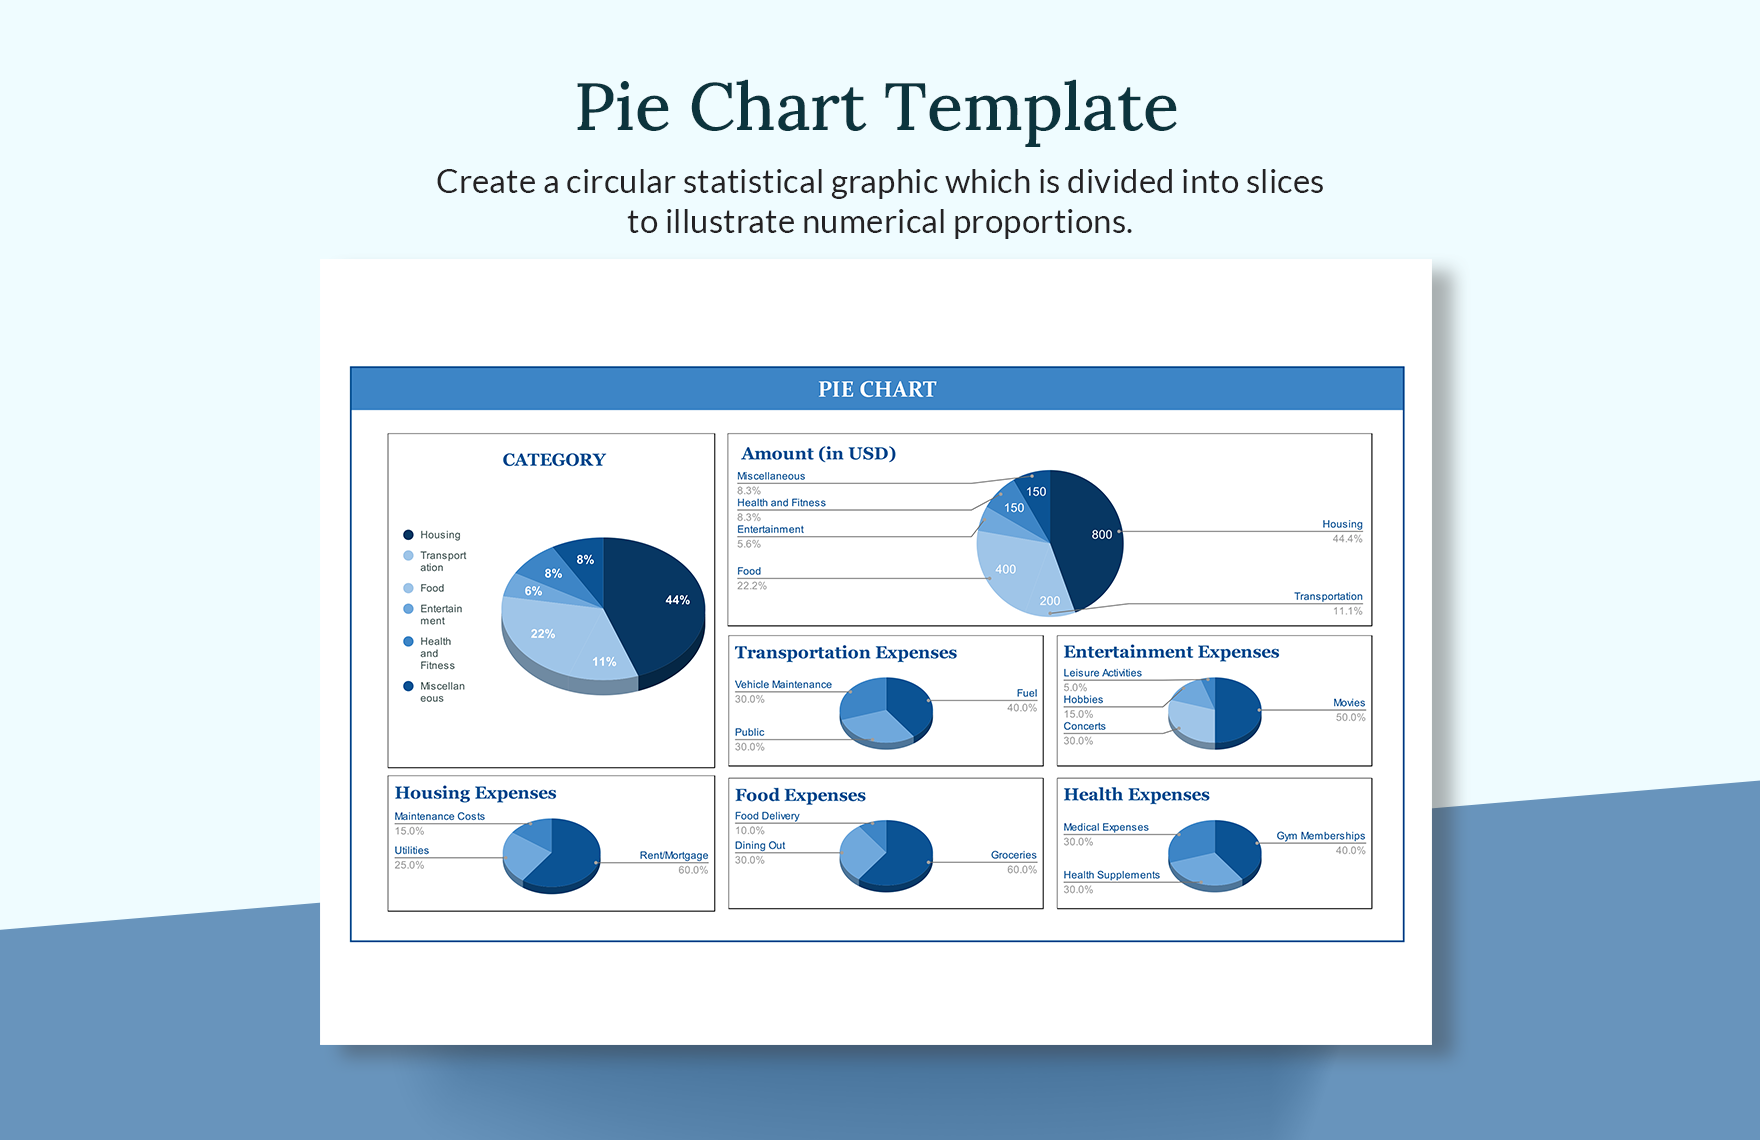
Once you've gathered all the data you need, you can now start injecting them on your chart. You must do it in a way that they're showcased comprehensively. For instance, if you the chart you're making is a timeline chart, you must put every data in chronological order based on the time of its occurrence. Another instance, if what you're making is a comparison of data, you must present them conceivably. For data comparisons, pie charts are the best tool.
5. Use Chart Templates
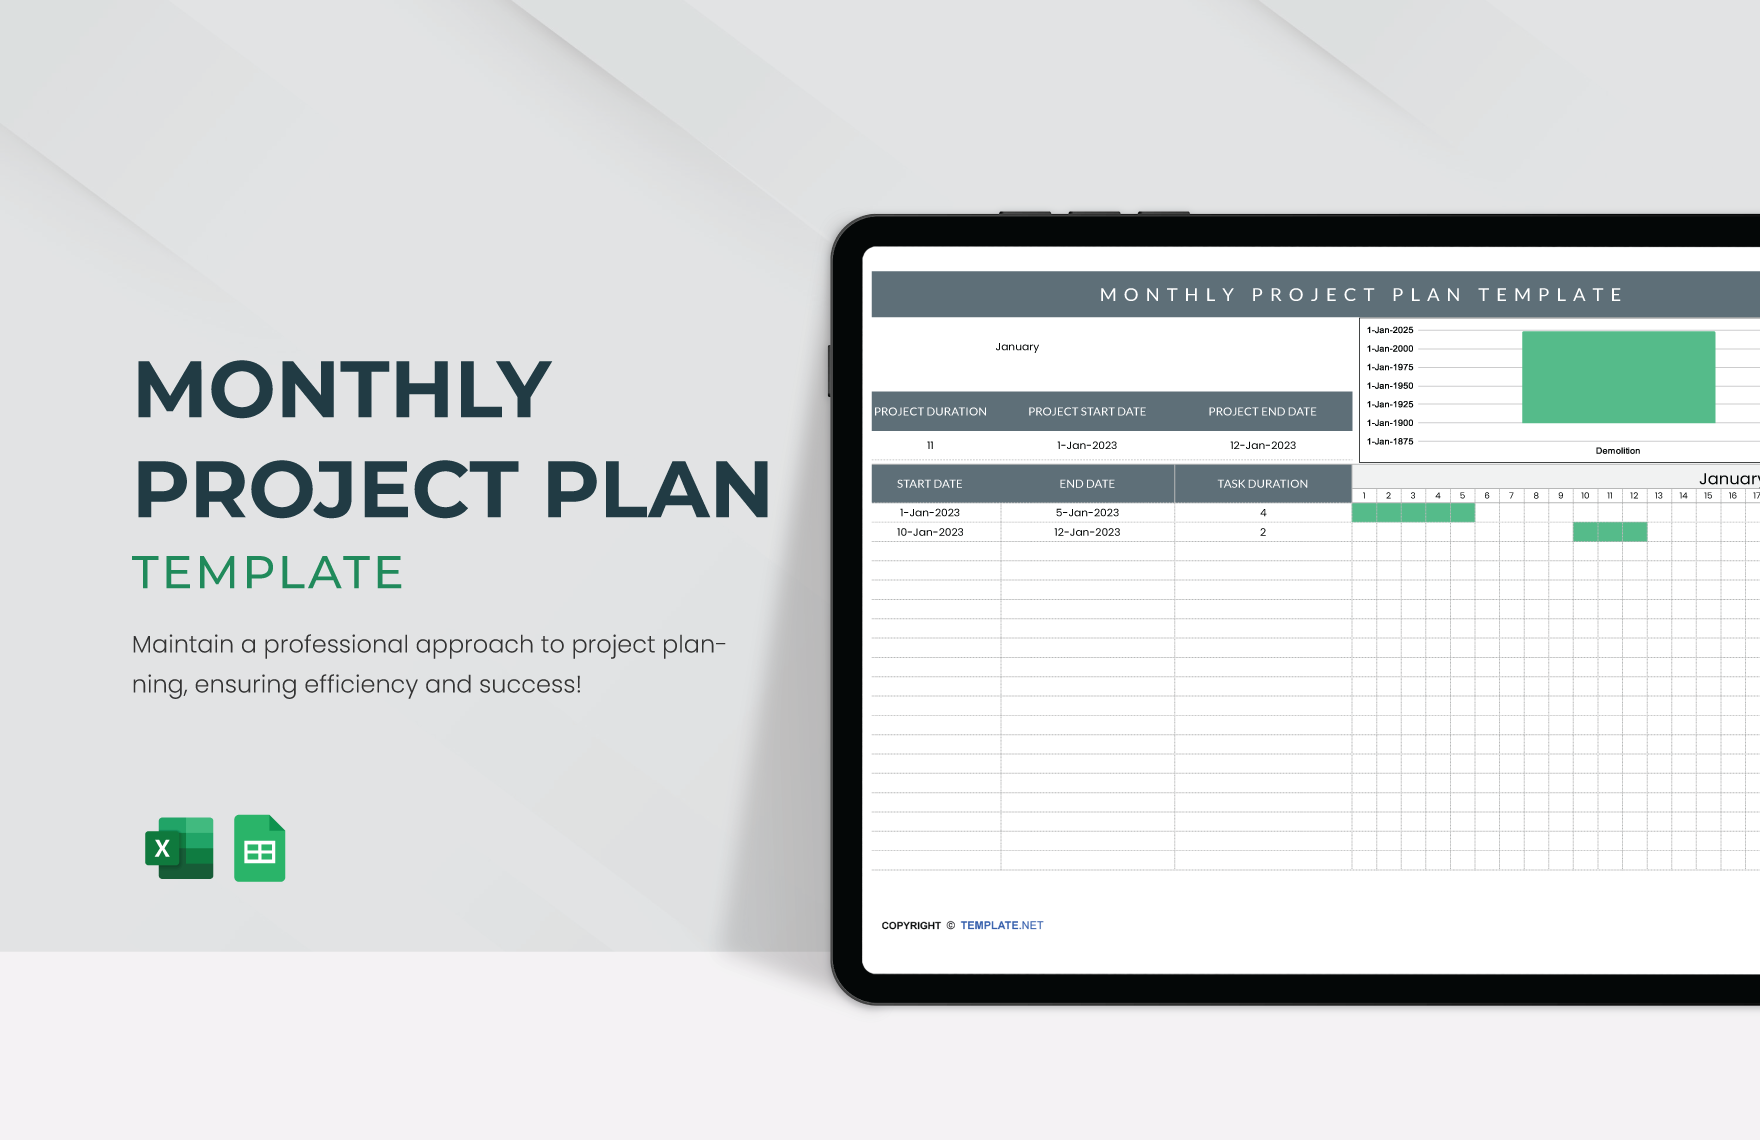
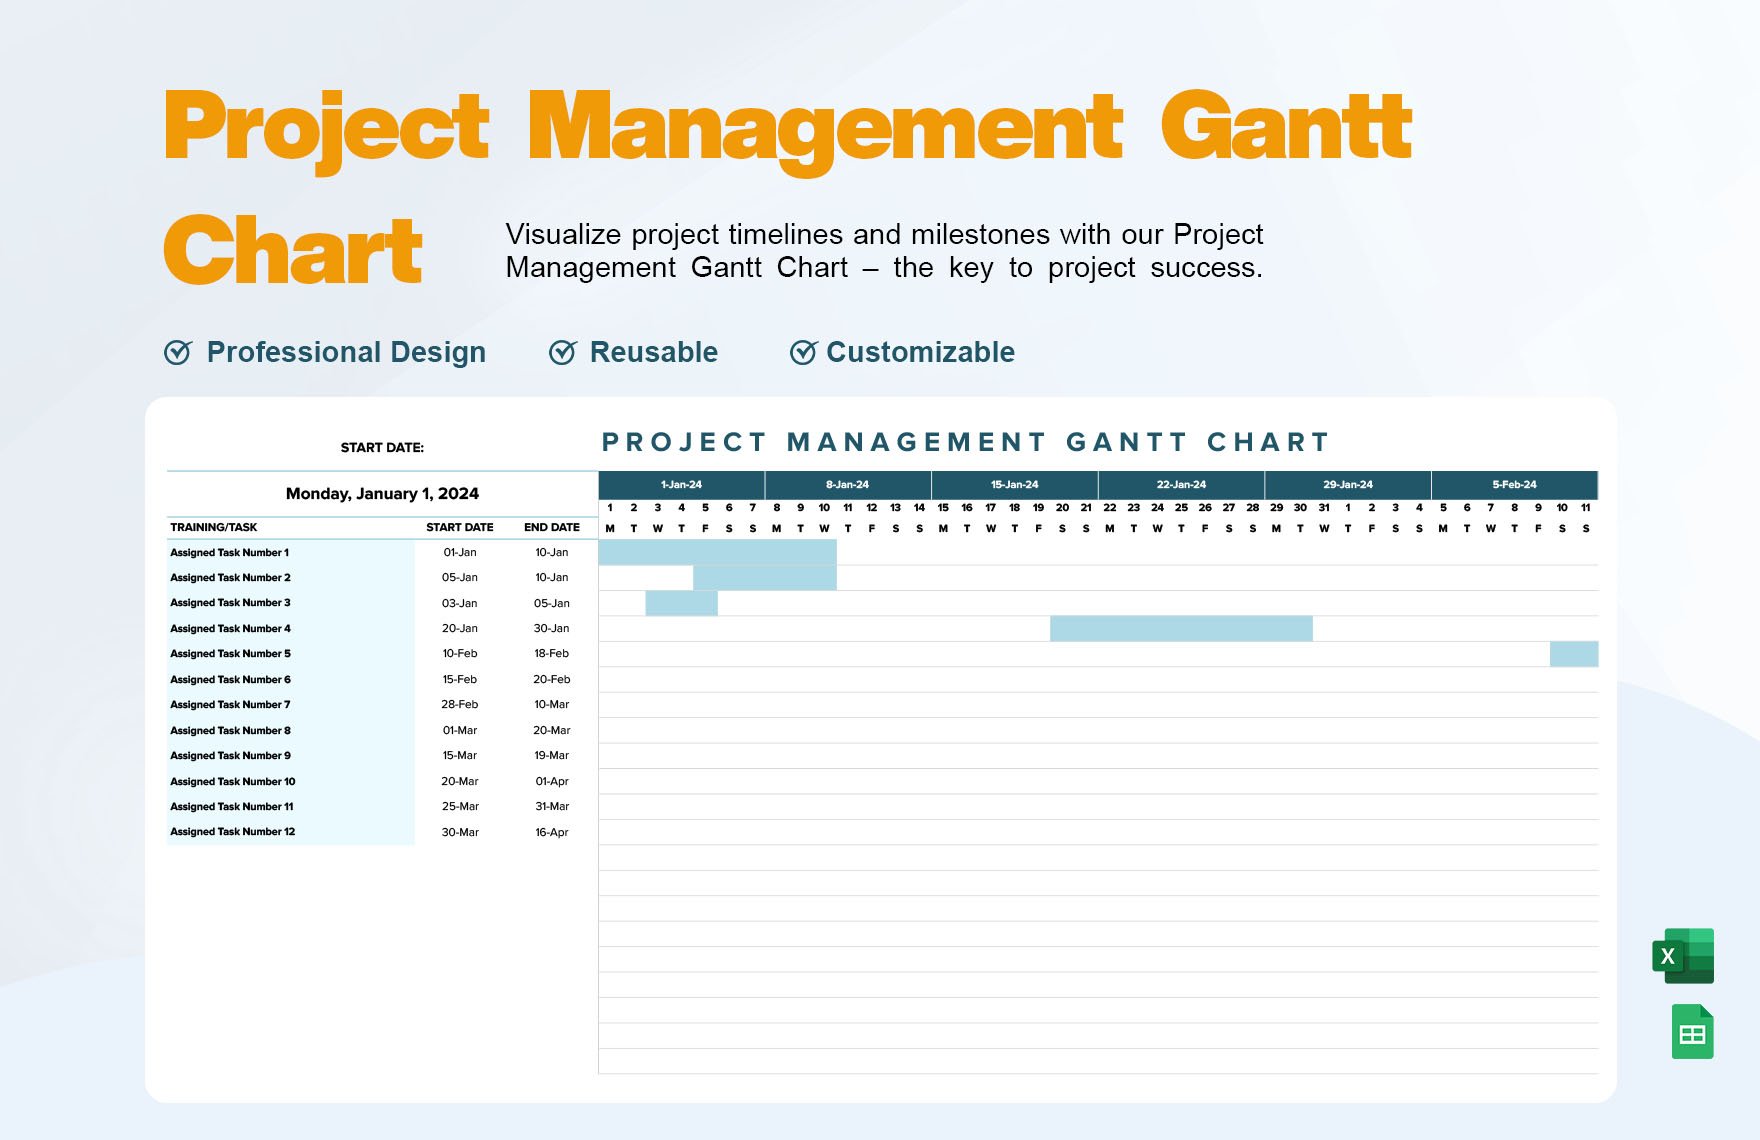
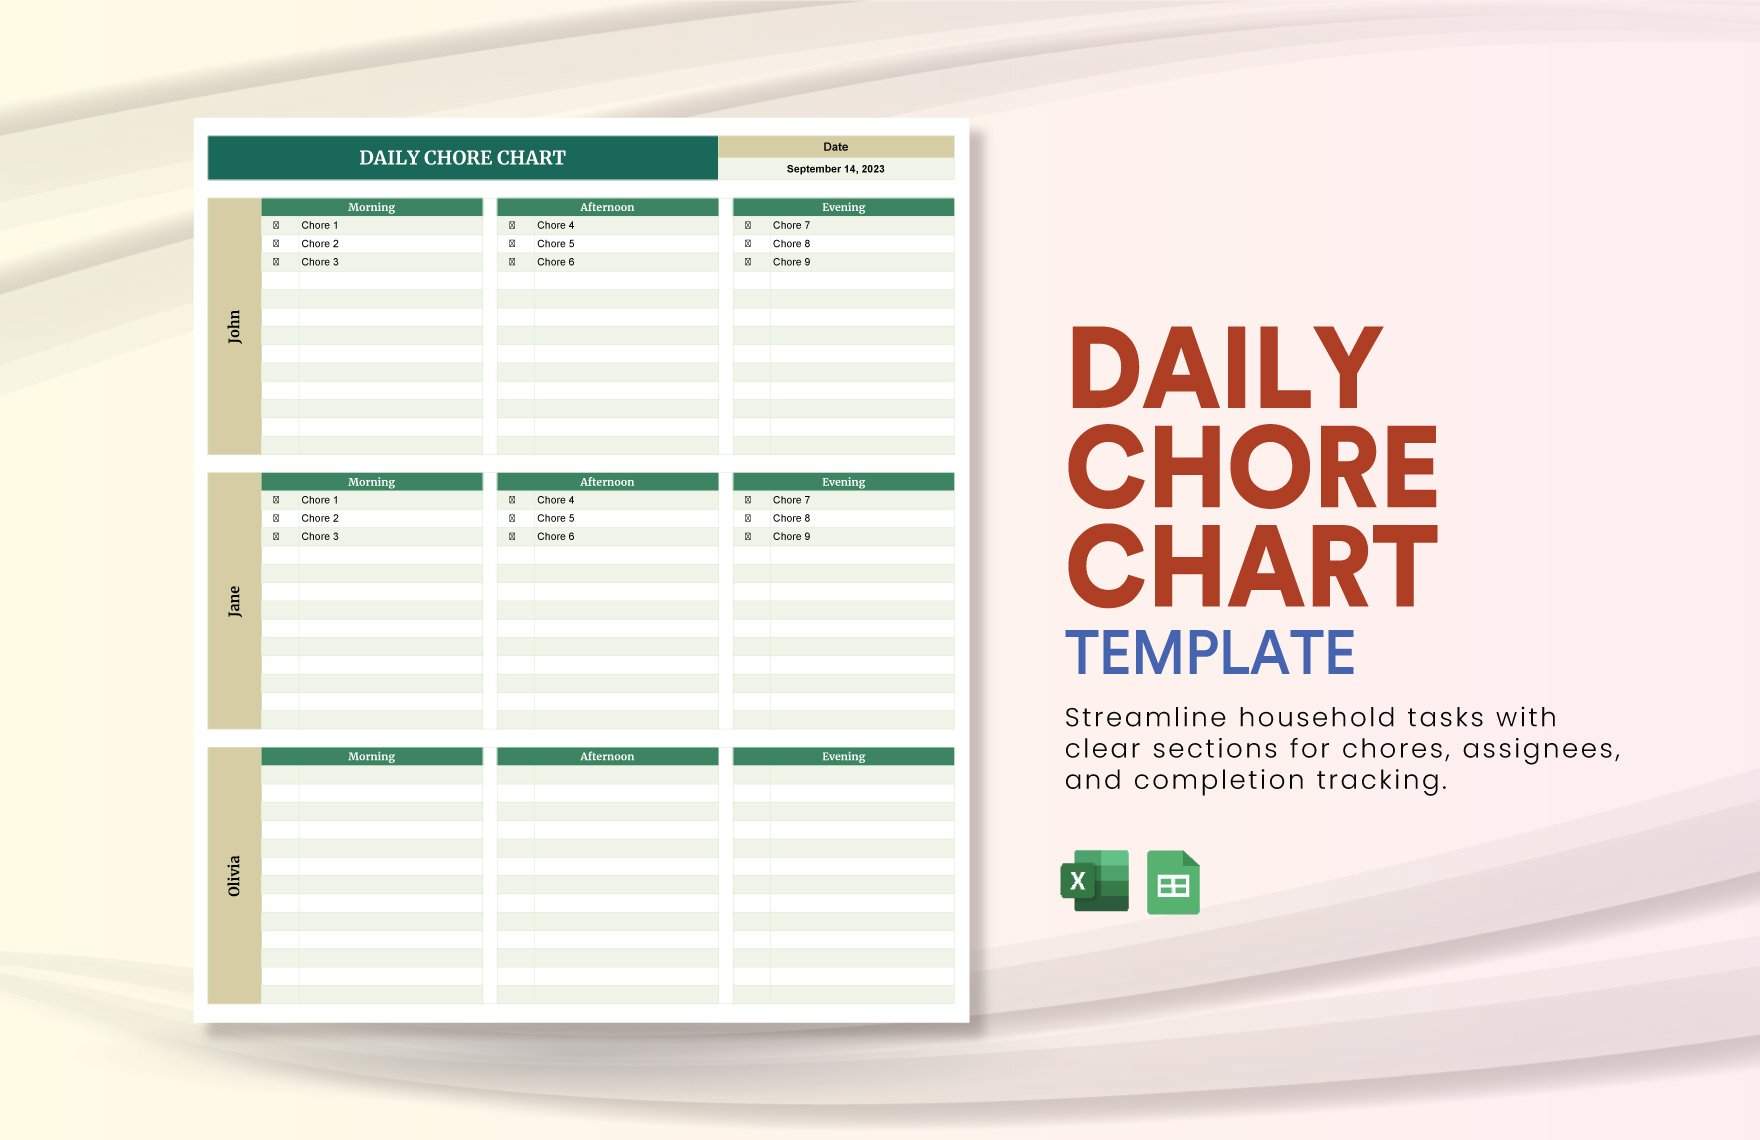
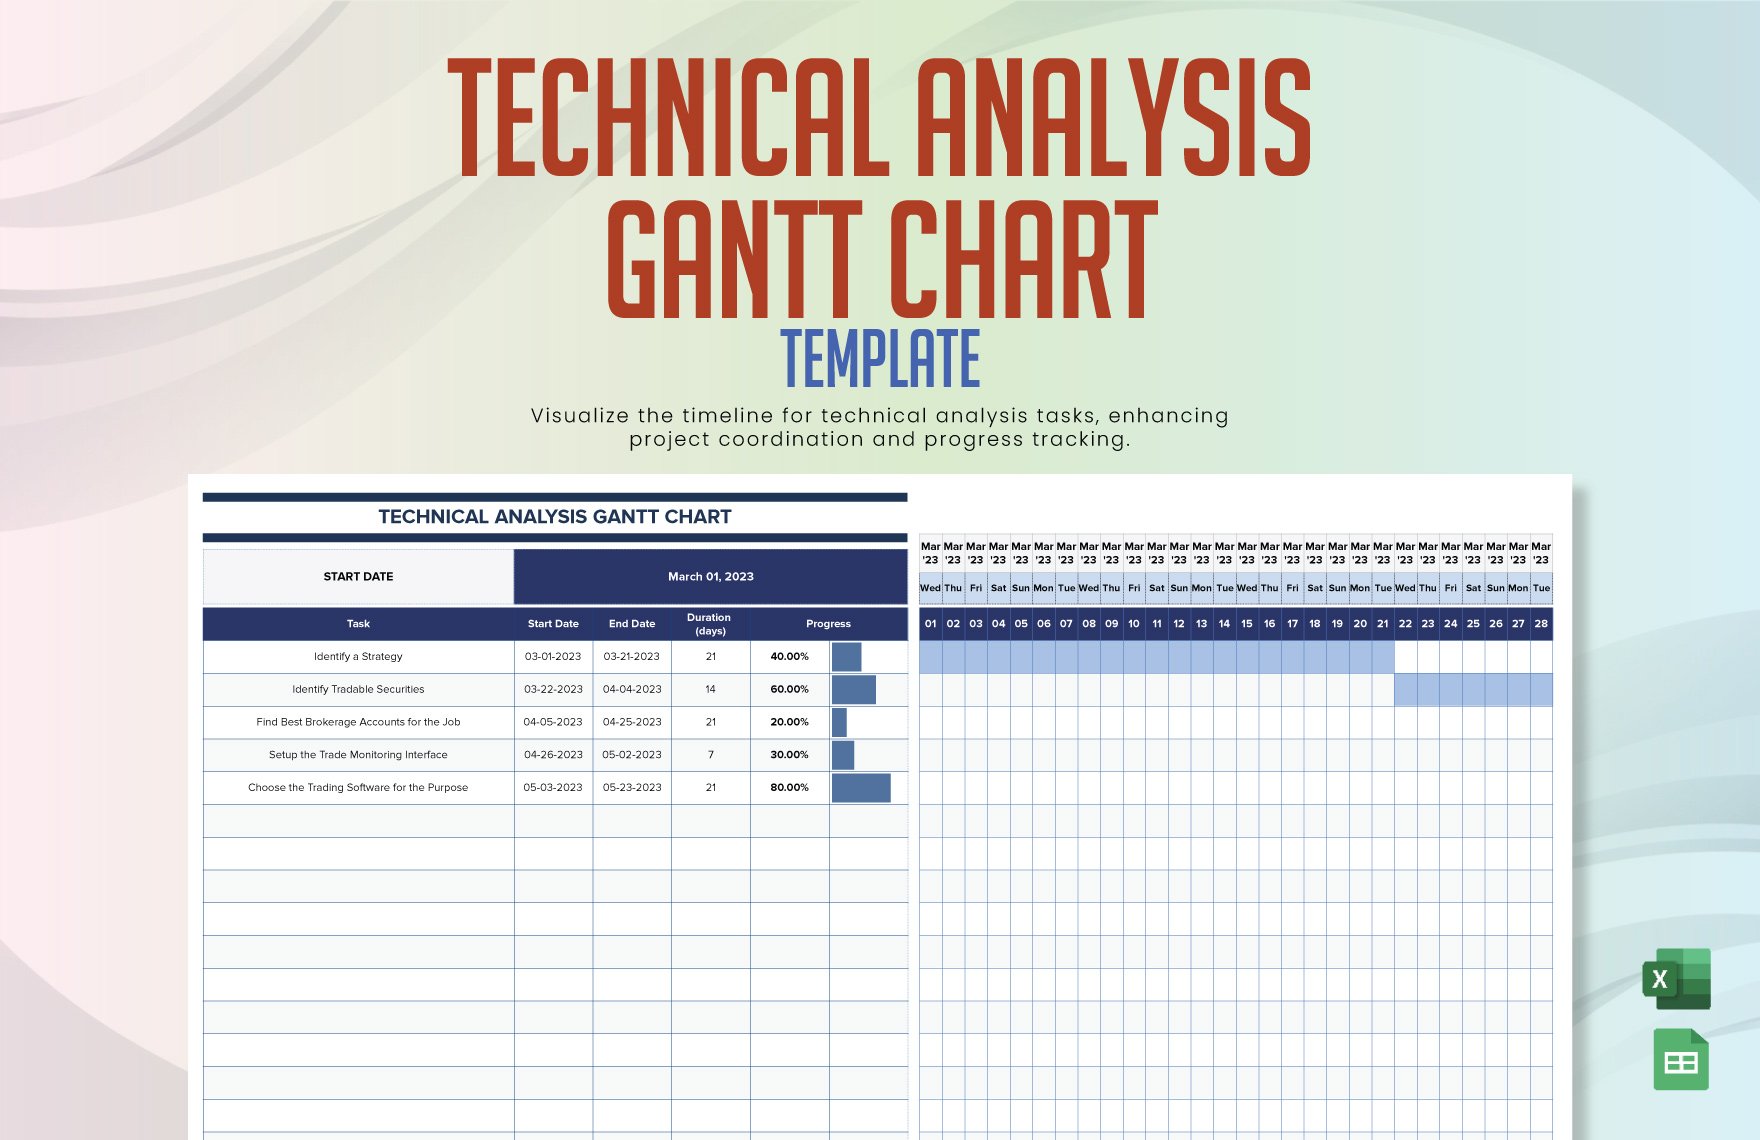
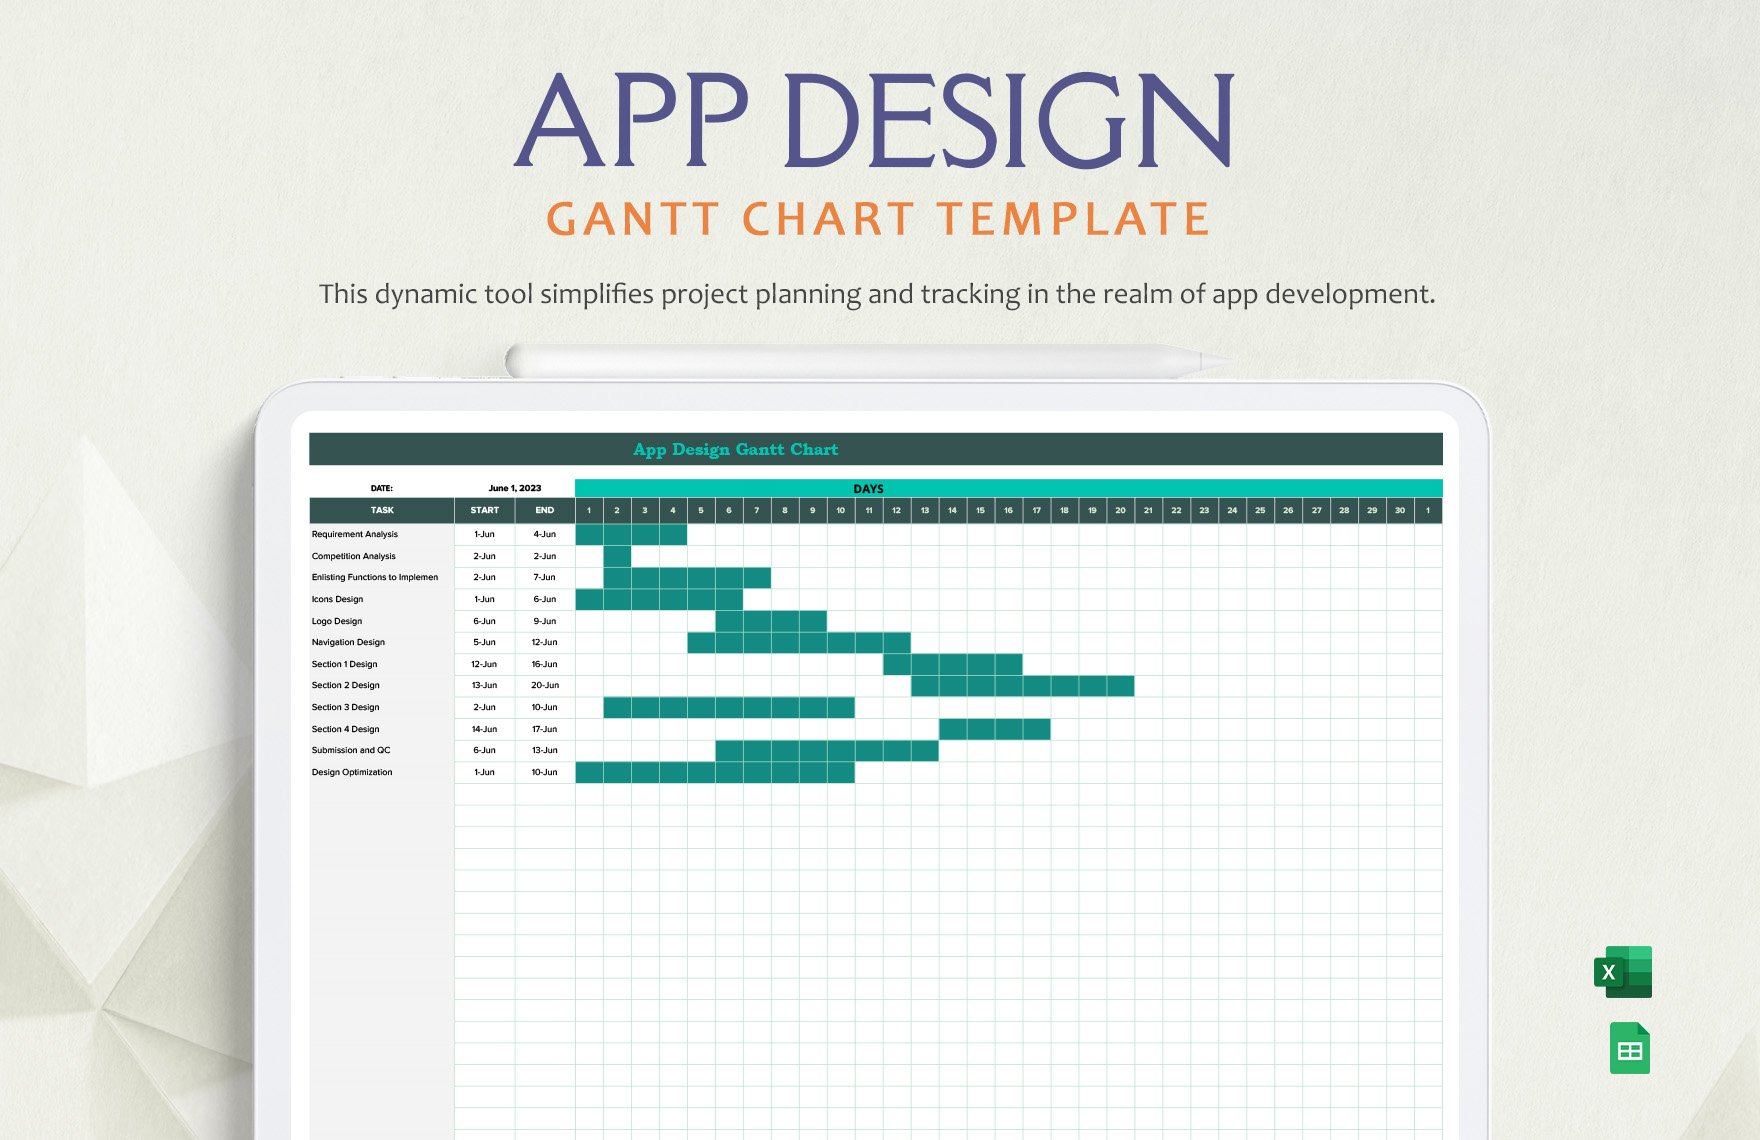
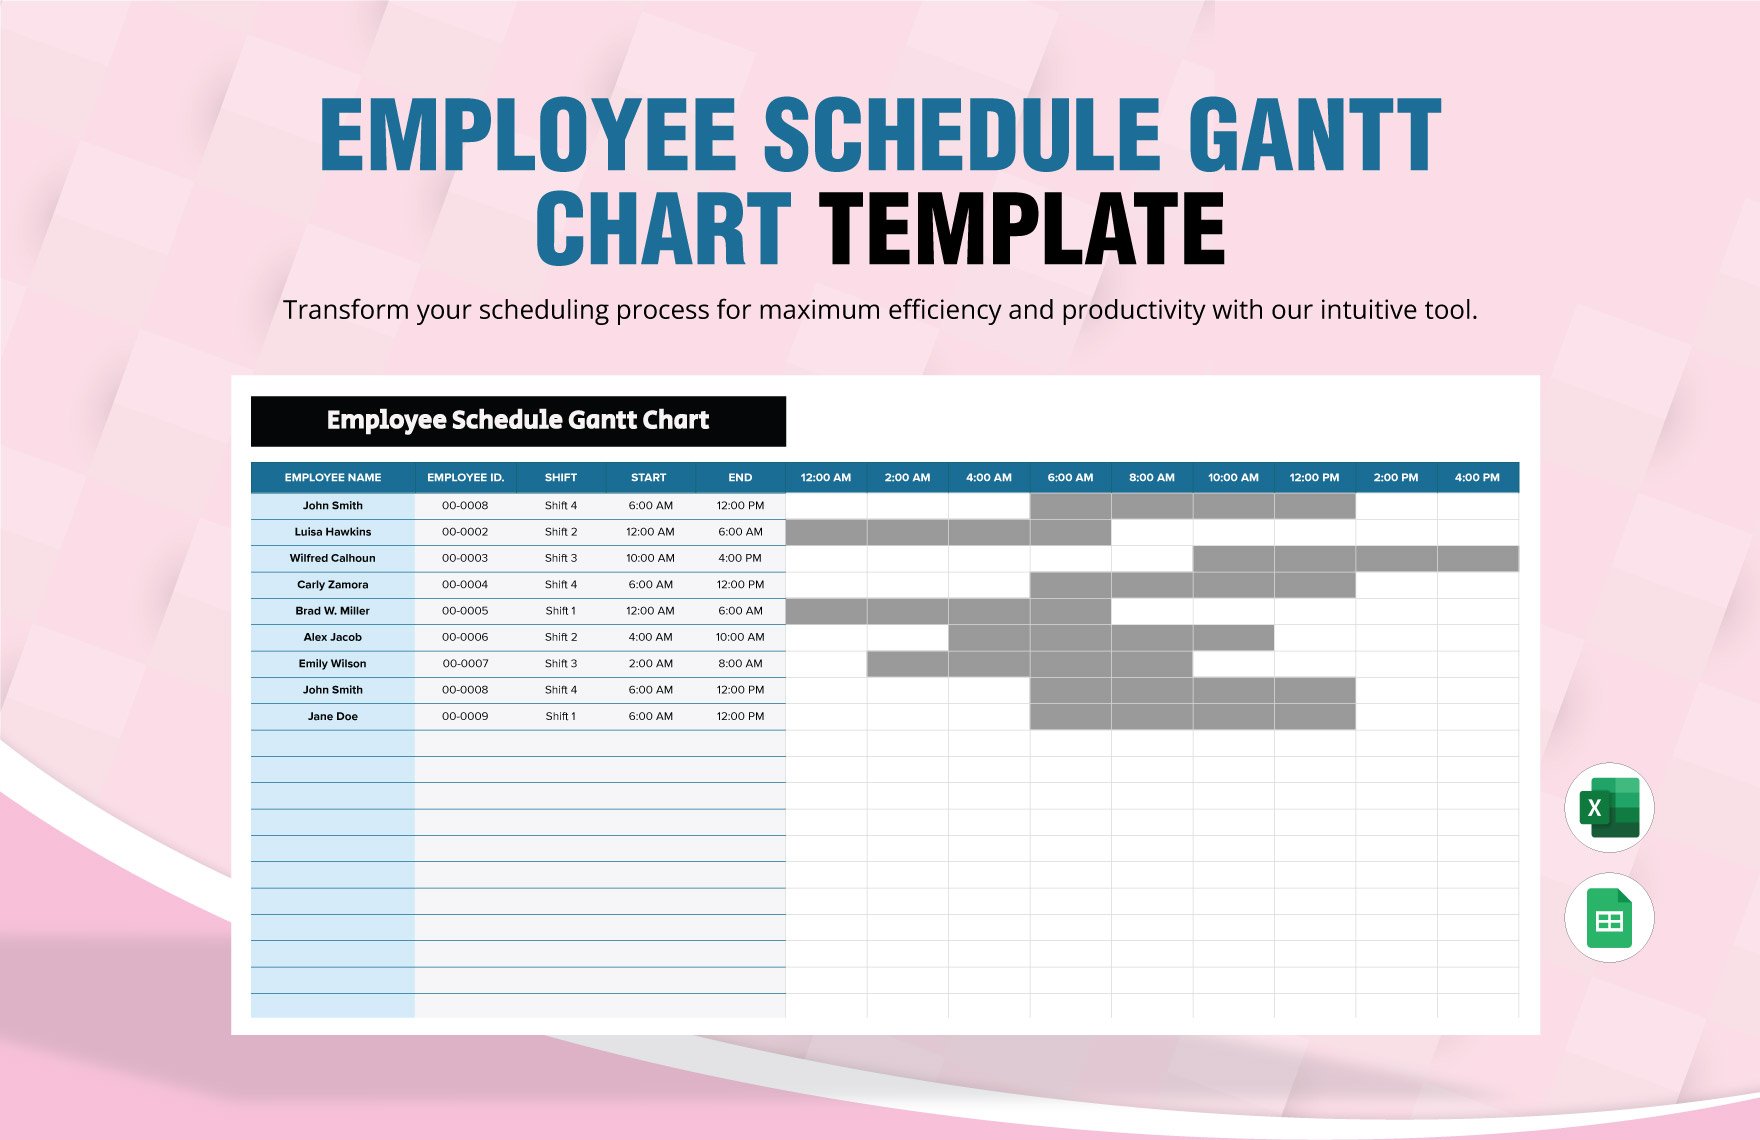
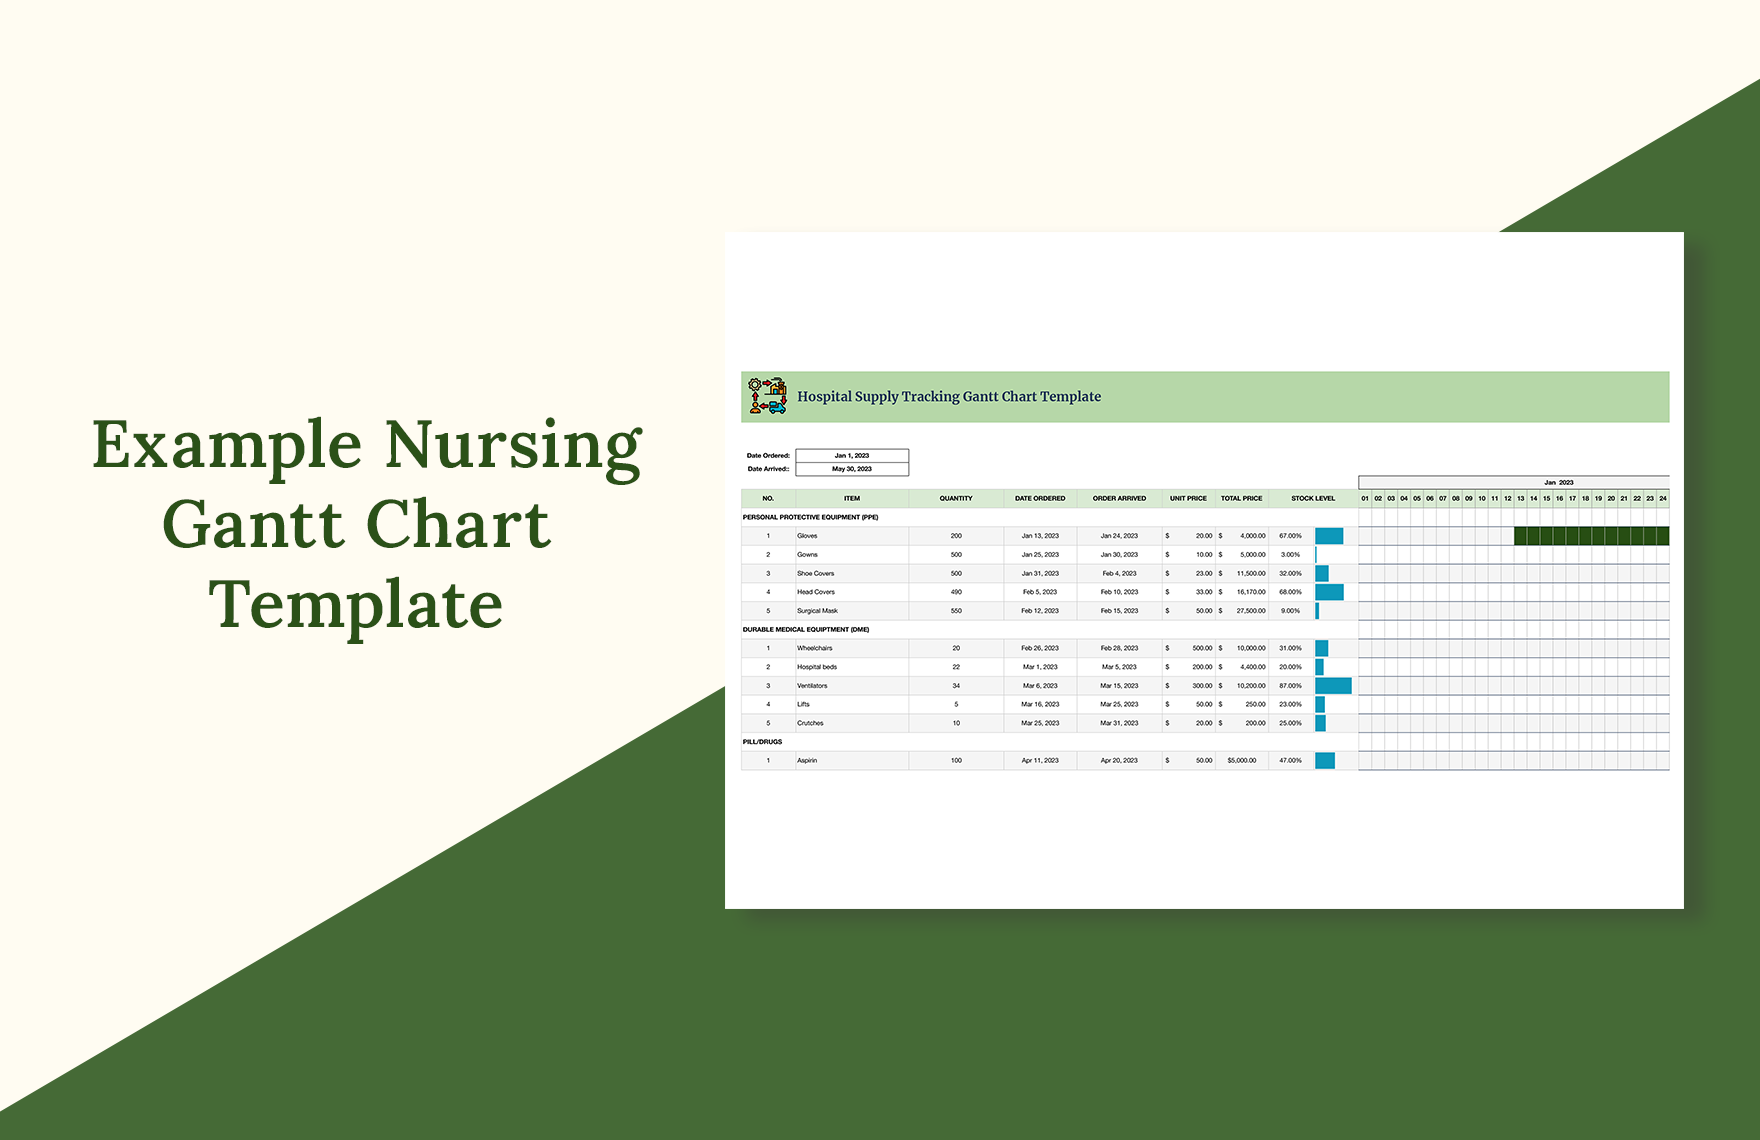
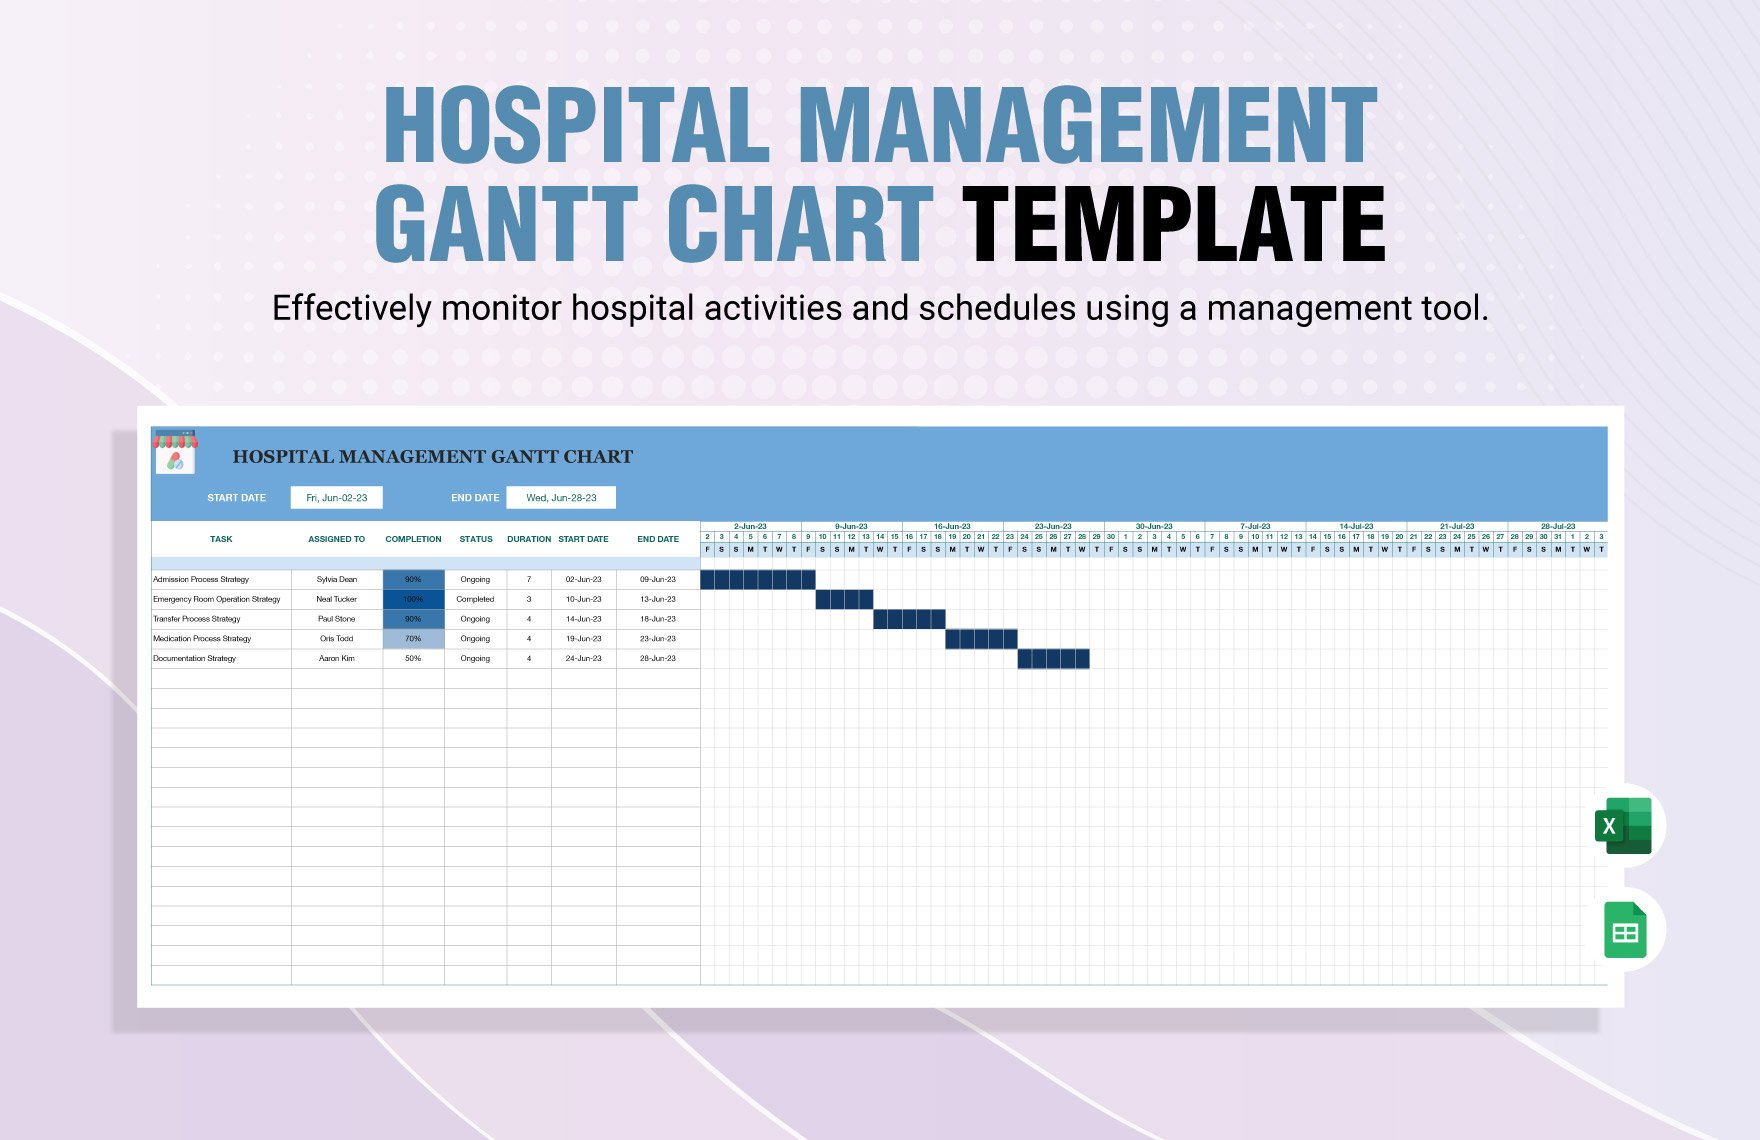
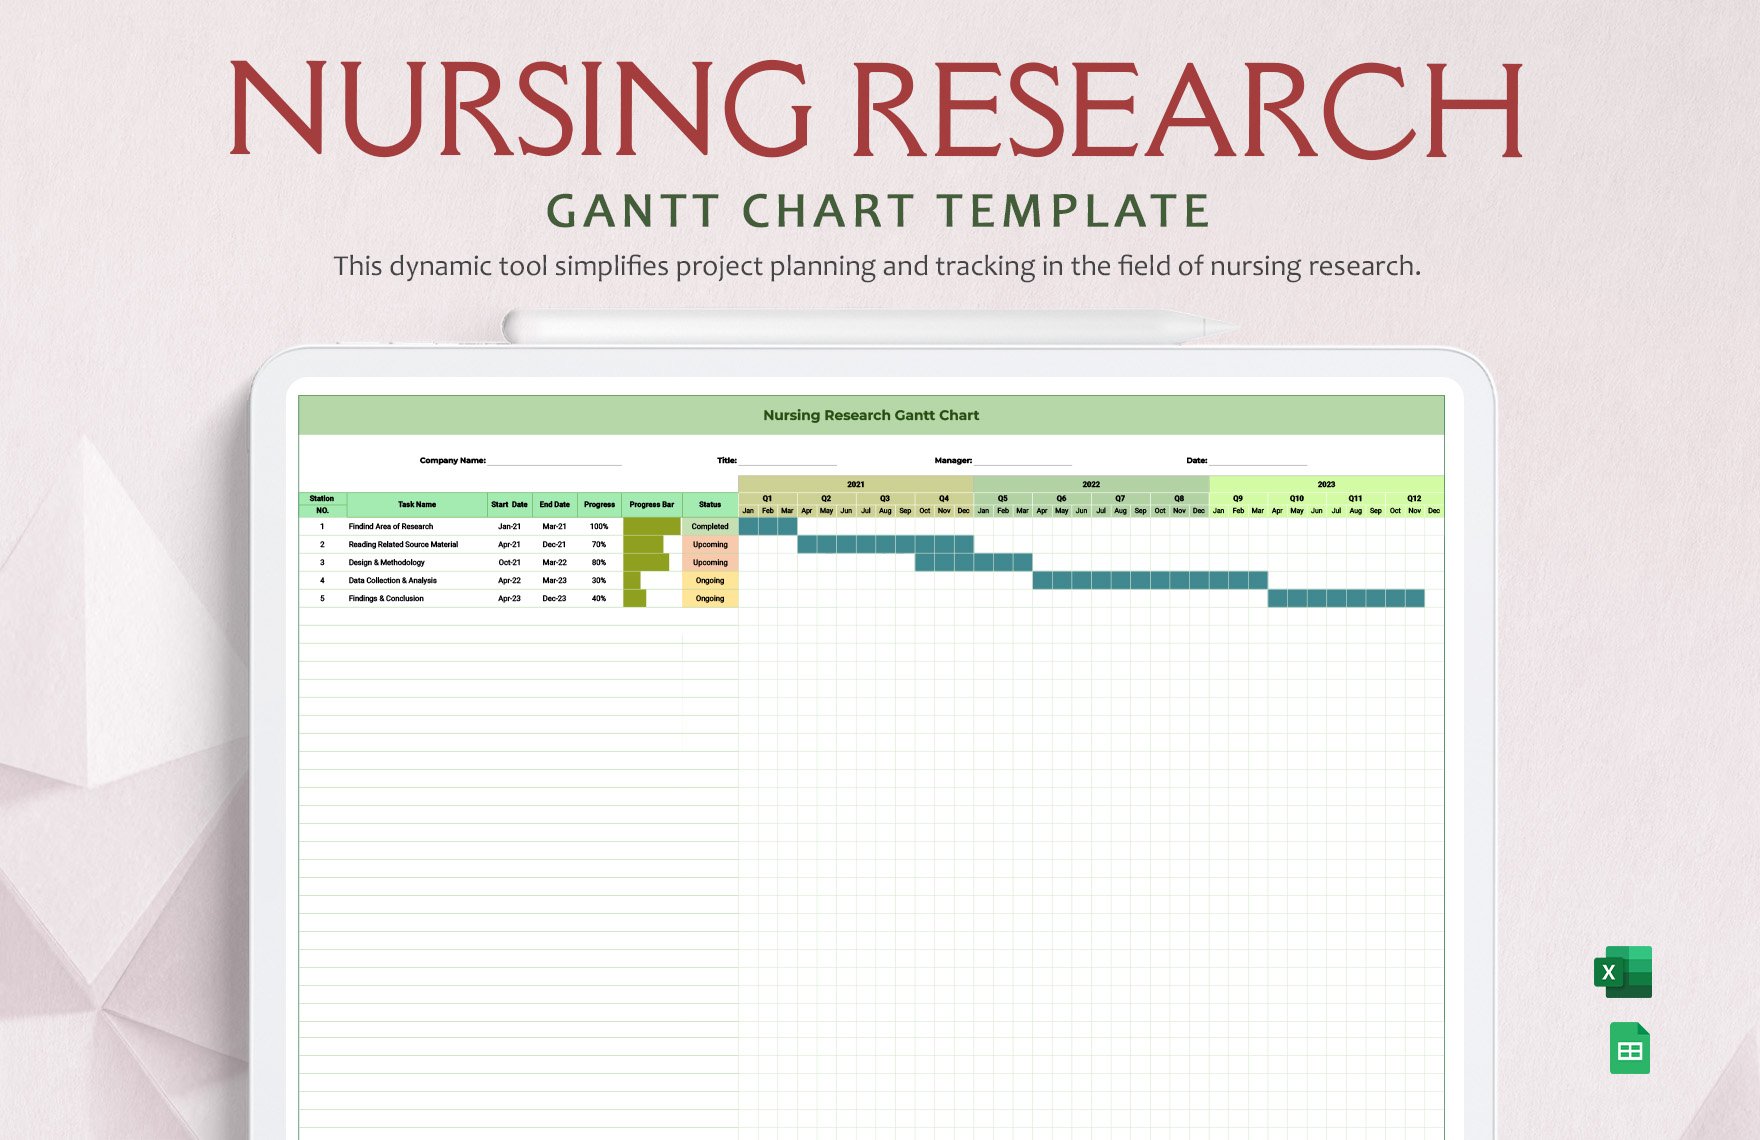
There are some days or instances wherein we don't have enough time to create something from scratch, especially a chart. For that reason, we advise you to use our printable and editable chart templates. With their help, all you have to do is insert the data that your chart must showcase. Our chart templates are compatible with MS Word, Apple Pages, MS Publisher, Google Docs, PDF, and MS Powerpoint. We have flow chart templates, Gantt chart templates, chore chart templates, seating chart templates, and so much more.


