Free ChatGPT Prompts For Data Analysis
Free Download this Free ChatGPT Prompts For Data Analysis Design in ChatGPT Format. Easily Editable, Printable, Downloadable.
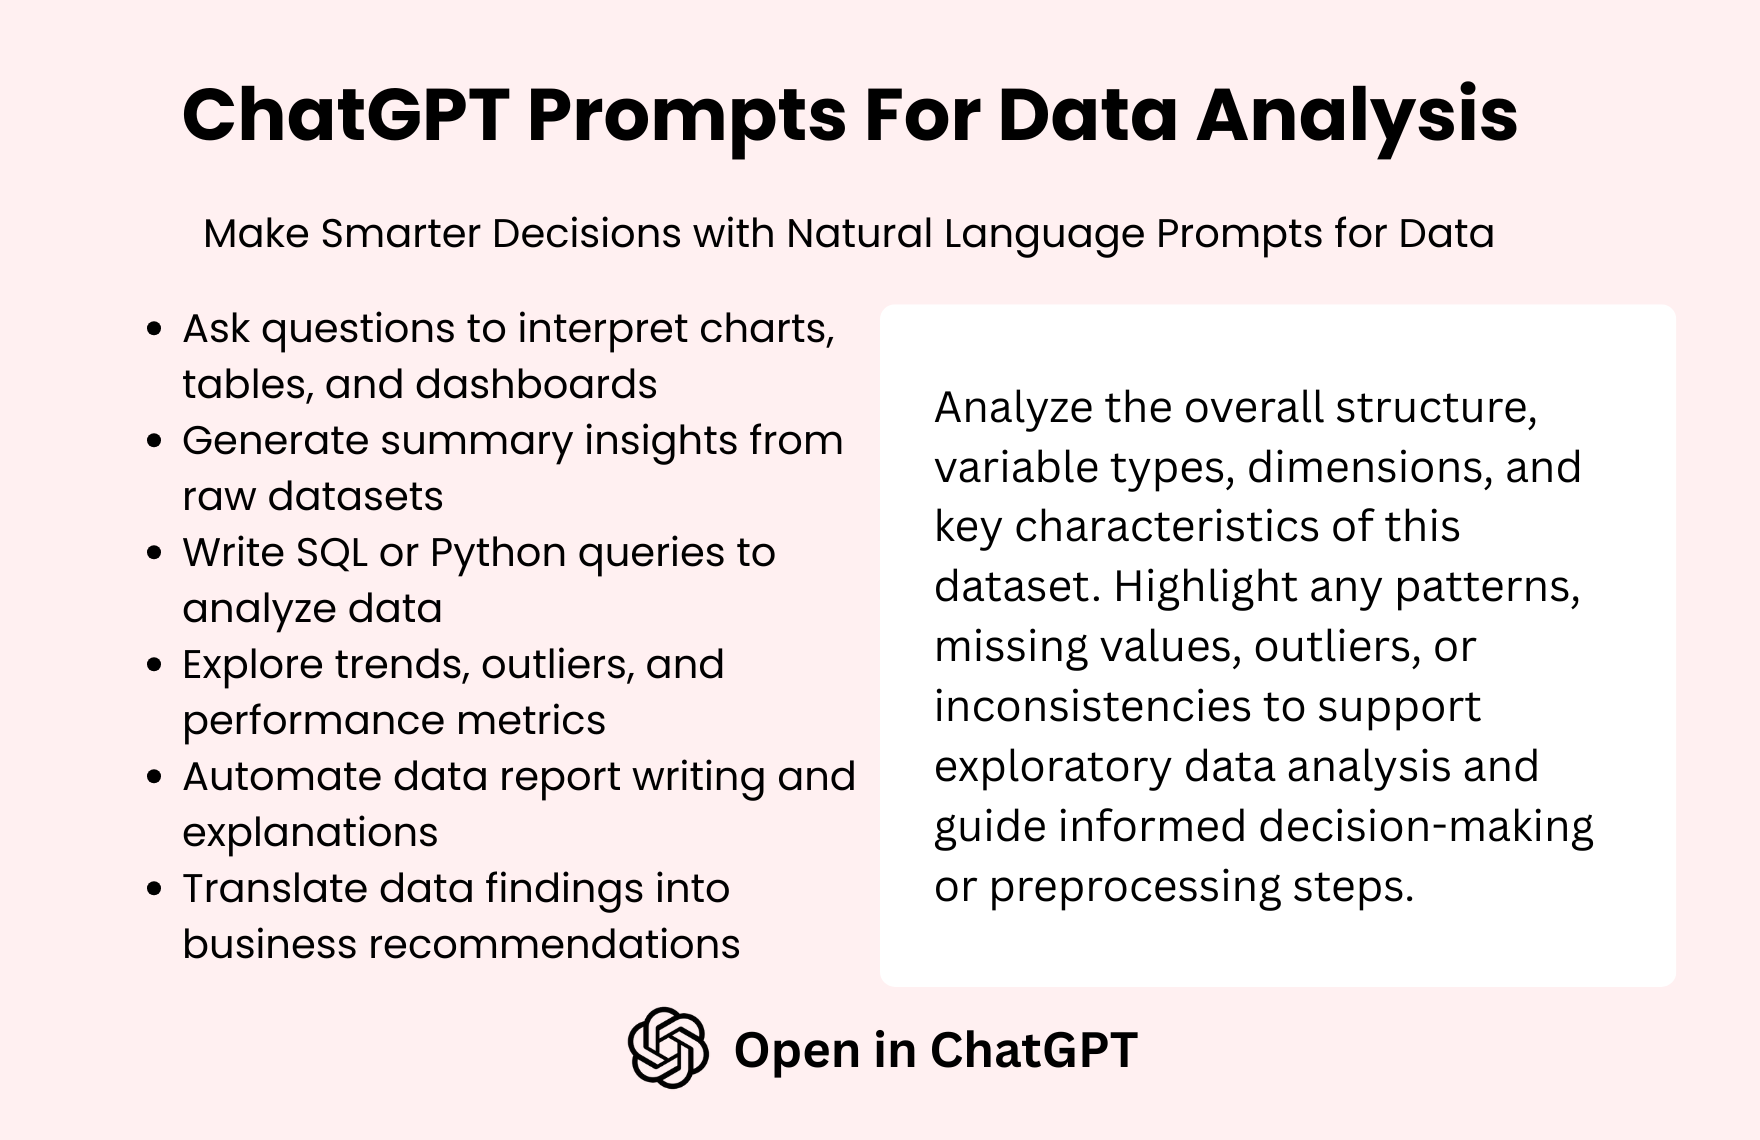
Data becomes powerful when it’s translated into insights. ChatGPT prompts assist with summarizing reports, generating visualizations, and exploring trends using natural language. For analysts and decision-makers, these prompts simplify complex data and accelerate your analysis workflow.
Why Use ChatGPT Prompts for Data Analysis?
Summarize data findings in simple, clear language
Generate report outlines, dashboards, and insights
Write SQL queries or formulas based on input needs
Translate raw data into decision-ready summaries
Save time analyzing and communicating complex results
ChatGPT Prompts For Data Analysis
Data Summary Generator: Write a summary of findings from a dataset tracking {Metric} over a {Time Period}.
KPI Report Introduction: Generate a professional intro paragraph for a KPI report on {Department or Objective}.
Data Visualization Suggestions: Suggest the best charts or graphs to visualize data about {Topic or Metric}.
Insight Explanation Prompt: Explain what a sudden spike in {Variable} means in simple, non-technical language.
Survey Data Analysis: Create a summary of customer feedback collected from a {Survey Type} with major themes and suggestions.
Excel Formula Prompt: Write a formula that calculates {Specific Value} based on a sample spreadsheet layout.
SQL Query Builder: Generate an SQL query to extract {Data Type} from a table where {Condition} is true.
Data Storytelling Prompt: Turn this dataset summary into a clear, compelling story for a non-technical executive audience.
Where You Can Use These Prompts
Summarize trends from spreadsheets or dashboards
Write plain-language explanations for executive reports
Create automated email or report templates
Generate SQL or Excel formulas from scratch
Visualize data with recommended charts and graphs
Draft insights and takeaways from survey results
Build structured analysis frameworks for presentations
Create dashboards with labeled KPI commentary
