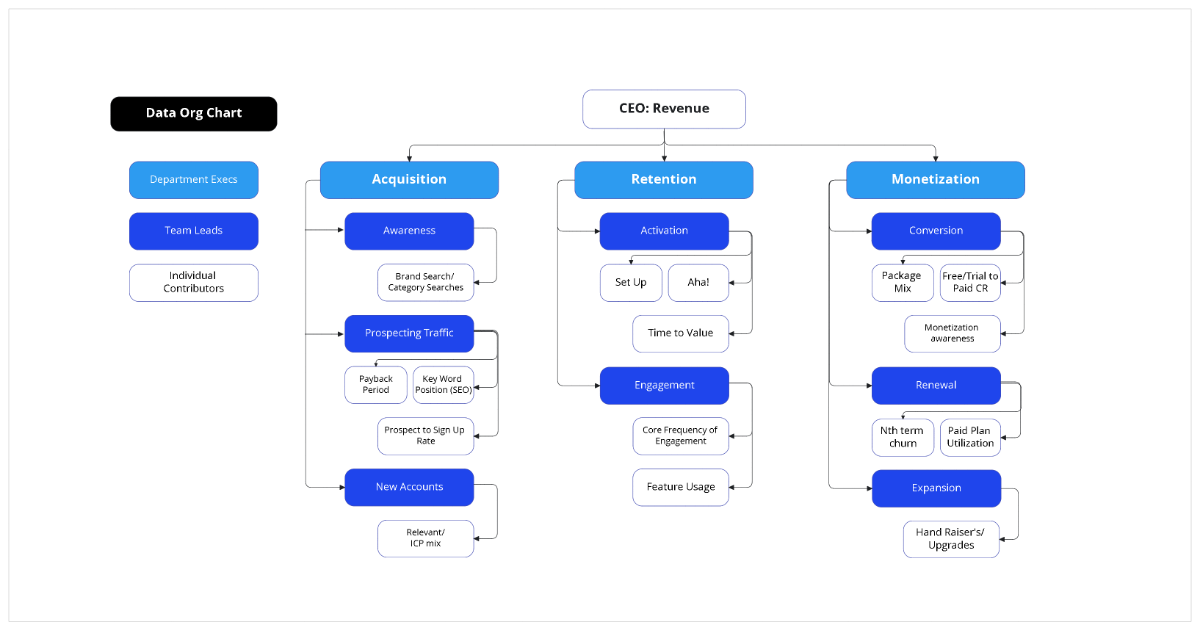
The Data Org Chart template is designed to help teams visualize and manage the structure of data-driven operations within an organization. It is ideal for data analysts, product managers, marketing teams, and business leaders who need to map out functions related to acquisition, retention, and monetization. Users start by defining key leadership roles, then organize departments and teams based on data flow and performance metrics. They can illustrate processes such as traffic acquisition, user engagement, conversion, and revenue growth. Once completed, the chart provides a clear, data-focused overview of how teams collaborate to drive measurable results, ensuring alignment between strategy, analytics, and business objectives.


