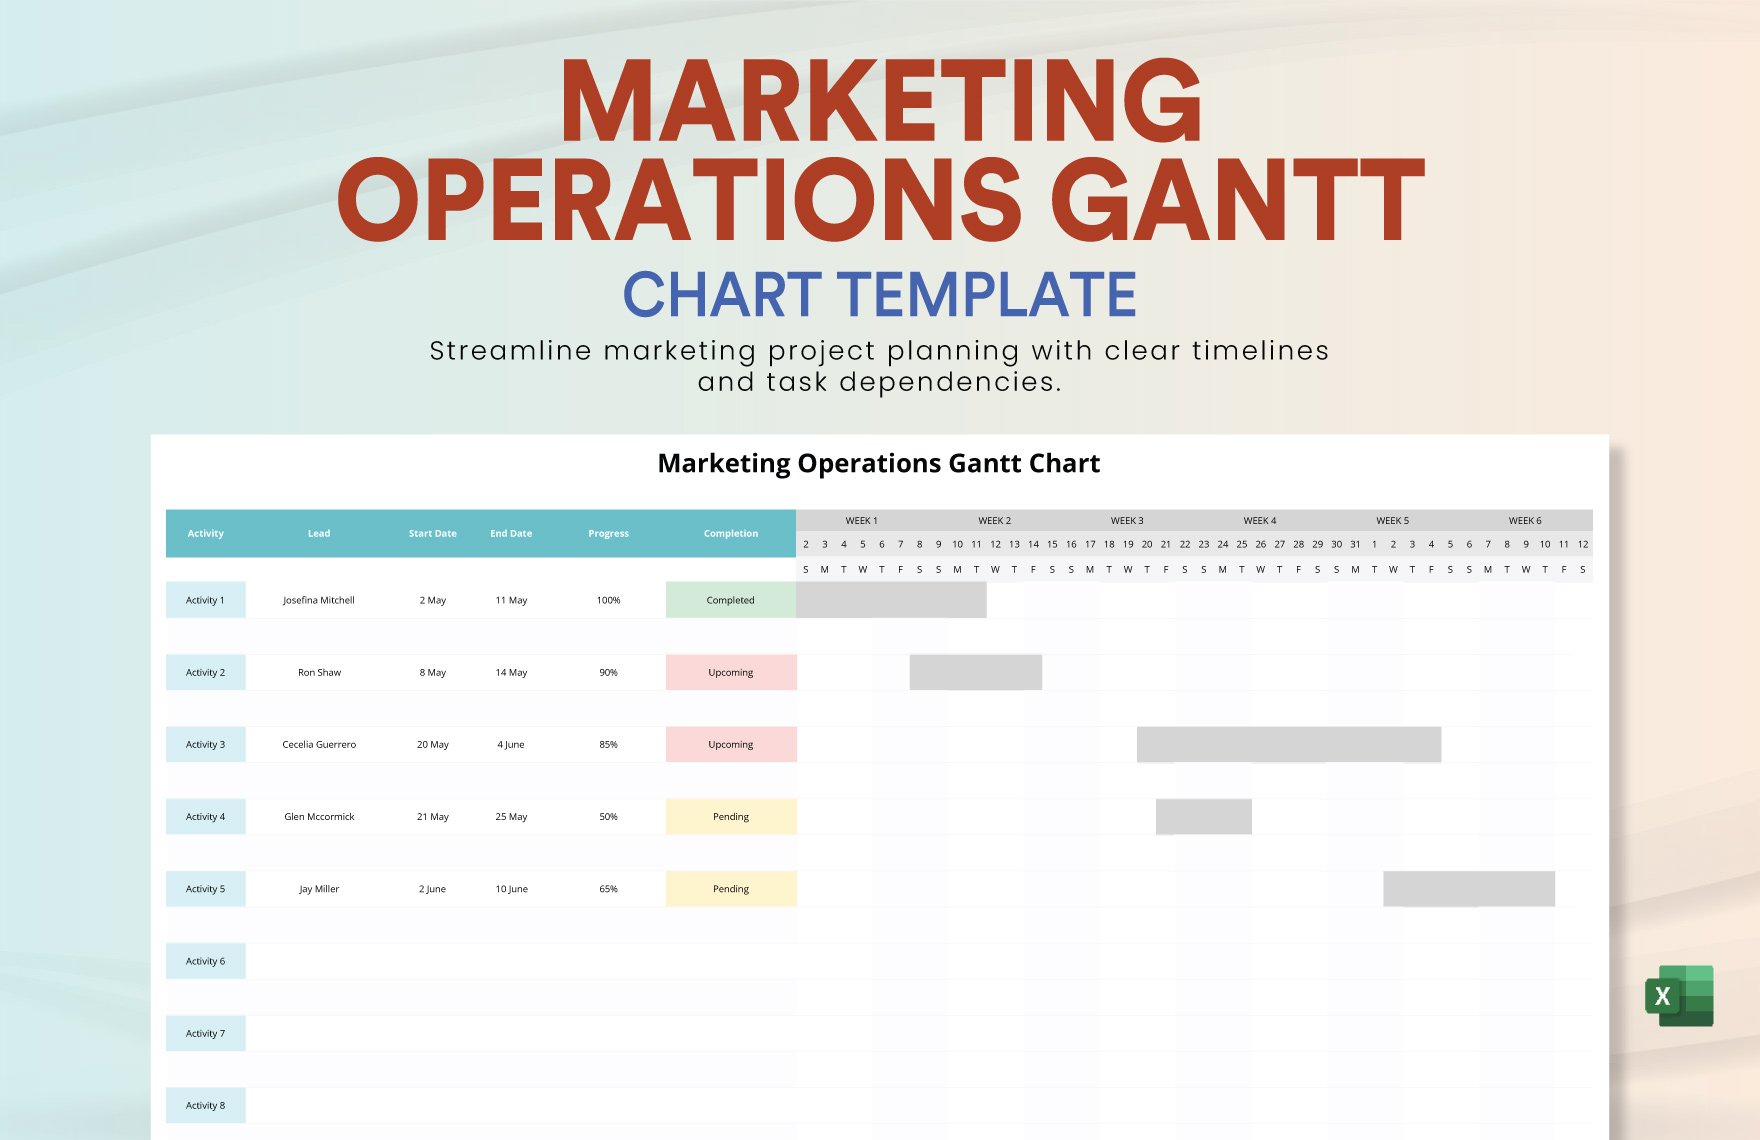
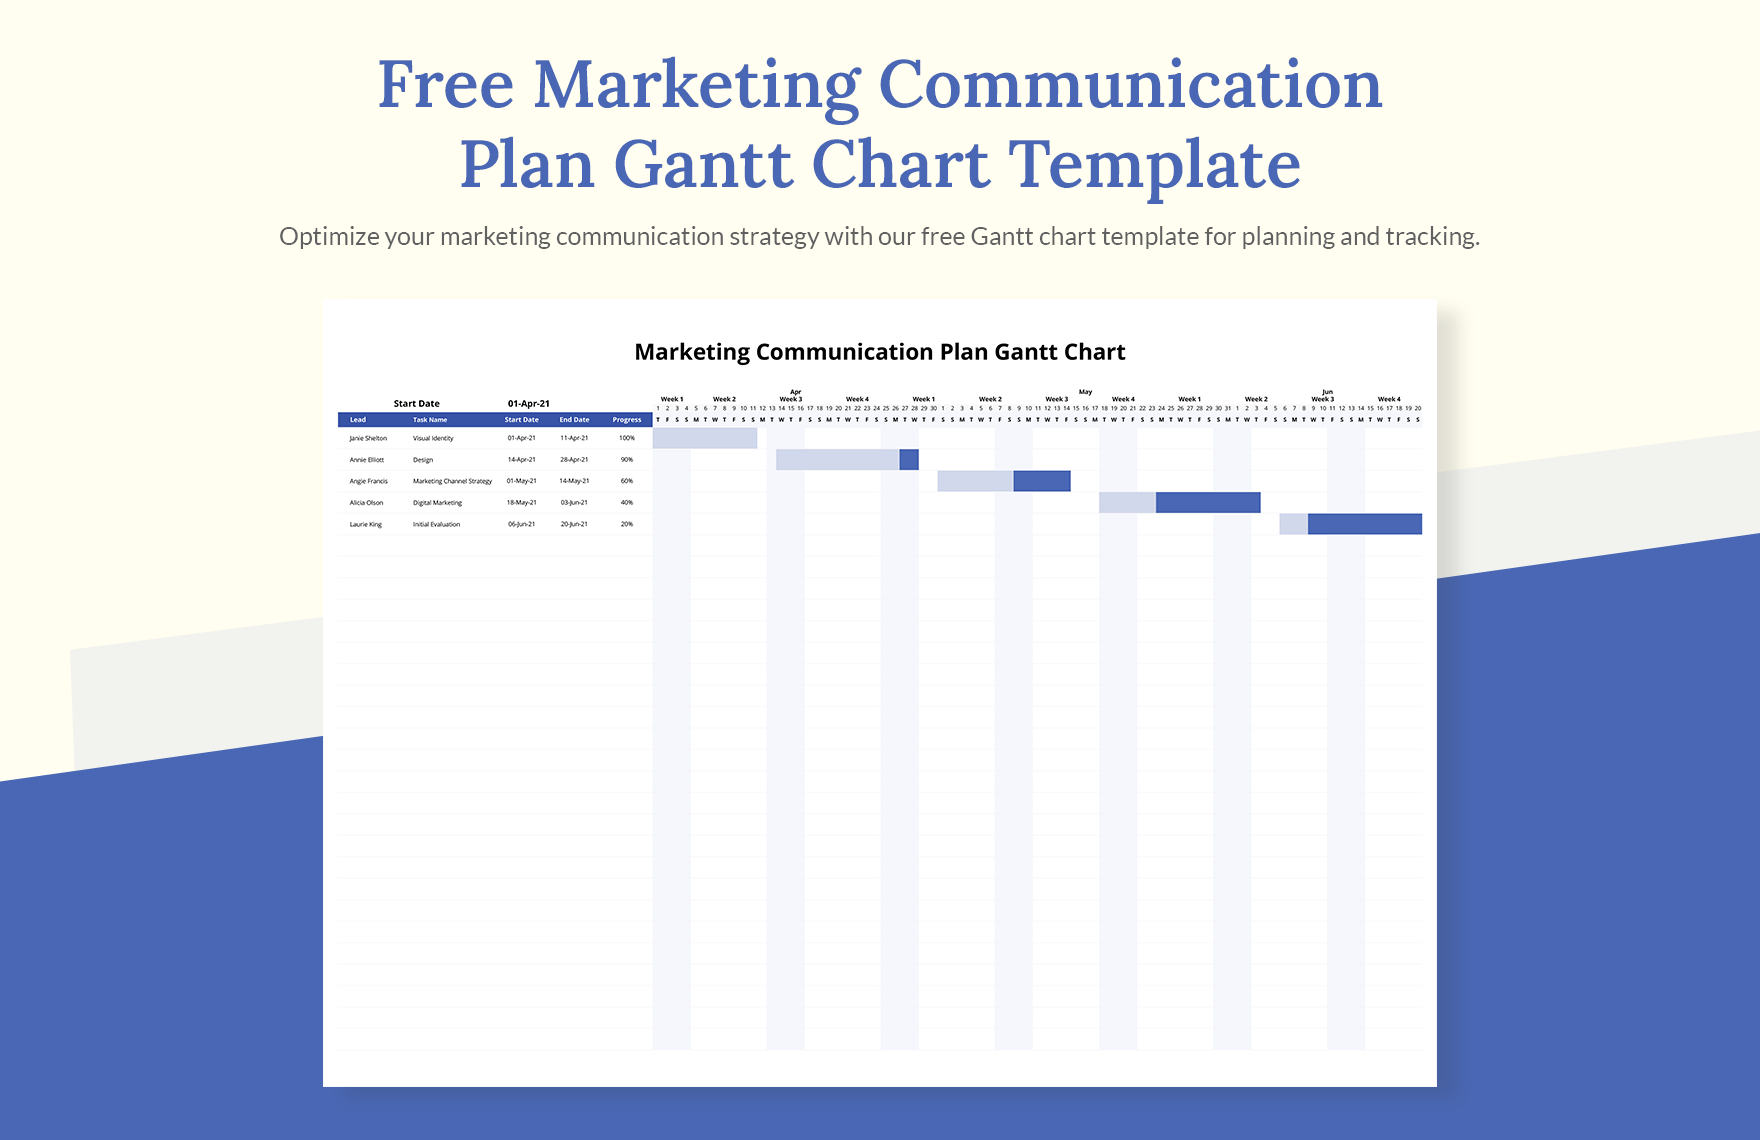
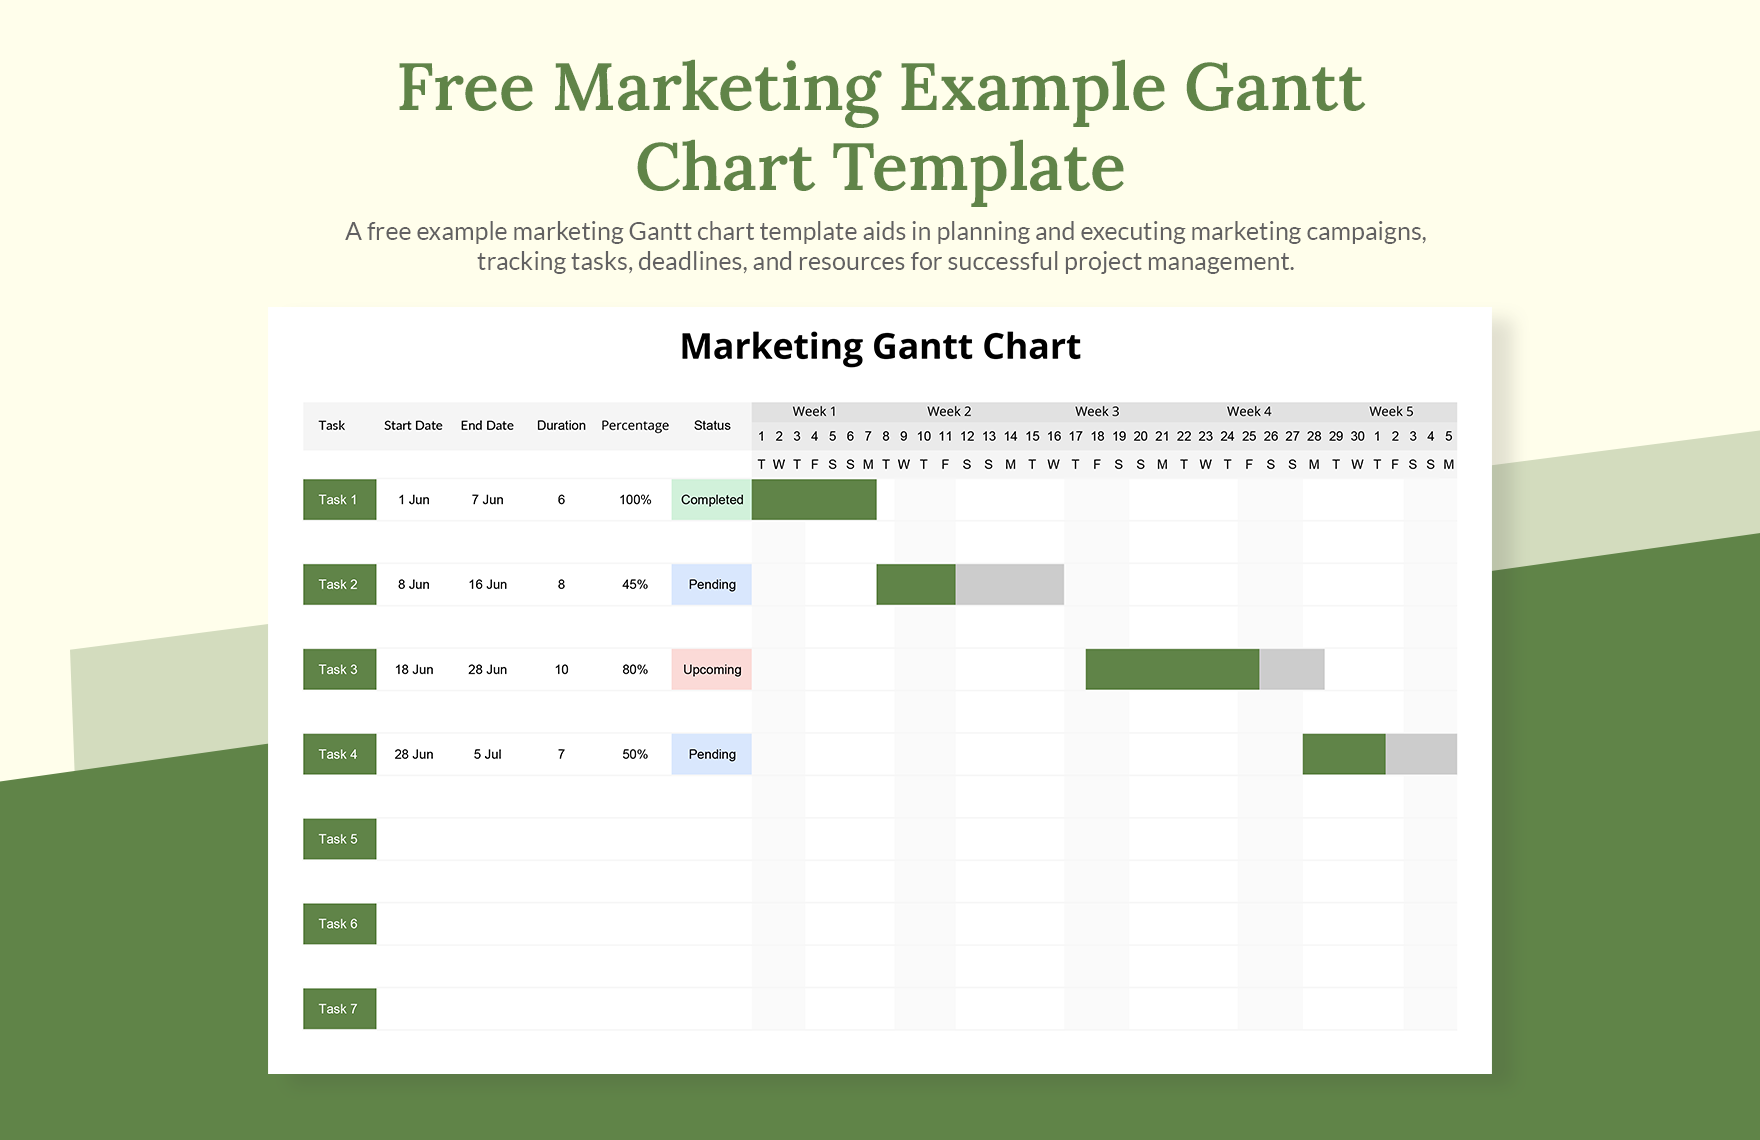
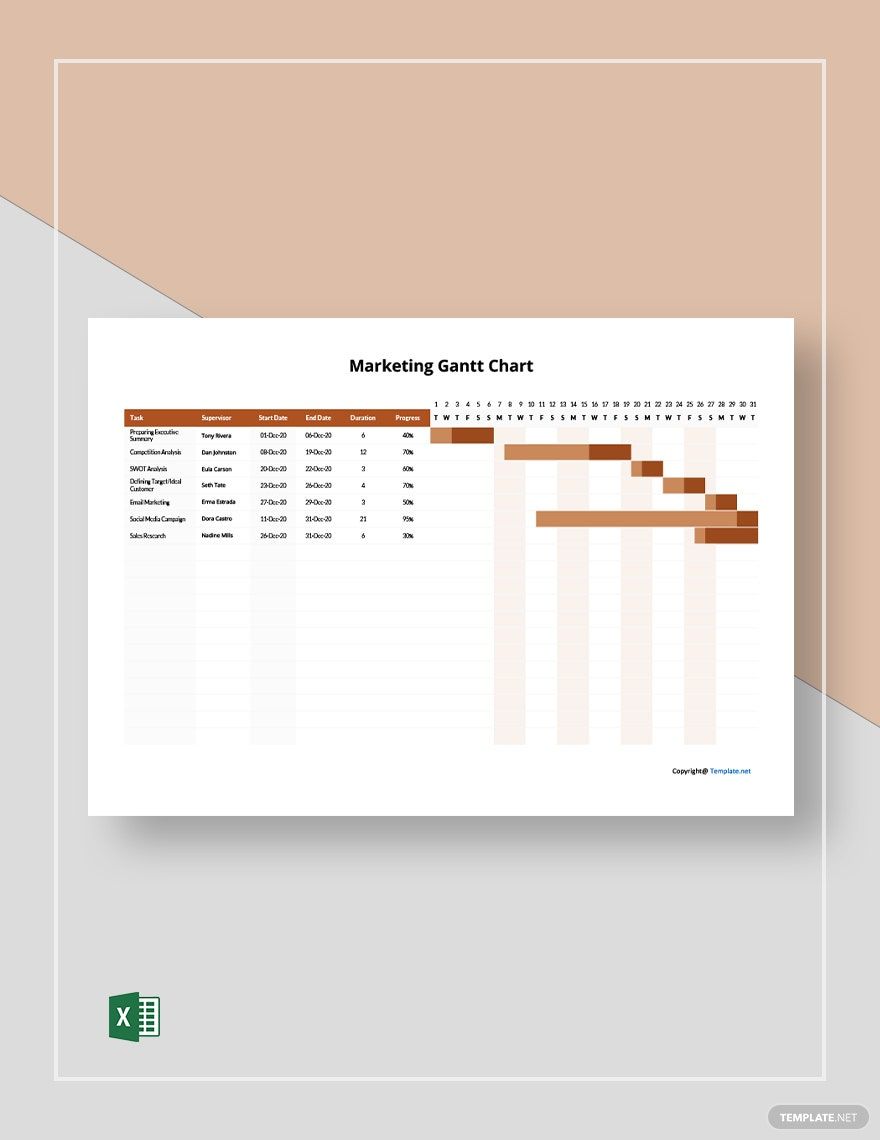
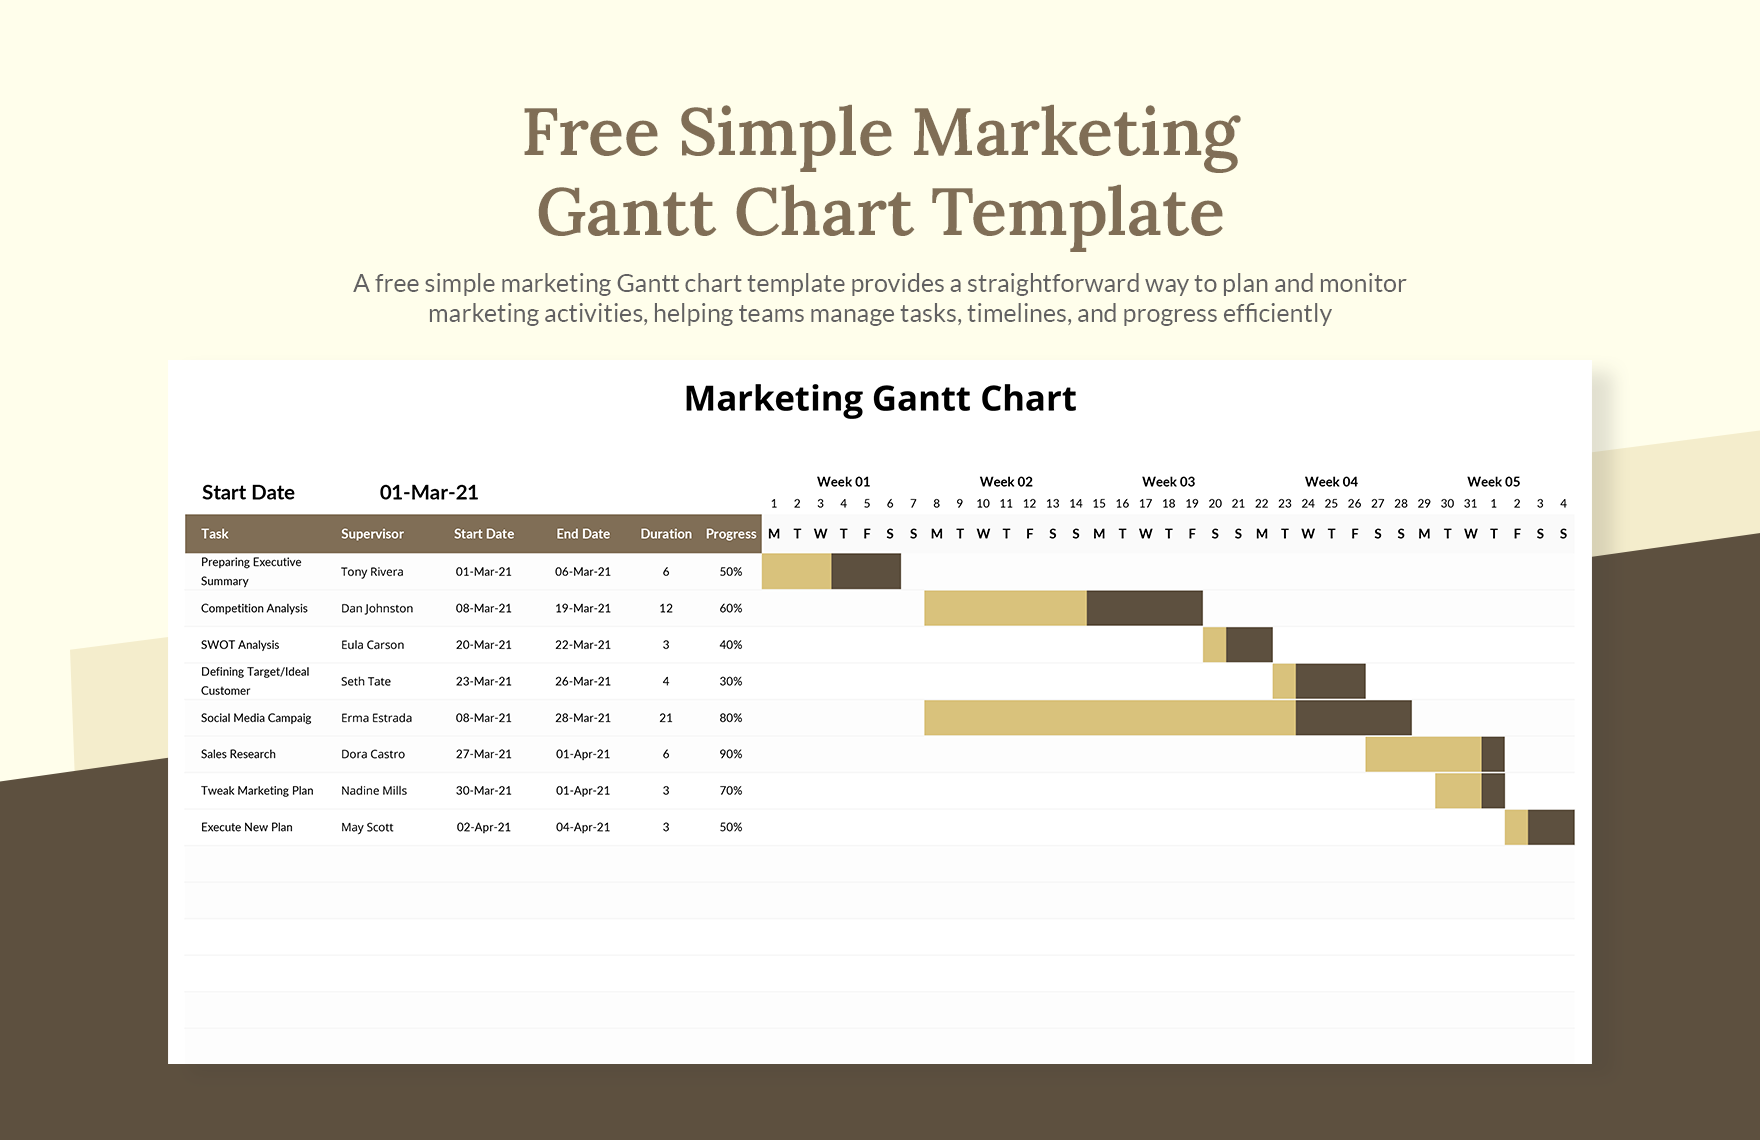
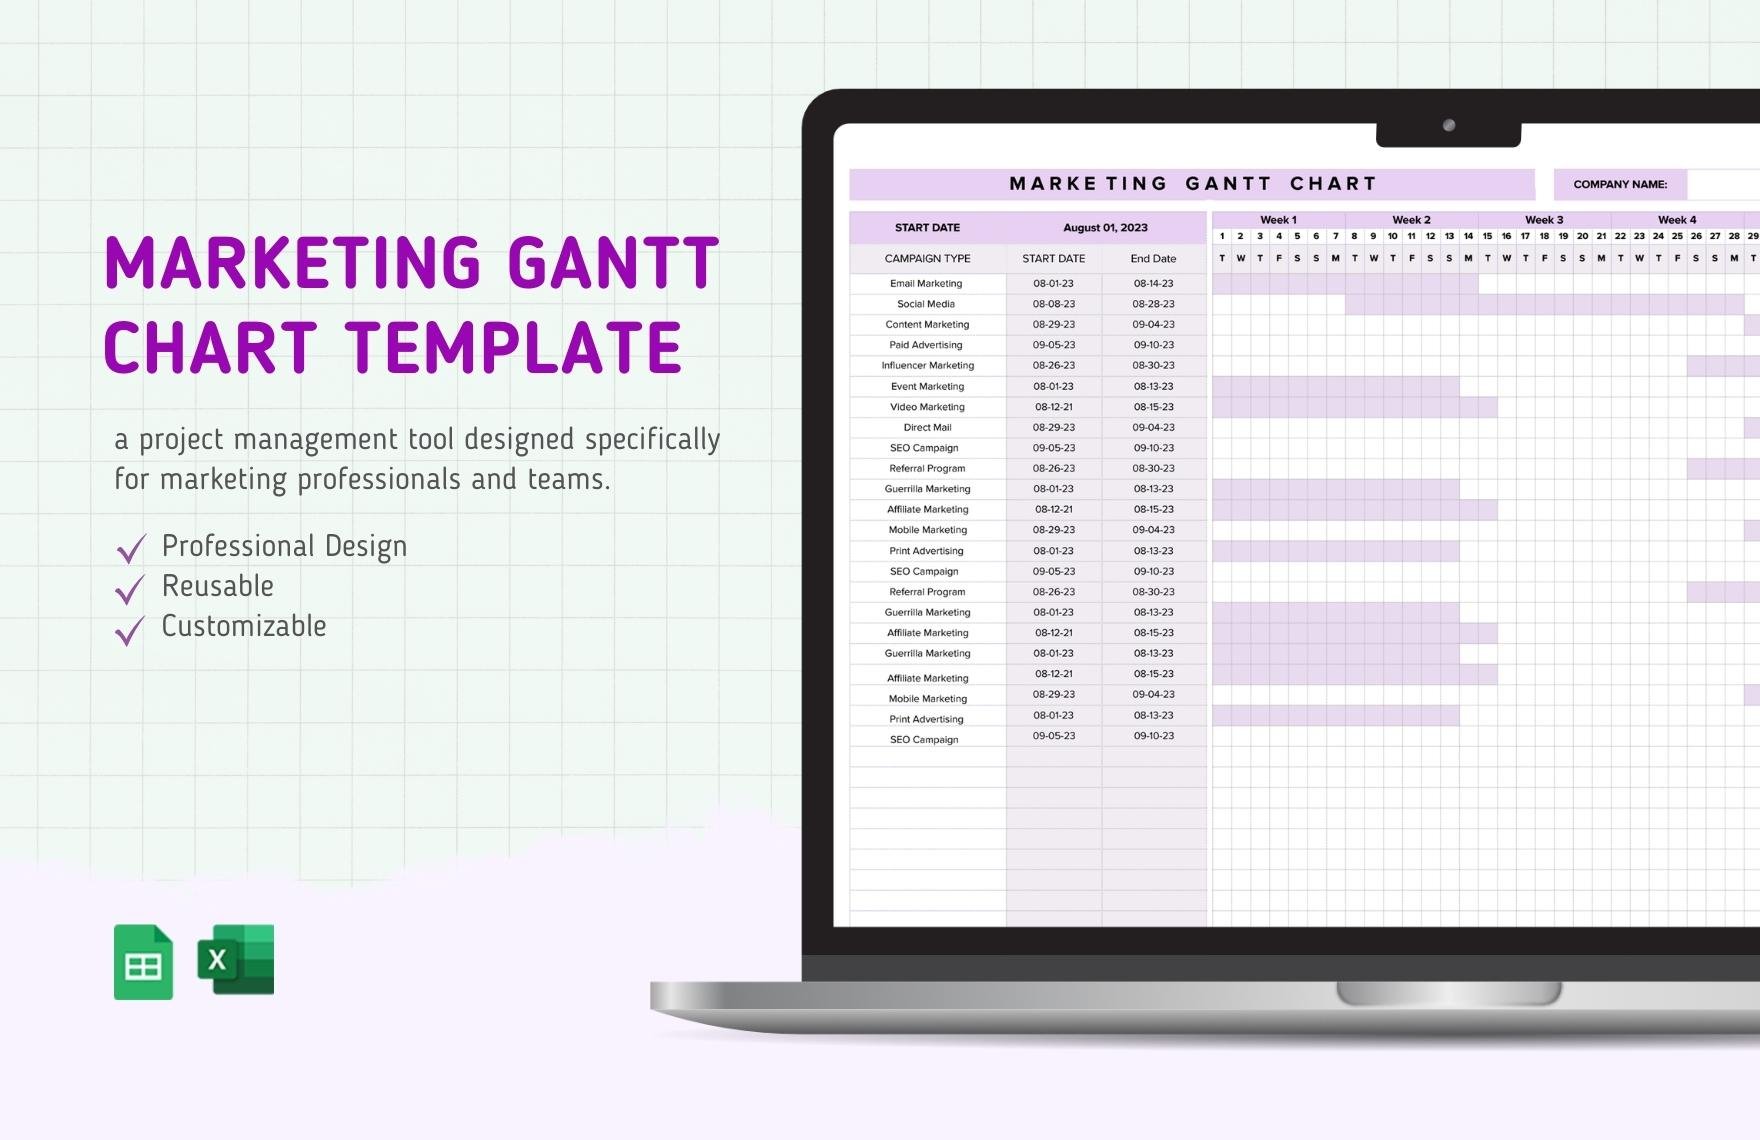
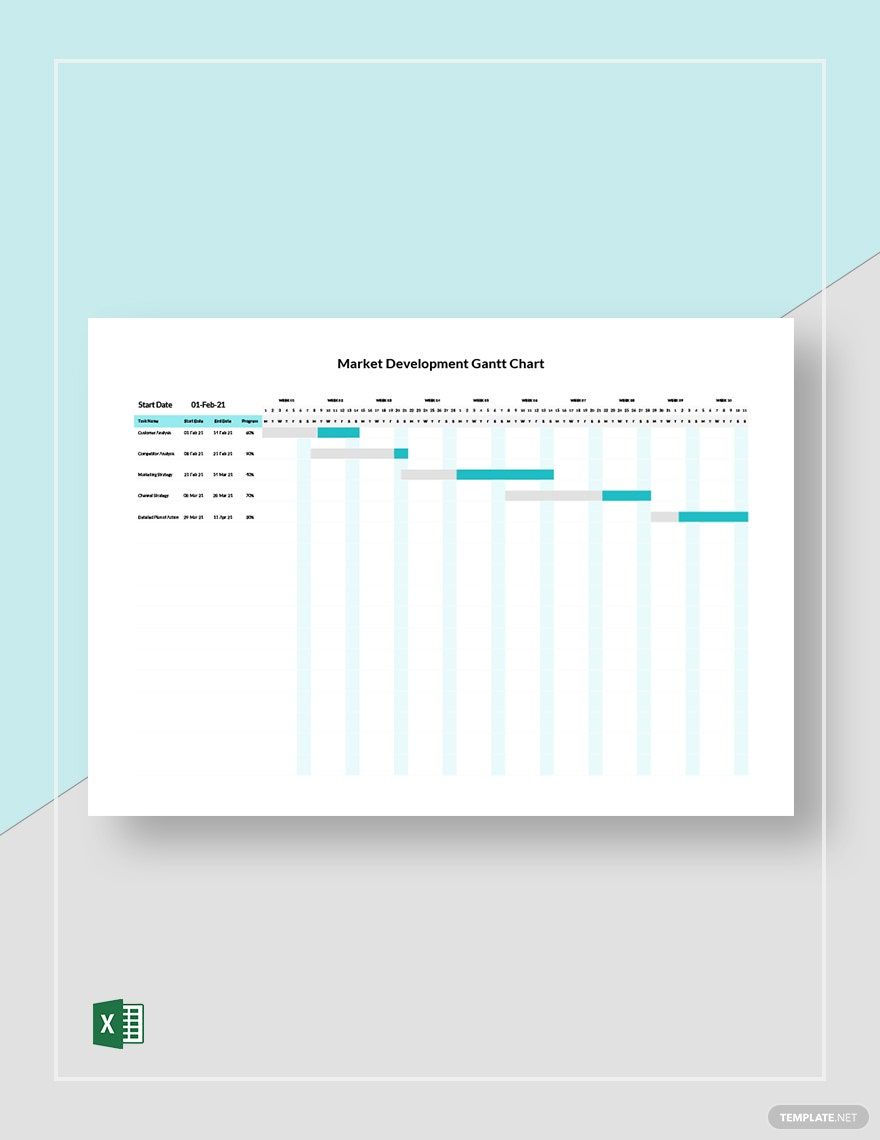
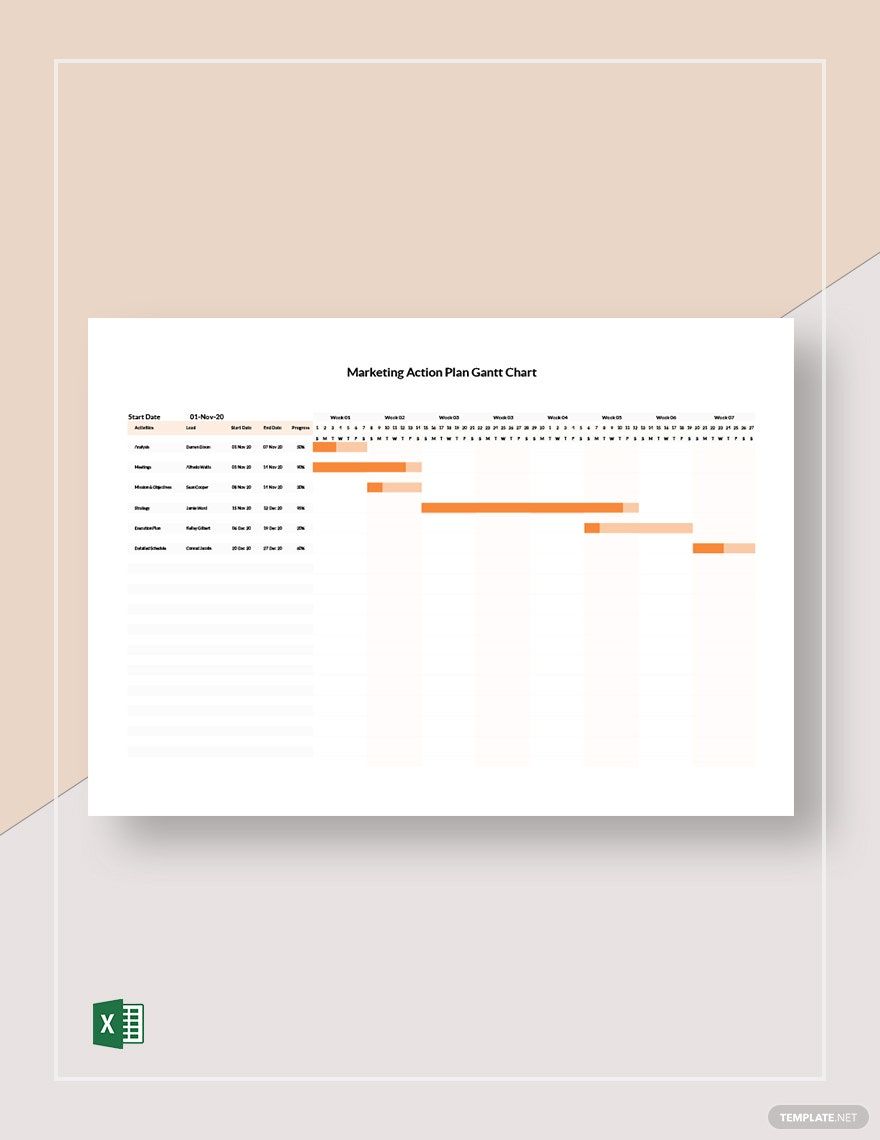
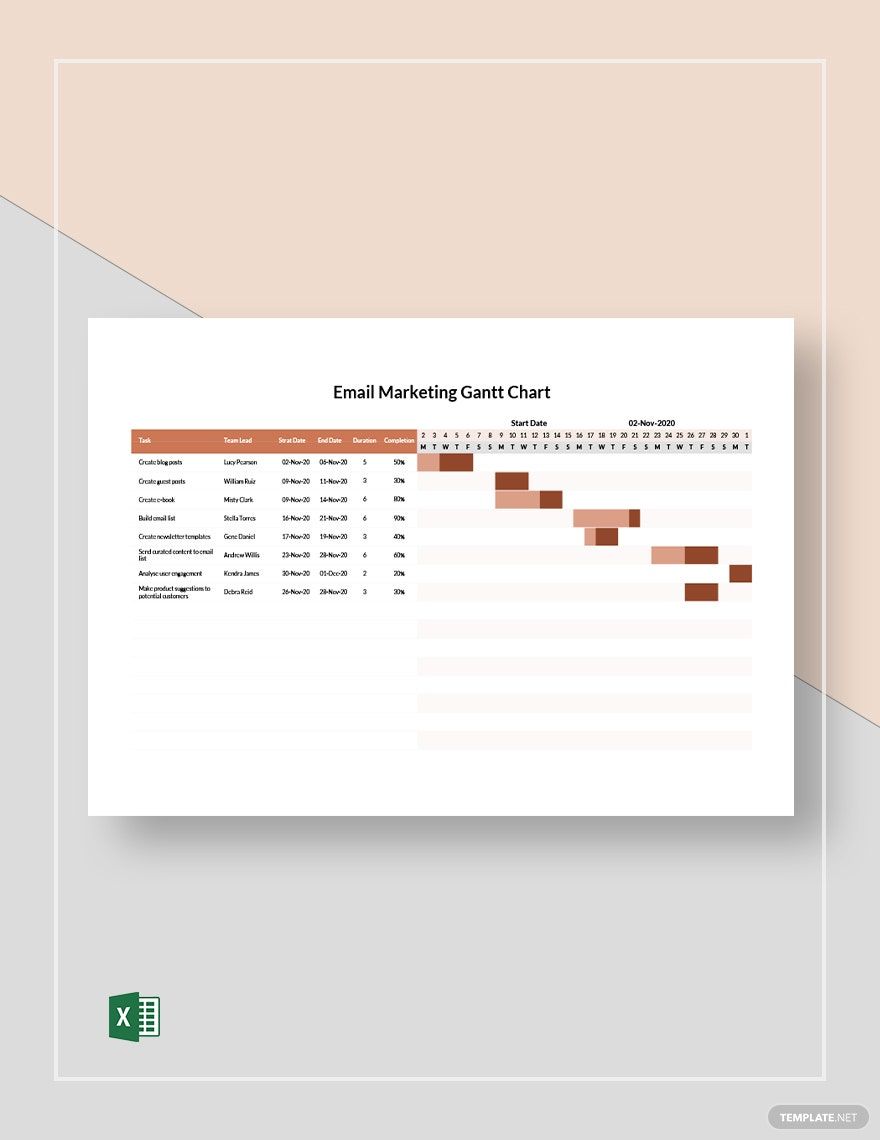
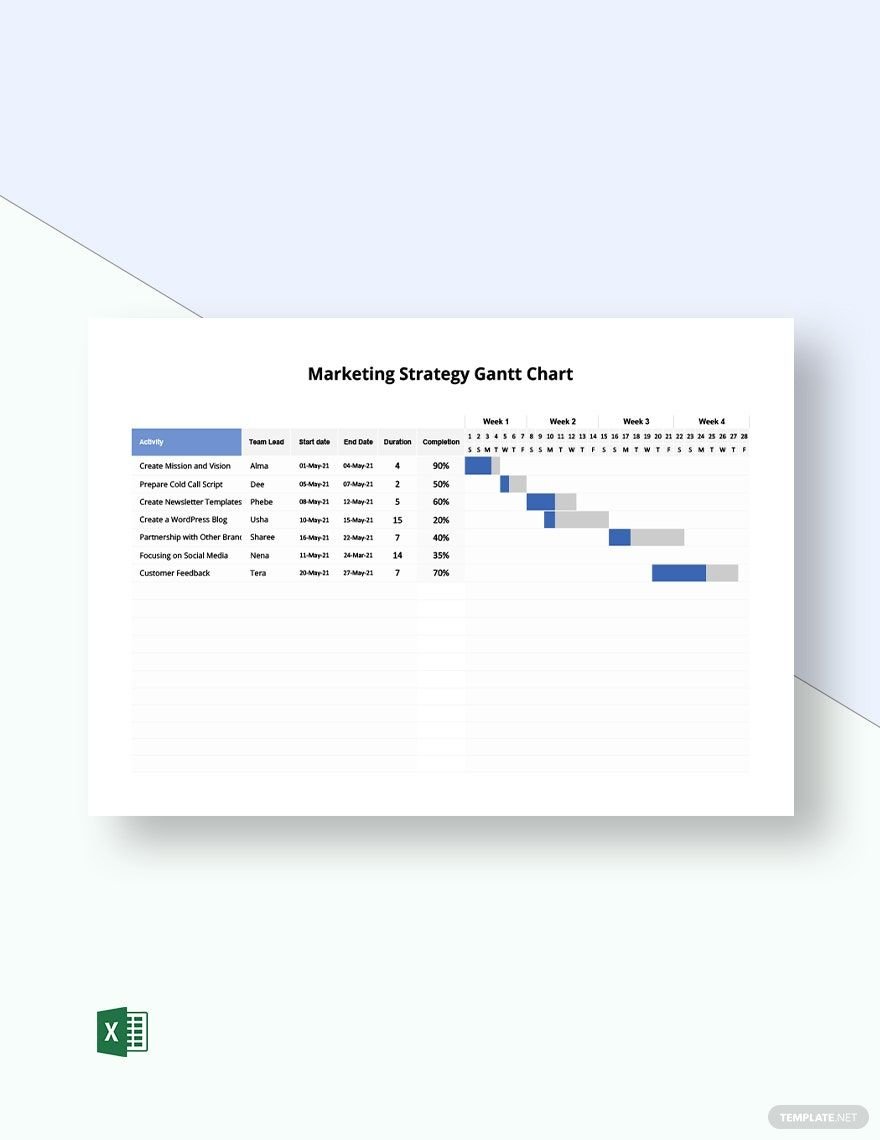
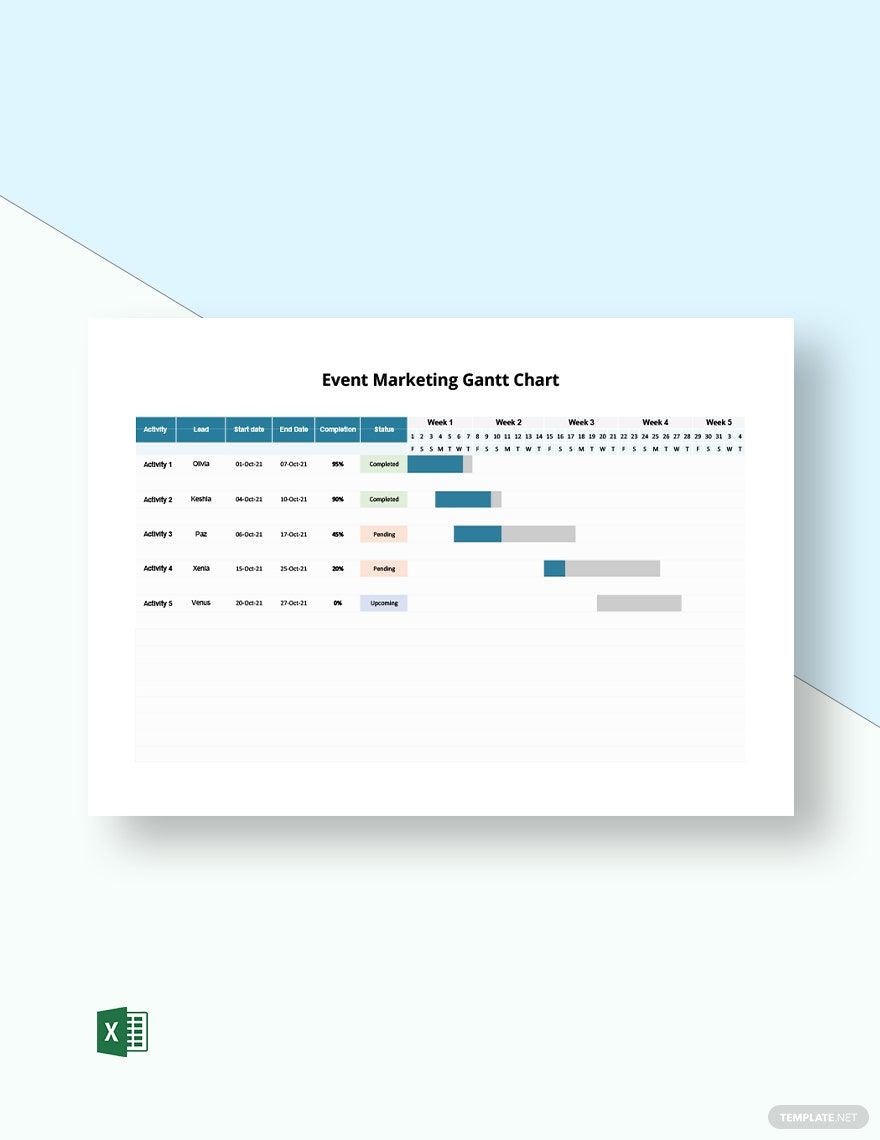
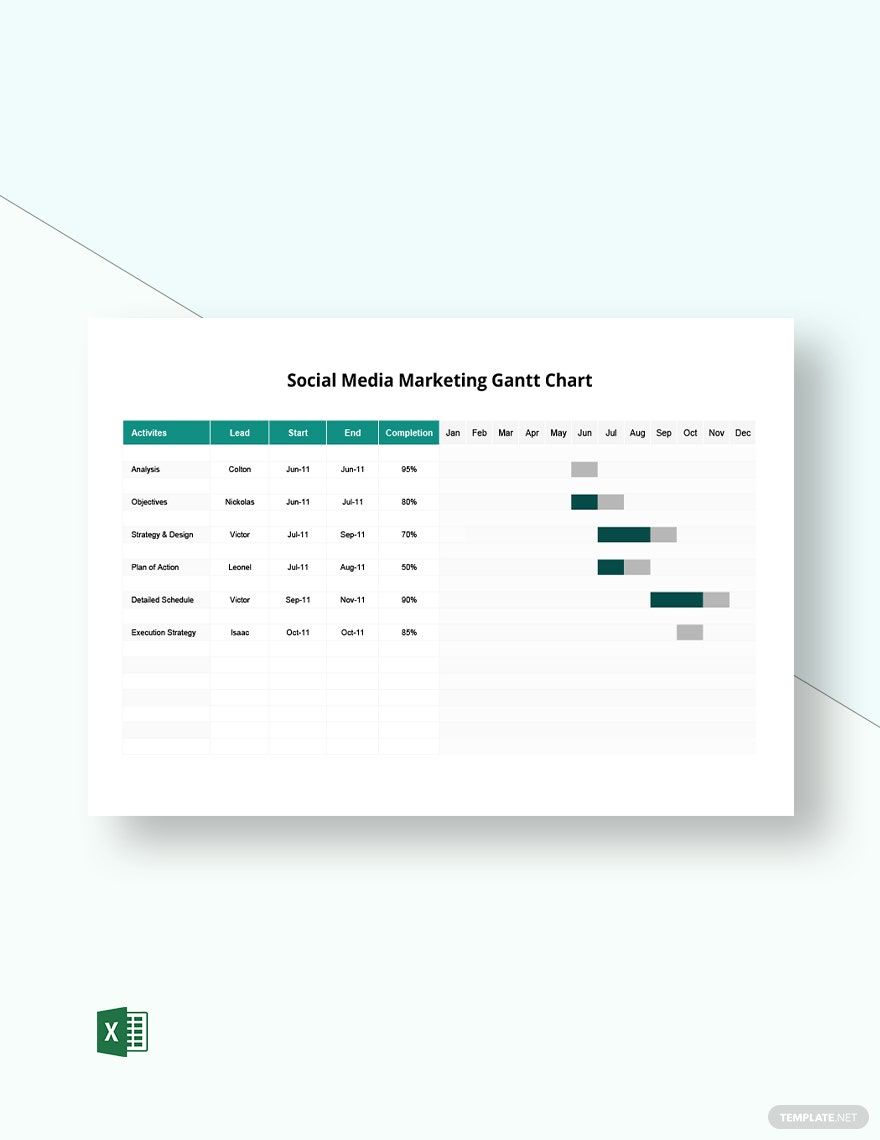
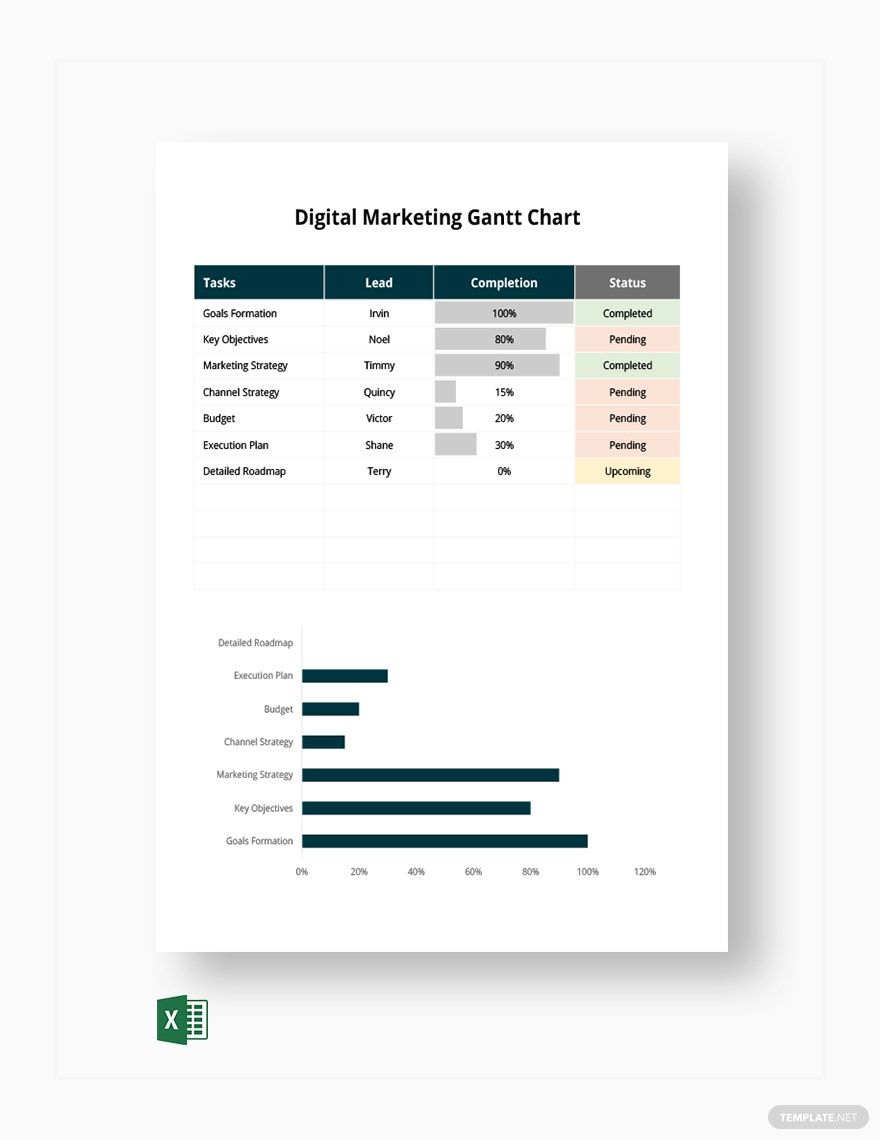
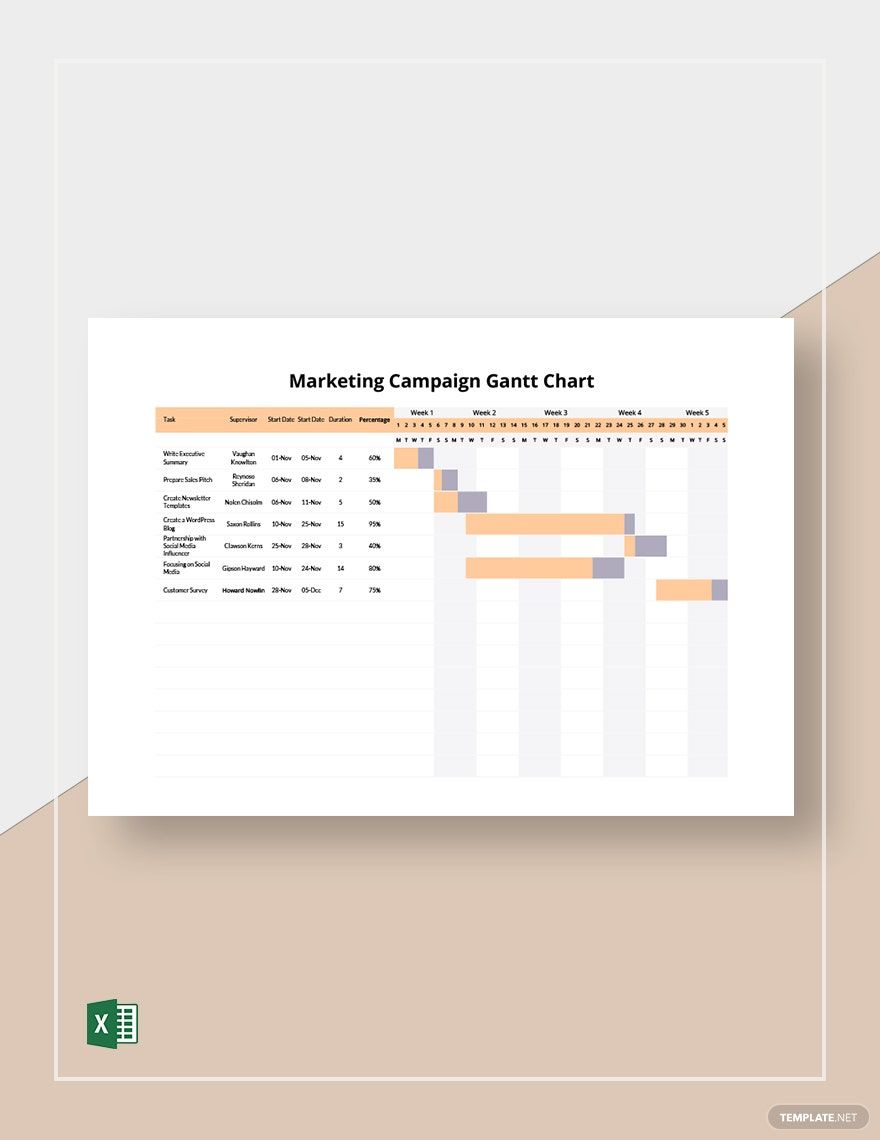
The Gantt chart was developed as a production control tool used for managing projects. It shows graphical illustrations of a schedule that is helpful in planning, coordinating, and tracking project tasks. Gantt charts can be simple charts created on paper, but there are also automated versions that are created using project management applications. Our website offers Marketing Gantt Chart templates in MS Excel that you may use for the marketing needs of your business. Simply find the chart that you would like to use, edit as necessary, and download the file for your marketing project. Sign up now to gain access to our library of templates!
How to Create Gantt Charts for Marketing?
Marketing charts can be intimidating, and putting project management into practice is important to make the campaign a success. One of the most popular ways for marketing teams to make their projects more manageable is to create and maintain Gantt charts. Here are some tips to help you manage your marketing projects:
1. Define the Project Timeline
Divide increments of time for the project. Include start date, end date, and the length of time required to complete the project so that you can keep track of its progress. During this time, take the opportunity to divide the project and the report Gantt chart into major components, identifying major tasks and subtasks.
2. Create Progress Bars
Create progress bars for each task in the task Gantt chart, with a start and end date. Some tasks may overlap, but don’t worry, this means that they are happening, or are in progress at the same time. For these progress bars, identify critical paths that connect one task to another, indicating their dependence. For one task triggers the beginning of another, add a line from the end of the first task to the beginning of the second so that it can begin soon as the previous one is completed.
3. Create Task Groupings
Longer and bigger projects are difficult to manage, especially as there are plenty of lines of tasks. Make managing your schedule easier by grouping tasks. Have a “parent task” broken into smaller tasks. This allows you to organize your company Gantt chart better.
4. Keep Track of Milestones
It is good to keep track of milestones, as they represent parts of the project that is happening at any given time. Milestones represent major events that need to be finished so that the Business Gantt charts may continue.


