Free Swimlane Chart
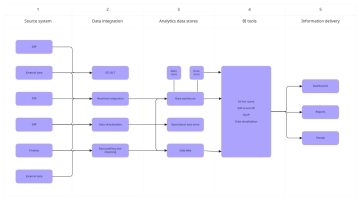
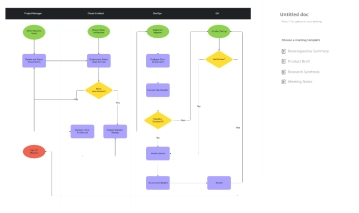
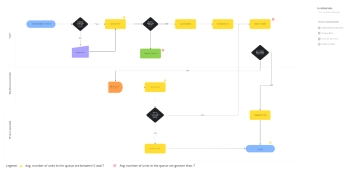
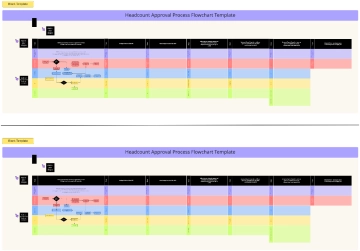
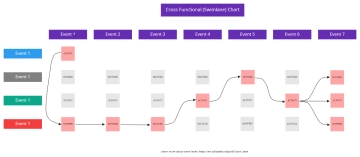
The Swimlane Chart Template is designed to help project managers, business analysts, and cross-functional teams visualize responsibilities and actions across multiple stakeholders and phases. Users begin by identifying key participants—such as departments or roles—and mapping their tasks within horizontal lanes segmented by project phases. Each action or decision is placed in the appropriate lane and phase, showing how responsibilities shift and interact over time. This structured layout clarifies ownership, highlights dependencies, and reveals bottlenecks or redundancies. By completing the chart, teams gain a clear, collaborative view of the entire process, enabling smoother execution and more accountable outcomes.

