Free Social Media Marketing Audience Demographic Datasheet
Company: | [YOUR COMPANY NAME] |
Prepared by: | [YOUR NAME] |
Date: | [DATE] |
_____________________________________________________________________________________
I. Overview

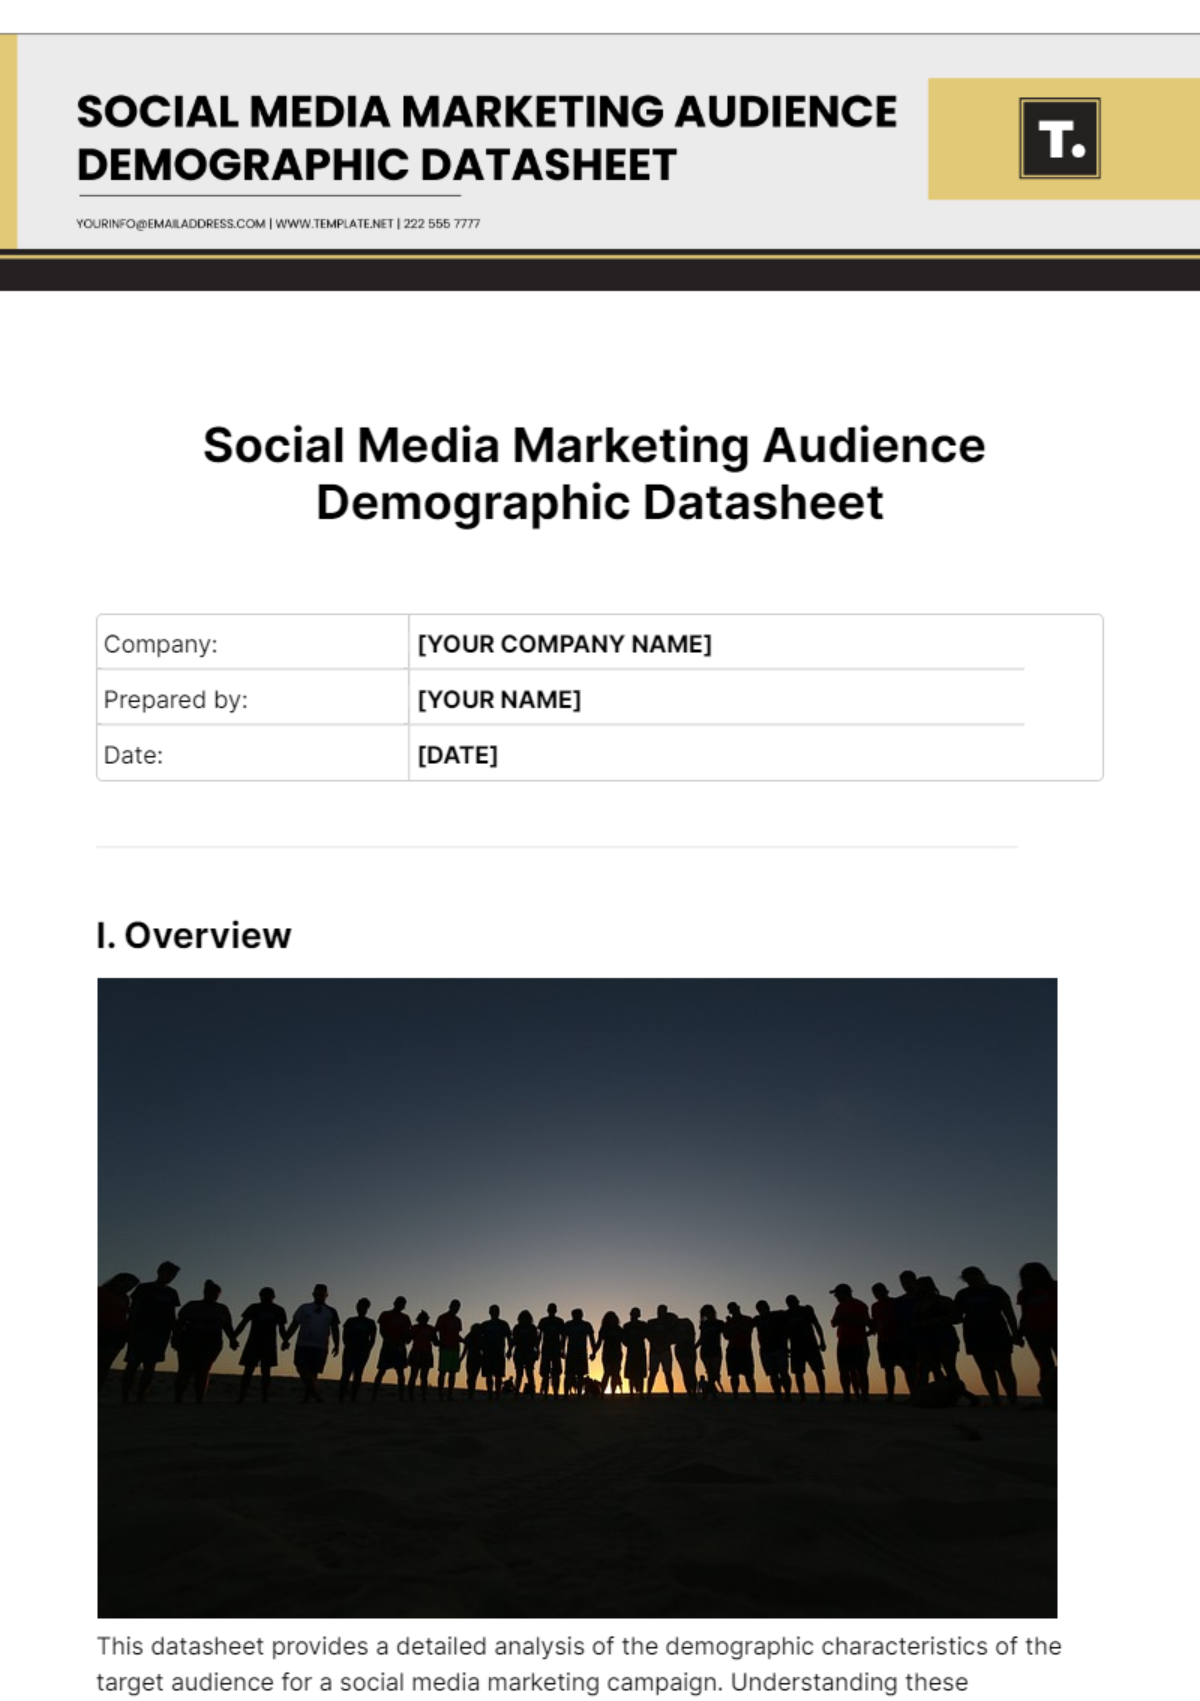
This datasheet provides a detailed analysis of the demographic characteristics of the target audience for a social media marketing campaign. Understanding these demographics is crucial for creating effective and targeted marketing strategies.
_____________________________________________________________________________________
II. Demographic Information
Age Distribution
18-24: | 25% |
25-34: | 35% |
35-44: | 20% |
45-54: | 15% |
55+: | 5% |
Gender
Male: | 55% |
Female: | 45% |
Location
United States: | 40% |
United Kingdom: | 20% |
Canada: | 15% |
Australia: | 10% |
Other: | 15% |
Income Level
Under $30,000: | 15% |
$30,000 - $60,000: | 30% |
$60,000 - $100,000: | 35% |
Over $100,000: | 20% |
Education Level
High School or less: | 10% |
Some College: | 30% |
Bachelor's Degree: | 40% |
Postgraduate Degree: | 20% |
_____________________________________________________________________________________
III. Psychographic Information
Interests and Hobbies
Technology: | 25% |
Travel: | 20% |
Fitness: | 15% |
Food and Cooking: | 10% |
Fashion: | 10% |
Gaming: | 10% |
Arts and Culture: | 10% |
Lifestyle
Health Conscious: | 30% |
Adventure Seekers: | 25% |
Career-Driven: | 20% |
Family-Oriented: | 15% |
Social Butterflies: | 10% |
Platform Usage
Active Hours | |
|---|---|
Morning: | 20% |
Afternoon: | 30% |
Evening: | 25% |
Night: | 15% |
Late Night: | 10% |
Device Usage
Mobile: | 70% |
Desktop: | 25% |
Tablet: | 5% |
_____________________________________________________________________________________
IV. Engagement Metrics
Interaction Rates
Likes: | 35% |
Comments: | 25% |
Shares: | 20% |
Click-throughs: | 15% |
Saves: | 5% |
Content Preferences
Video Content: | 40% |
Infographics: | 25% |
Blog Posts: | 20% |
Polls and Quizzes | 10% |
User-Generated Content: | 5% |
_____________________________________________________________________________________
V. Audience Behavior
Purchase Behavior
Online Shopping Frequency: | 60% |
Influenced by Social Media Ads: | 45% |
Impulse Buyers: | 20% |
Brand Loyalty
Loyal to Preferred Brands: | 70% |
Open to Trying New Brands: | 30% |
_____________________________________________________________________________________
VI. Trends and Insights
Video content generates the highest engagement rates among this audience segment.
Mobile devices are the preferred choice for accessing social media platforms.
Content related to technology, travel, and fitness resonates well with the audience.
The majority of the audience has a bachelor's degree or higher education level.
_____________________________________________________________________________________
VII. Visualizations
Pie charts illustrating age distribution, gender ratio, and device usage.
Bar graphs showing engagement metrics and content preferences.
Geographic maps display the location distribution of the audience.
_____________________________________________________________________________________
- 100% Customizable, free editor
- Access 1 Million+ Templates, photo’s & graphics
- Download or share as a template
- Click and replace photos, graphics, text, backgrounds
- Resize, crop, AI write & more
- Access advanced editor
Boost your social media strategy with the Social Media Marketing Audience Demographic Datasheet Template from Template.net. This fully customizable and editable template is designed for precision targeting. Editable in our AI Editor Tool, you can tailor every detail to your specific needs. Streamline your marketing efforts and connect with your audience like never before.
You may also like
- Attendance Sheet
- Work Sheet
- Sheet Cost
- Expense Sheet
- Tracker Sheet
- Student Sheet
- Tracking Sheet
- Blank Sheet
- Information Sheet
- Sales Sheet
- Record Sheet
- Price Sheet
- Plan Sheet
- Score Sheet
- Estimate Sheet
- Evaluation Sheet
- Checklist Sheet
- Bid Sheet
- Call Log Sheet
- Bill Sheet
- Assessment Sheet
- Task Sheet
- School Sheet
- Work From Home Sheet
- Summary Sheet
- Construction Sheet
- Cover Sheet
- Debt Spreadsheet
- Debt Sheet
- Client Information Sheet
- University Sheet
- Freelancer Sheet
- Bookkeeping Sheet
- Itinerary Spreadsheet
- Scorecard Sheet
- Run Sheet
- Monthly Timesheet
- Event Sheet
- Advertising Agency Sheet
- Missing Numbers Worksheet
- Training Sheet
- Production Sheet
- Mortgage Sheet
- Answer Sheet
- Excel Sheet
