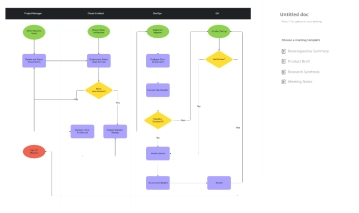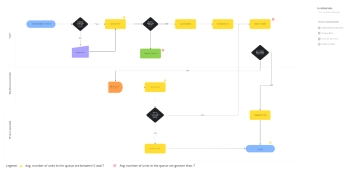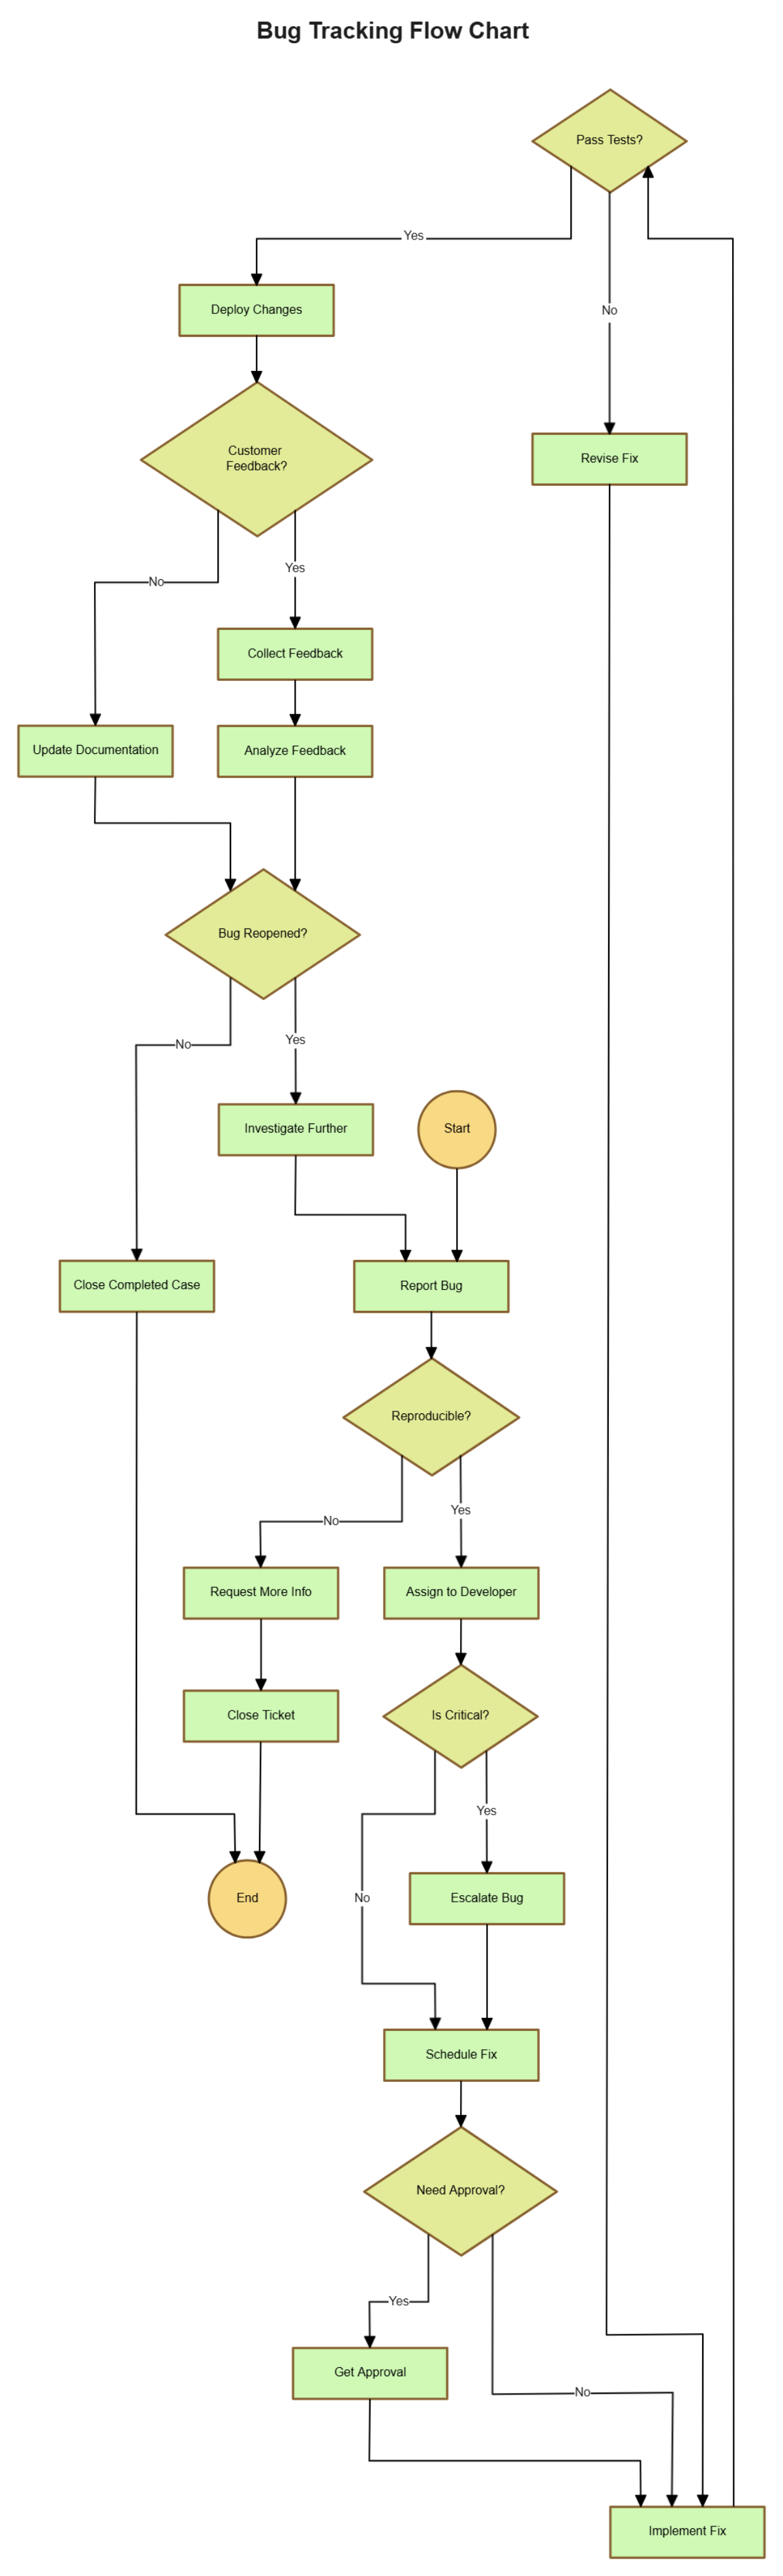
The Bug Tracking Flow Chart illustrates a systematic approach to identifying, resolving, and closing software bugs. It begins with a bug report and immediately checks whether the issue passes initial tests. If it fails, the process loops back for revision. If the tests pass, the changes are deployed, and customer feedback is collected. Based on this feedback, the flow may lead to further investigation and refinement of the fix. Once the bug is confirmed resolved and feedback is satisfactory, the case is closed. This chart emphasizes iterative testing, feedback analysis, and continuous improvement, ensuring that bugs are not only fixed but also validated through real-world use before final closure.