Free R&D Flow Chart
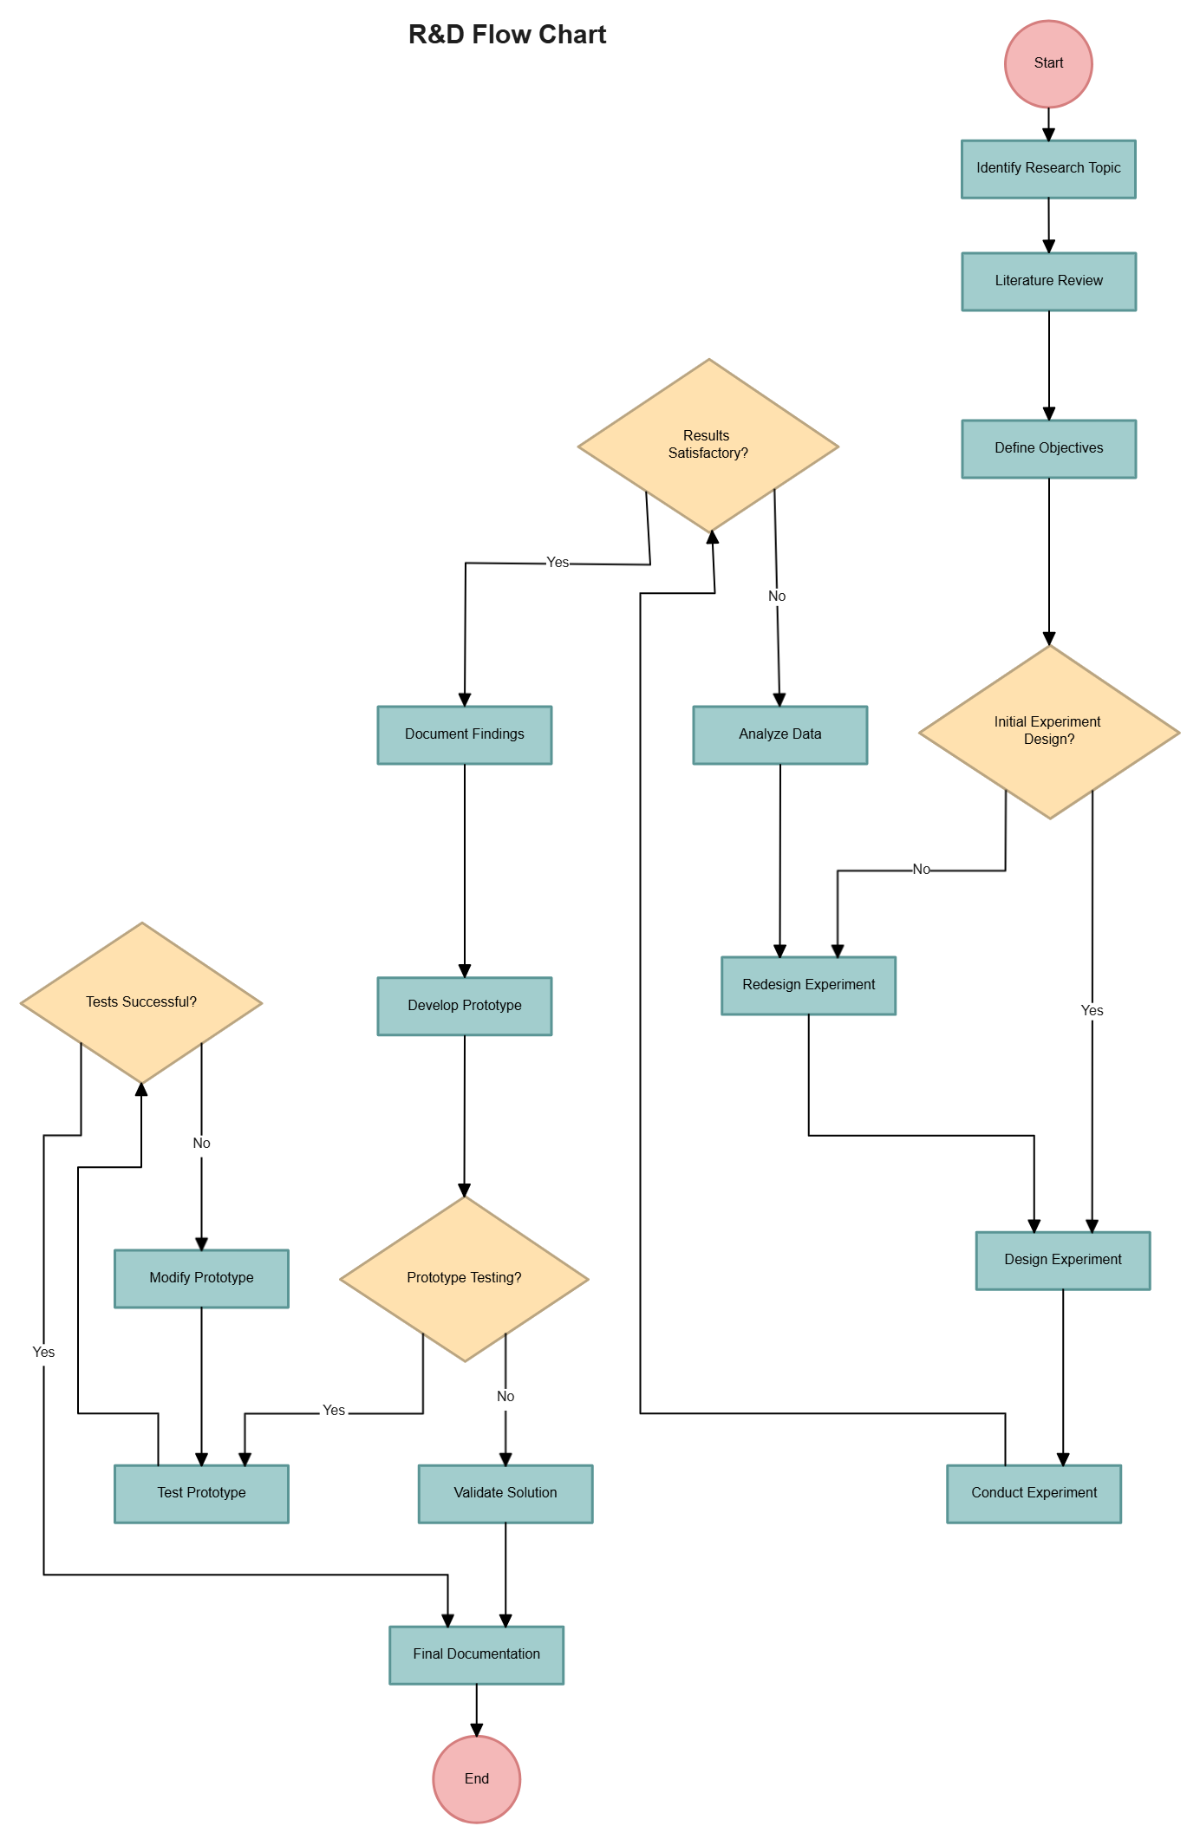
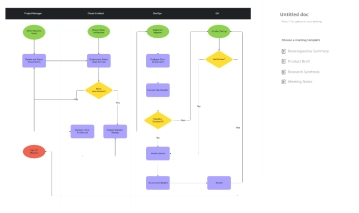
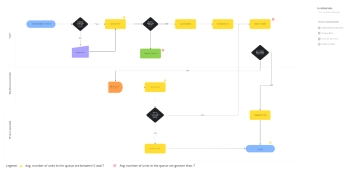
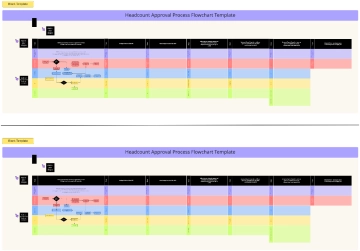
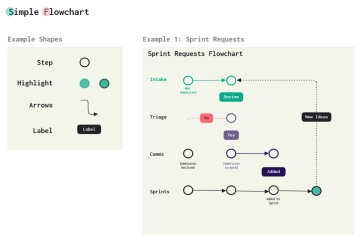
The R&D Flow Chart is a dynamic visual tool crafted to guide researchers and innovators through the full lifecycle of a research and development initiative. From identifying a research topic and conducting a thorough literature review to defining objectives and designing experiments, this chart ensures a methodical approach to discovery. It adapts to both successful and iterative outcomes, offering clear pathways for redesigning experiments, developing prototypes, and validating solutions. Decision points like “Results Satisfactory?” and “Prototype Testing?” help teams assess progress and pivot when necessary. With its structured yet flexible layout, the chart supports continuous improvement and documentation, making it an essential companion for any organization committed to innovation and problem-solving.
