Free Stock Trading Flow Chart
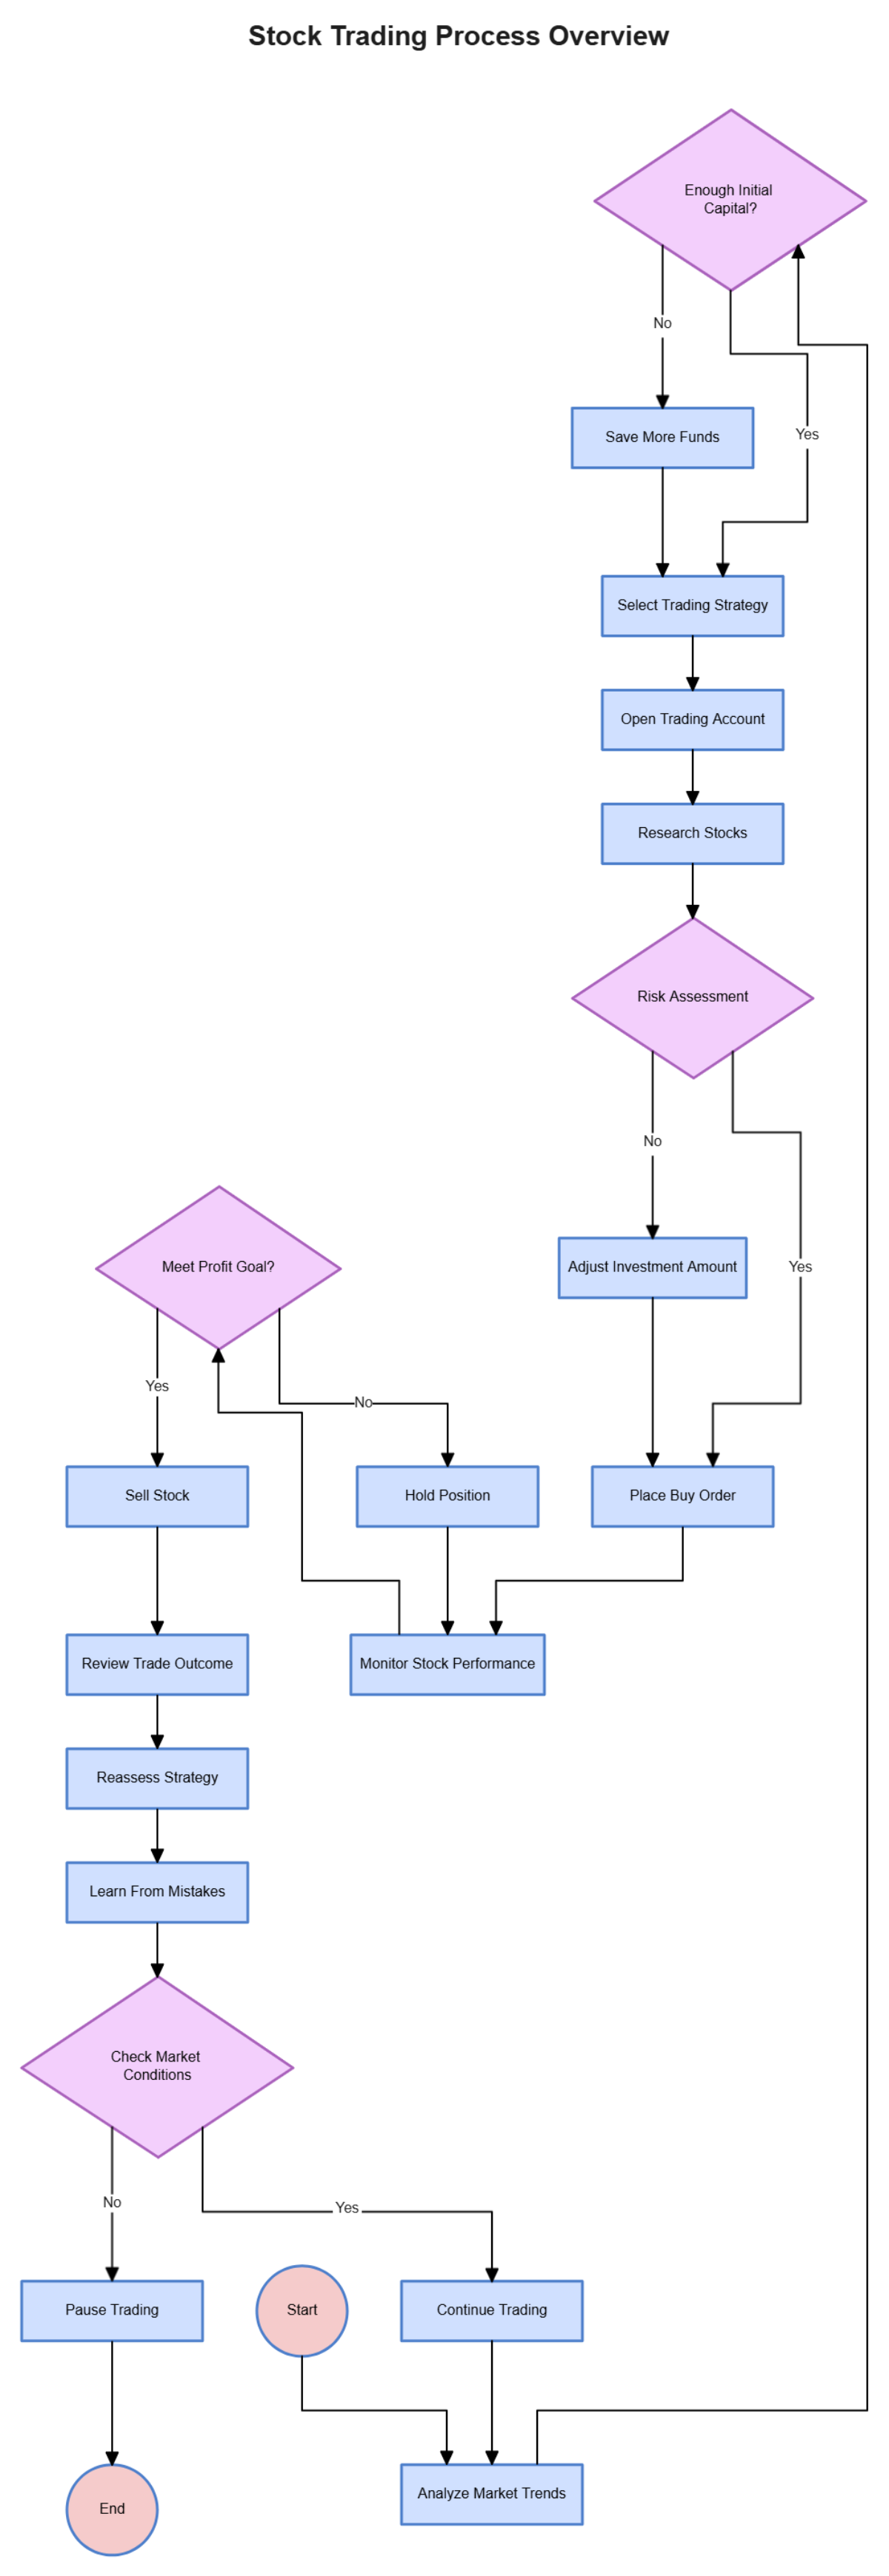
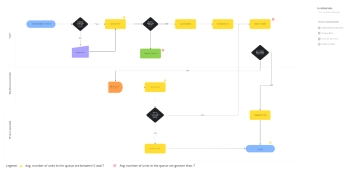
The Stock Trading Flow Chart delivers a comprehensive, decision-oriented overview of the trading lifecycle, guiding users from initial capital assessment to strategic execution and performance review. It begins by evaluating whether sufficient funds are available to initiate trading, then moves through essential steps such as selecting a strategy, opening an account, researching stocks, and conducting a risk assessment. Depending on the outcome, traders either adjust their investment amount or proceed toward profit goals. The chart continues with branching paths for holding positions, placing buy orders, or selling stock, each followed by performance monitoring and strategic reassessment. If goals aren’t met, the flow encourages learning from outcomes and checking market conditions before resuming or pausing trading. This visual framework emphasizes discipline, adaptability, and continuous improvement, making it an ideal tool for both novice and experienced investors seeking clarity in their trading decisions.
