Free Census Flow Chart
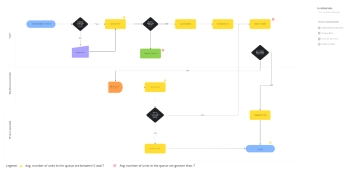
The Census Flow Chart presents a meticulous, data-centric framework for conducting and validating population surveys. It begins with identifying the target population and selecting a data collection method—either through government records or direct surveys—ensuring flexibility based on context and resources. Once data is gathered, it undergoes a quality check to verify accuracy. If discrepancies are found, the process shifts into data cleaning before continuing to outlier detection. Outliers, if present, prompt adjustments to maintain statistical integrity. The refined data is then finalized, followed by report generation and public release. A feedback loop allows for public input, which may trigger revisions and a final review. Approval from the census bureau marks the transition to secure data storage and preparation for future census cycles. This flowchart transforms a complex, multi-phase operation into a transparent, iterative system that prioritizes precision, accountability, and public trust.

