Free Data Flow Diagram Template
Free Download this Free Data Flow Diagram Template Design in Lucidchart Format. Easily Editable, Printable, Downloadable.
Lucidchart Data Flow Diagram Templates: Simplify Process Mapping and Visualize Data Movements
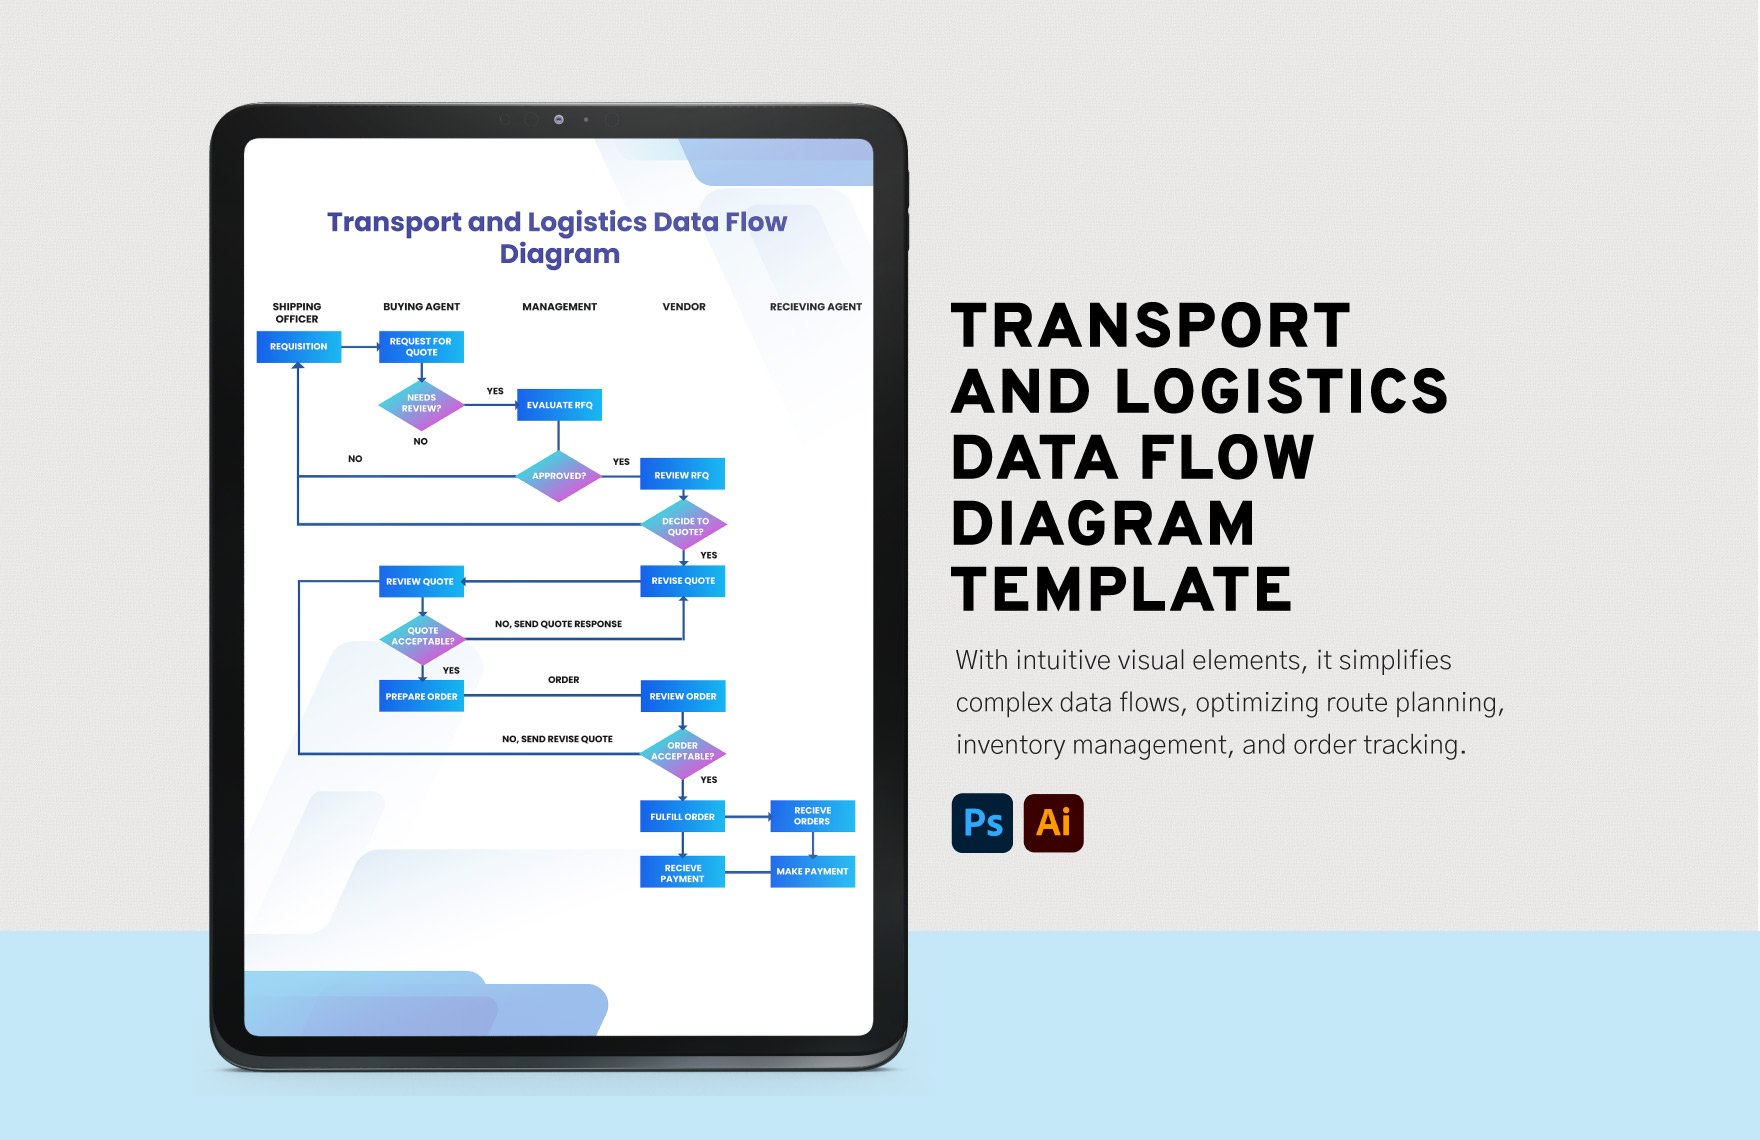
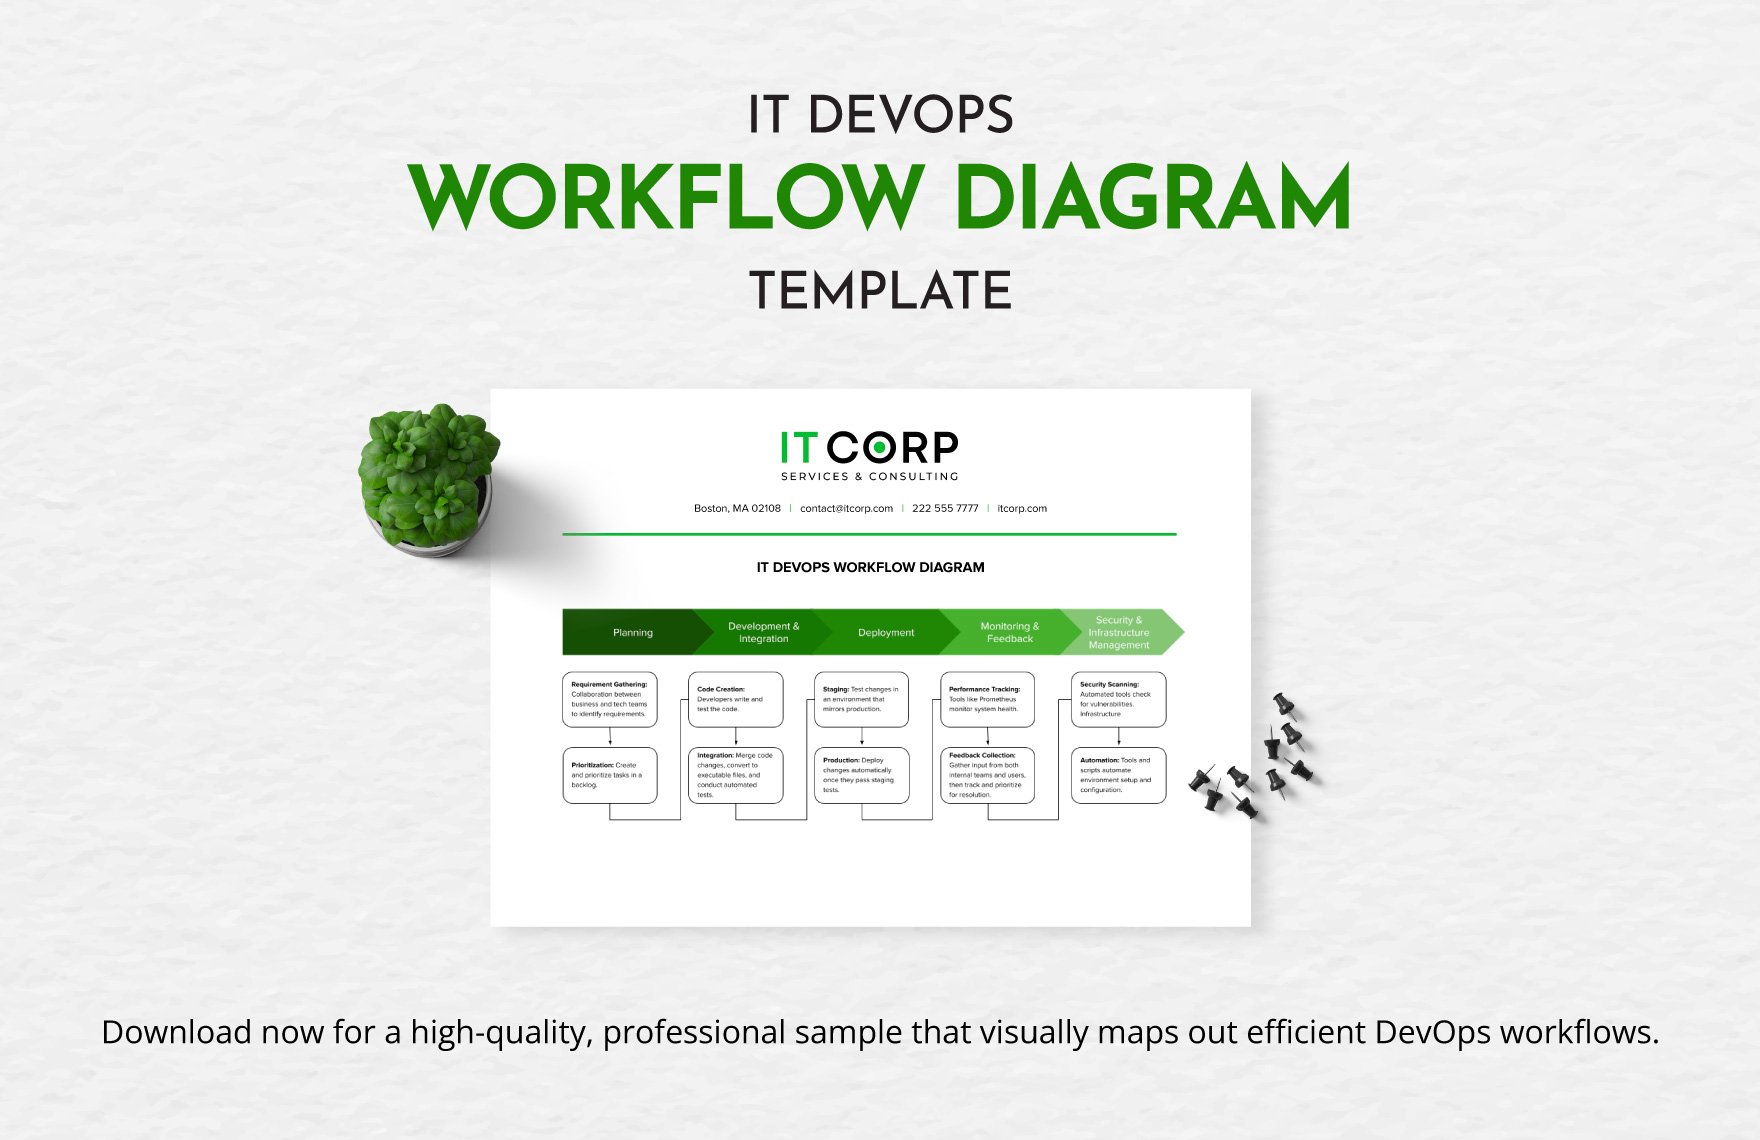
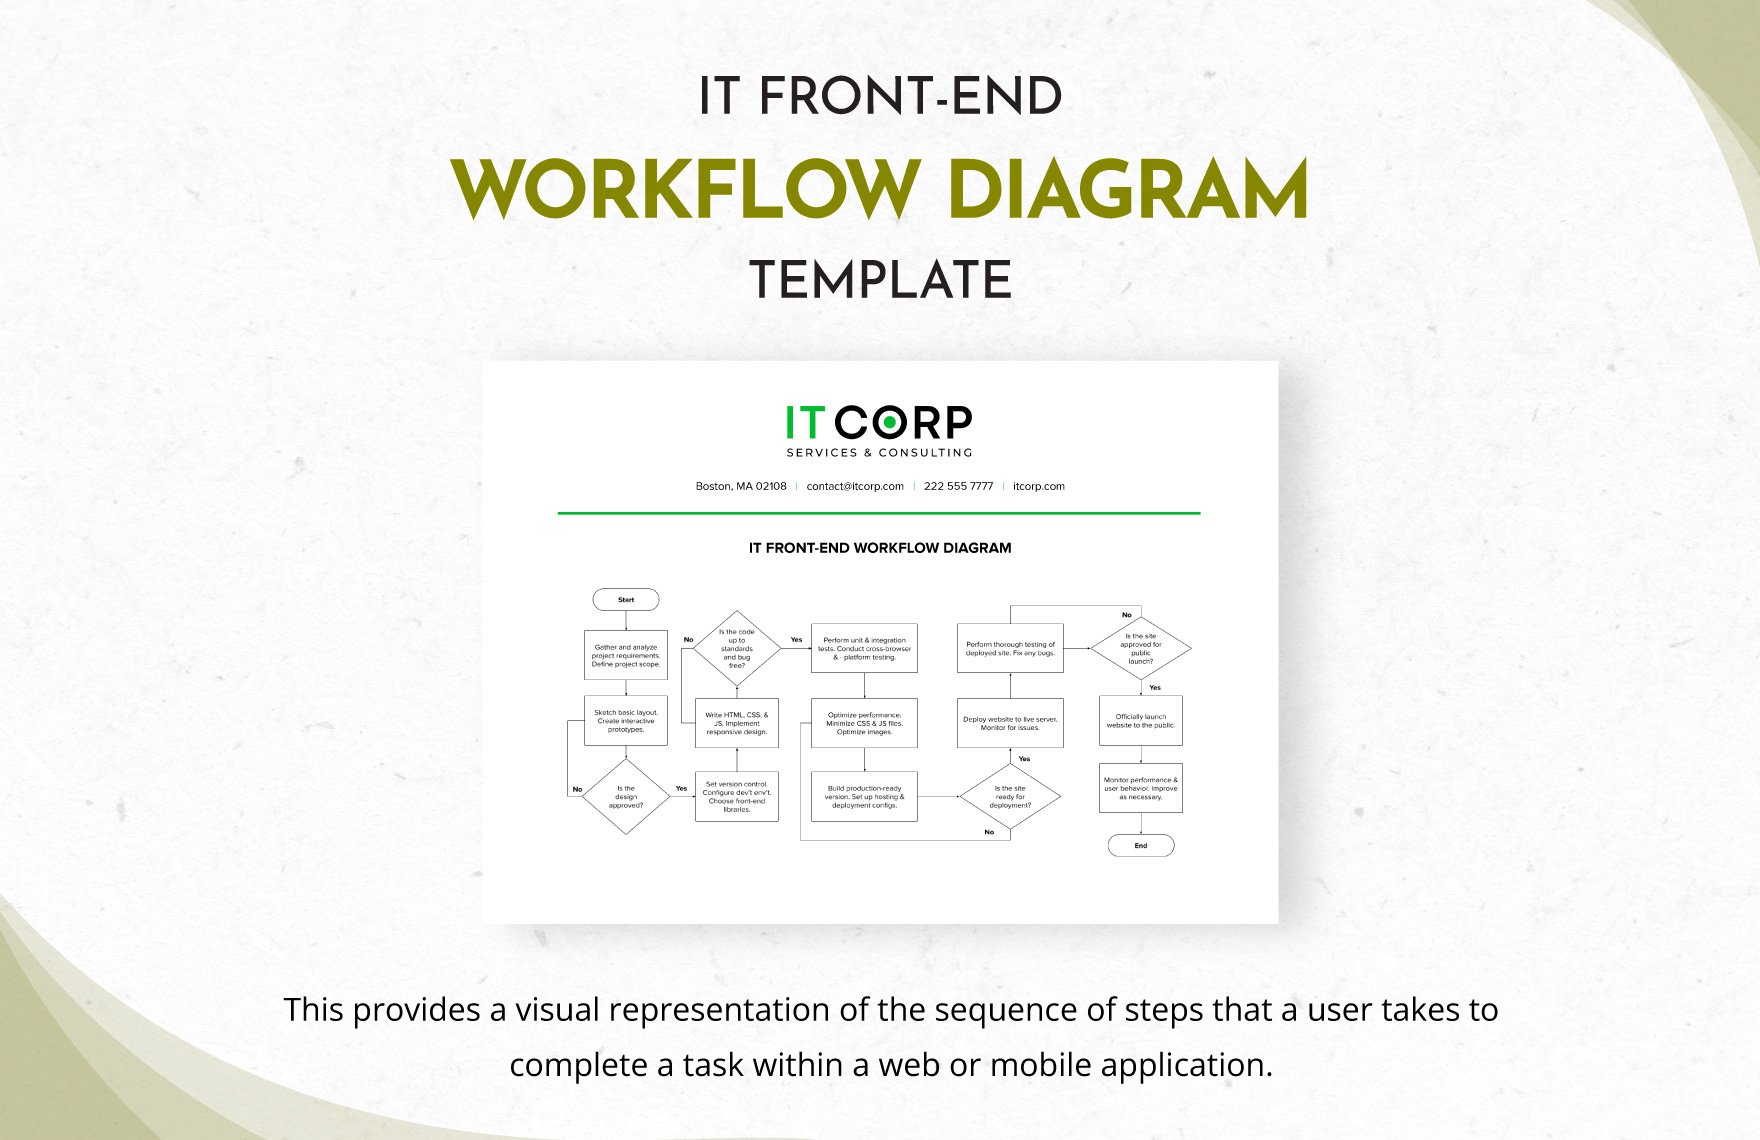
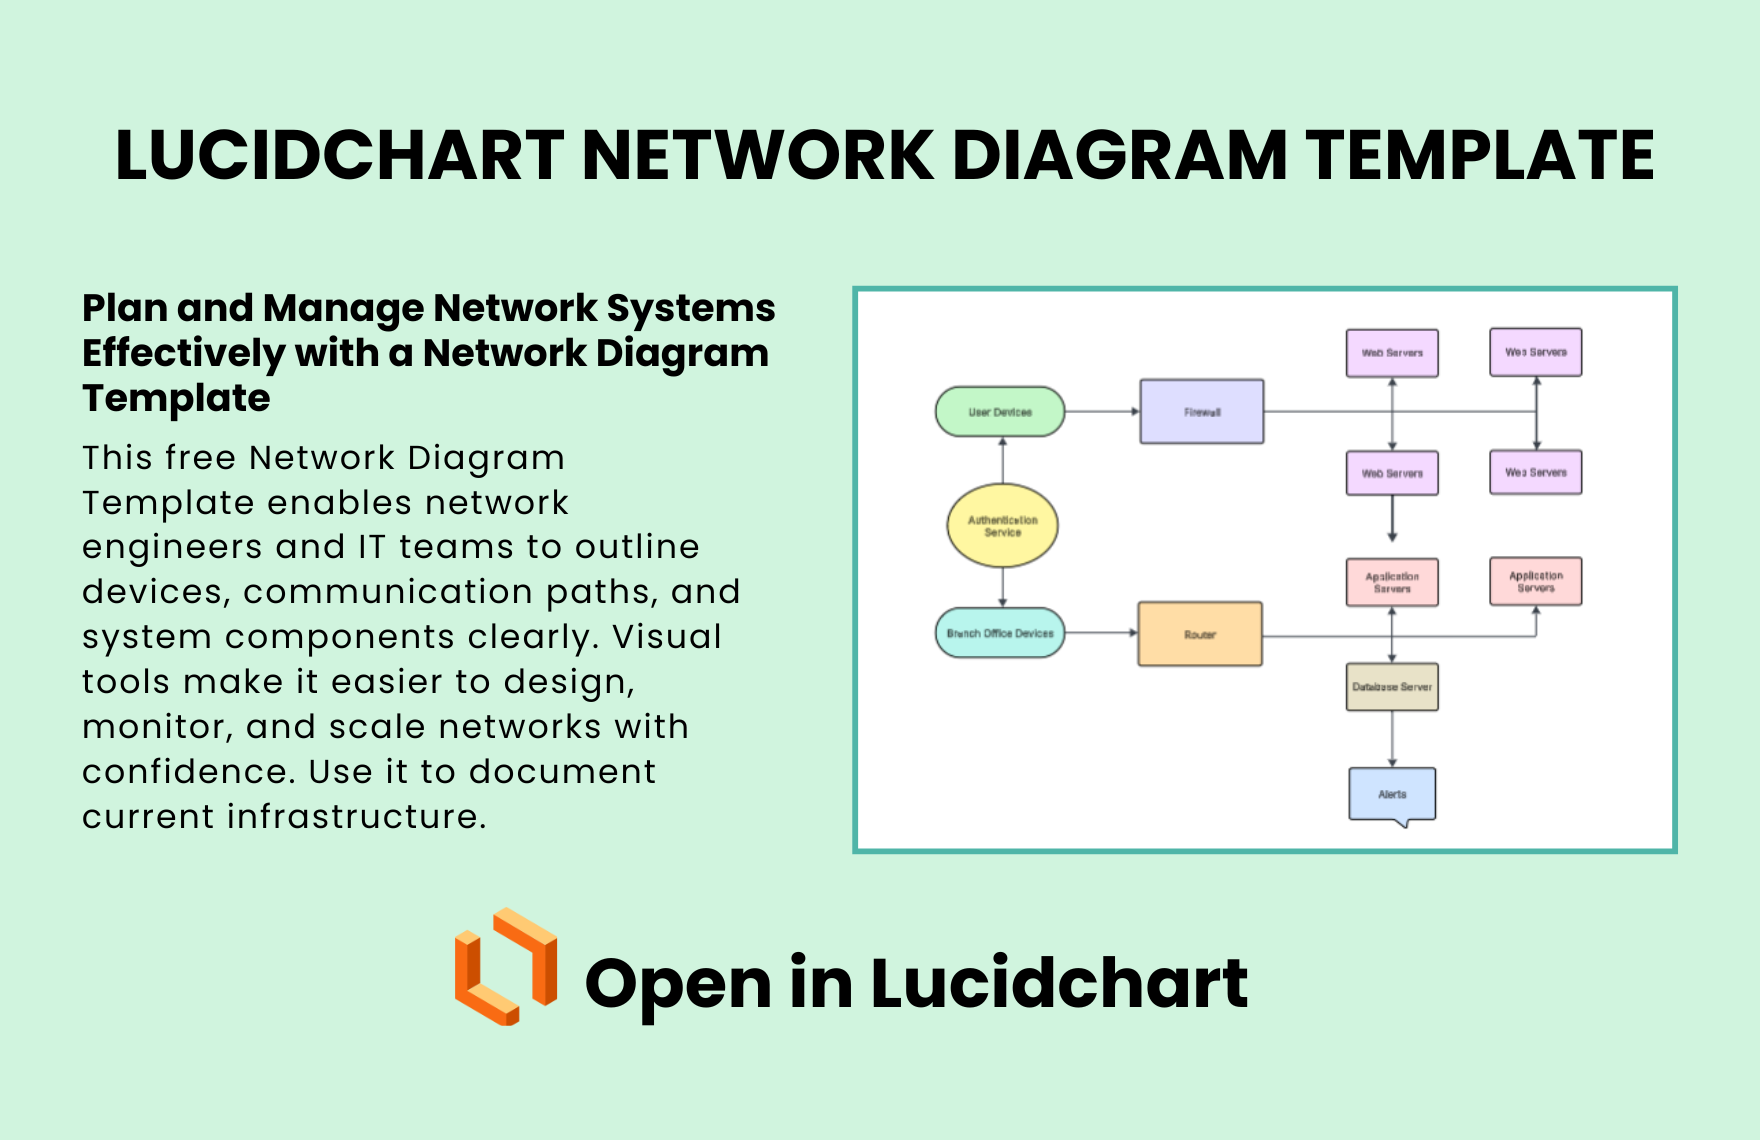
Lucidchart’s Data Flow Diagram Templates are an excellent way to represent how data flows through systems, processes, and interactions. These templates offer clear and concise visualizations of data inputs, processes, and outputs, making them ideal for illustrating business systems, software workflows, or organizational data exchanges. Choose from 6 distinct variations that best suit your specific diagramming needs.
Why Choose Lucidchart Data Flow Diagrams?
-
Visualize Data Movement: Clearly map how data moves within your system, from collection to processing and final output.
-
Multiple Design Options: Select from 6 different diagram styles to best represent your data flow scenario.
-
Tailored for Simplicity: Lucidchart’s intuitive interface allows you to create detailed yet simple diagrams for complex systems.
-
Collaborative and Shareable: Easily share your diagrams with teams for real-time collaboration and updates.
-
Perfect for All Industries: Ideal for software development, business process mapping, system design, and more.
Choose Your Ideal Diagram Variation:
-
Variation 1: Basic flow design with simple rectangular processes and rounded data inputs, perfect for straightforward systems.
-
Variation 2: Detailed flow with clear arrows and decision points, great for illustrating dynamic or conditional data flows.
-
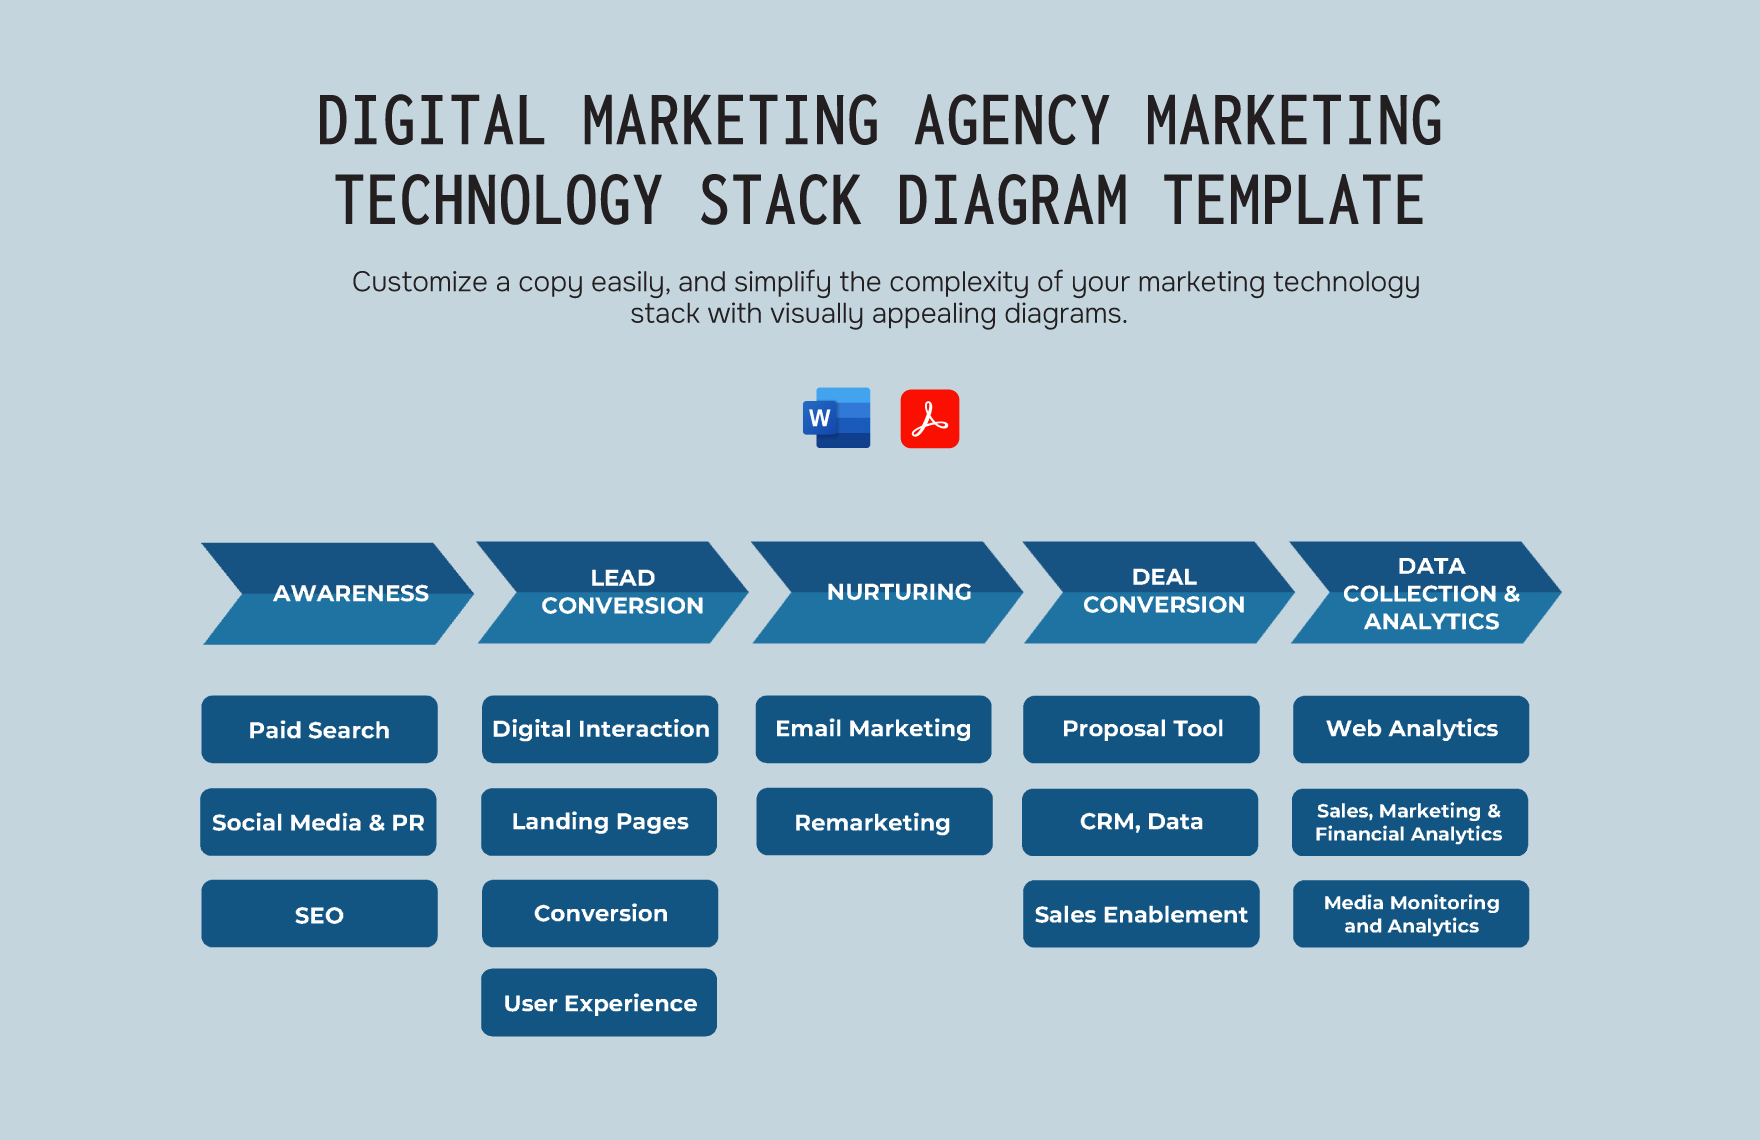
Variation 3: Color-coded diagram with distinct process stages, suited for complex system workflows or product tracking.
-
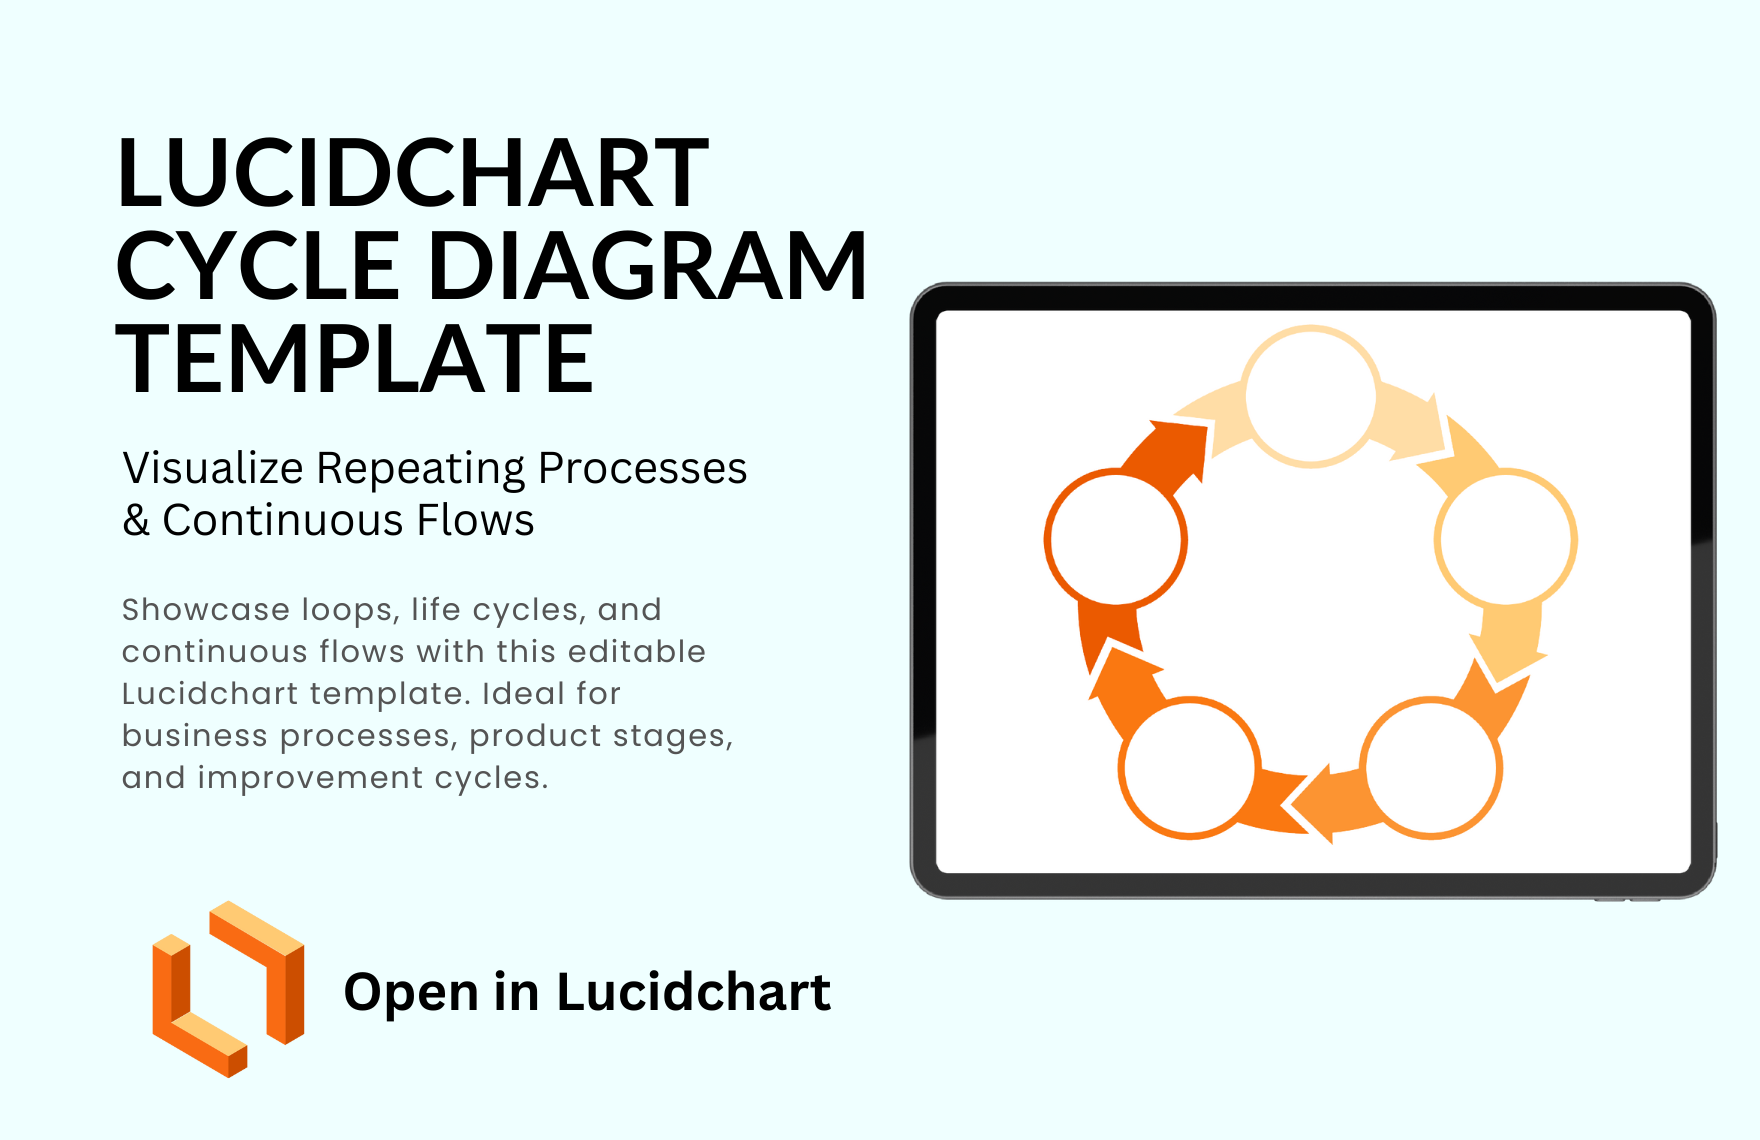
Variation 4: Interactive and circular layout, showing continuous data flow in a system with feedback loops or recurring processes.
-
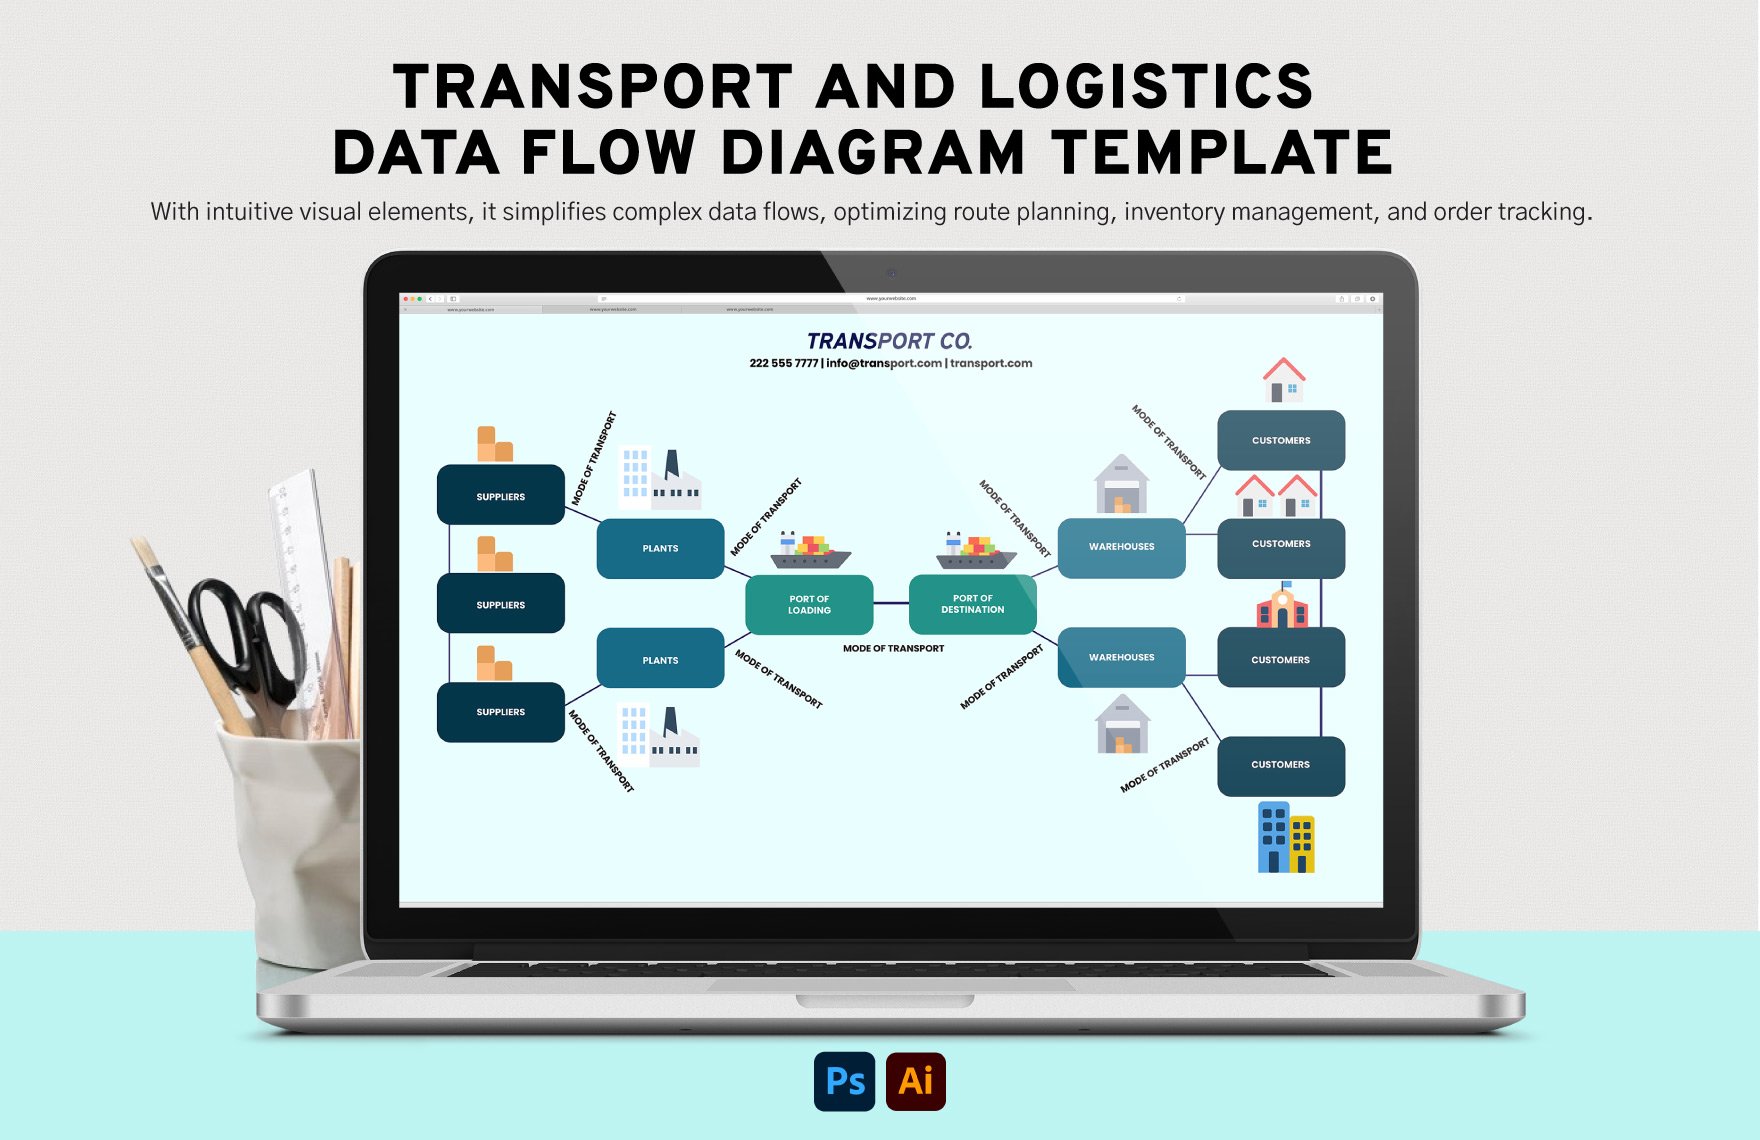
Variation 5: System-centric flowchart focusing on external data sources and internal processing, ideal for business data mapping.
-
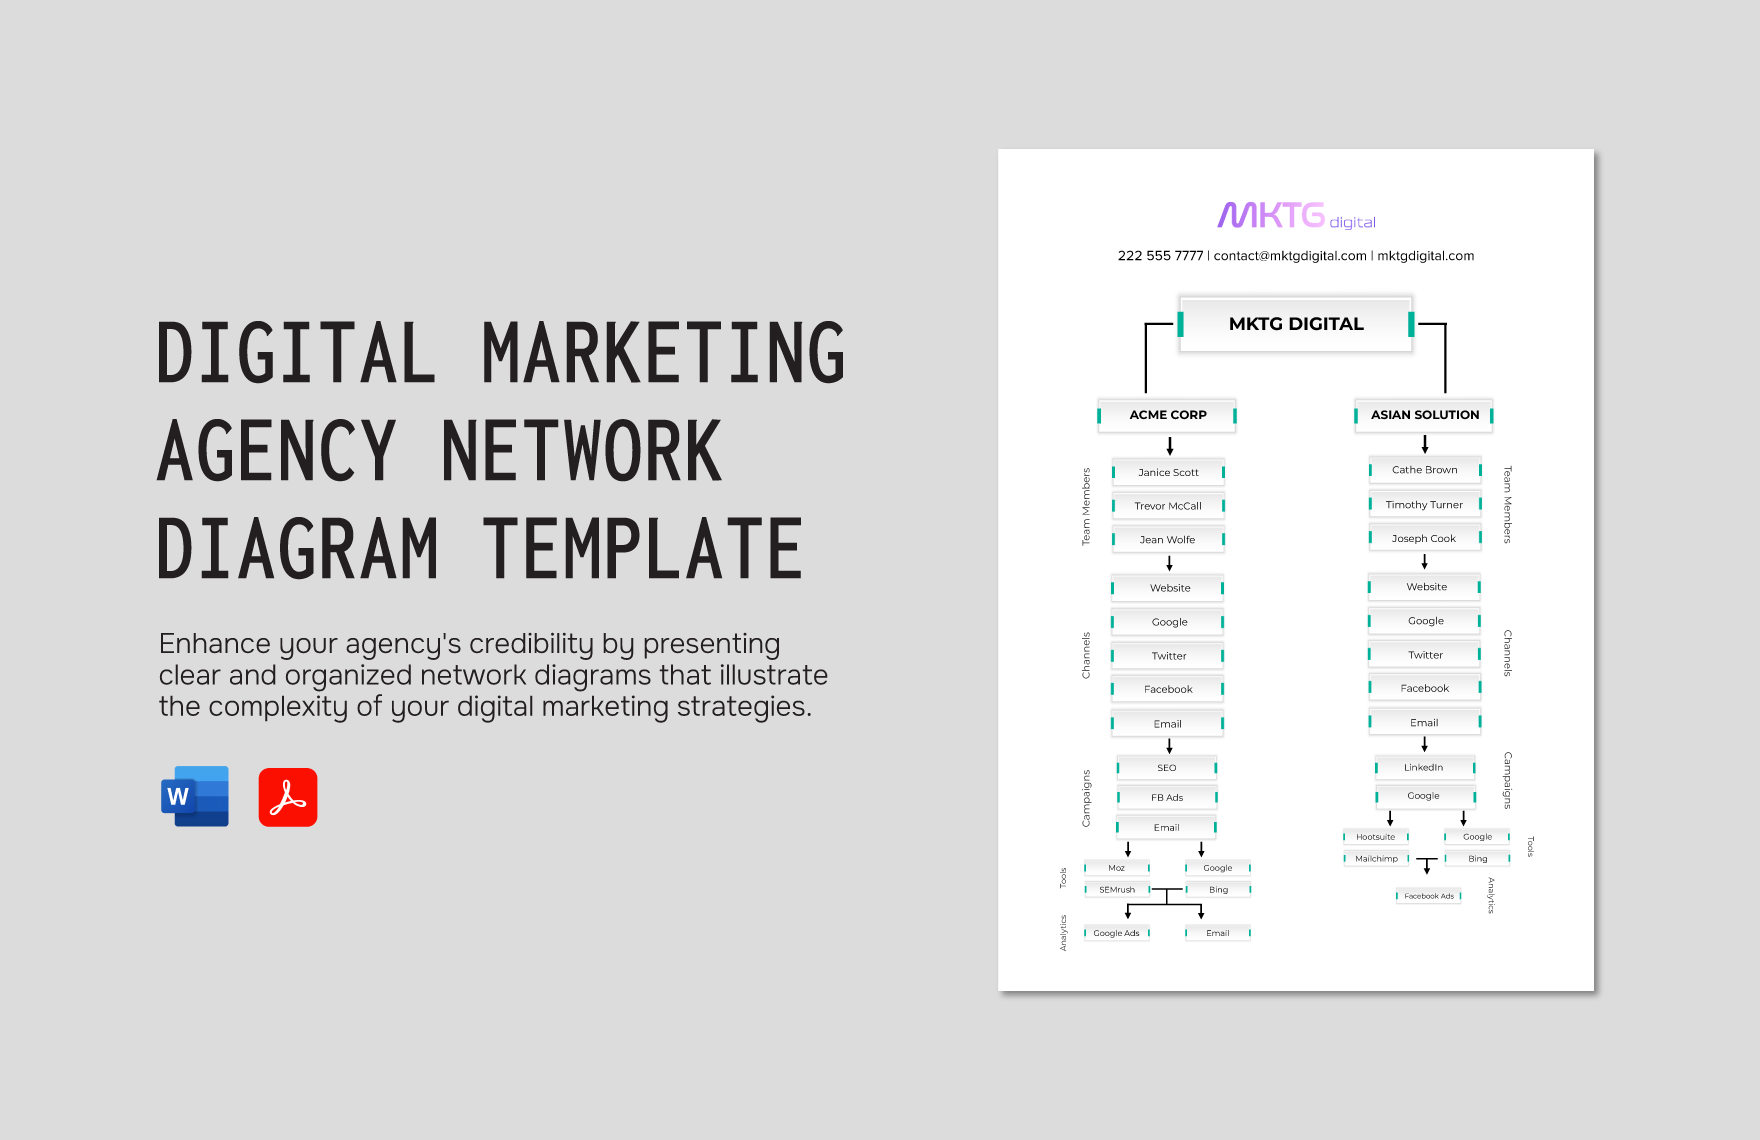
Variation 6: Complex multi-level diagram, breaking down intricate workflows and system interactions, perfect for enterprise-level projects.
Use Cases:
-
Business Process Mapping: Visualize business operations and data exchange between departments, systems, or applications.
-
Software Development: Create data flow diagrams for system architecture, backend processes, or API workflows.
-
System Design: Illustrate how data flows between different components of a system, useful for IT projects or systems analysis.
-
Project Management: Map out data dependencies and workflows for tracking deliverables, tasks, and resources.
-
Educational Purposes: Teach complex systems and process flows in an easily understandable diagram format.
Compatibility:
-
Lucidchart
-
Lucidspark
-
Desktop & Web Access
-
Real-time Collaboration

