Free Venn Diagram Template
Free Download this Free Venn Diagram Template Design in Lucidchart Format. Easily Editable, Printable, Downloadable.
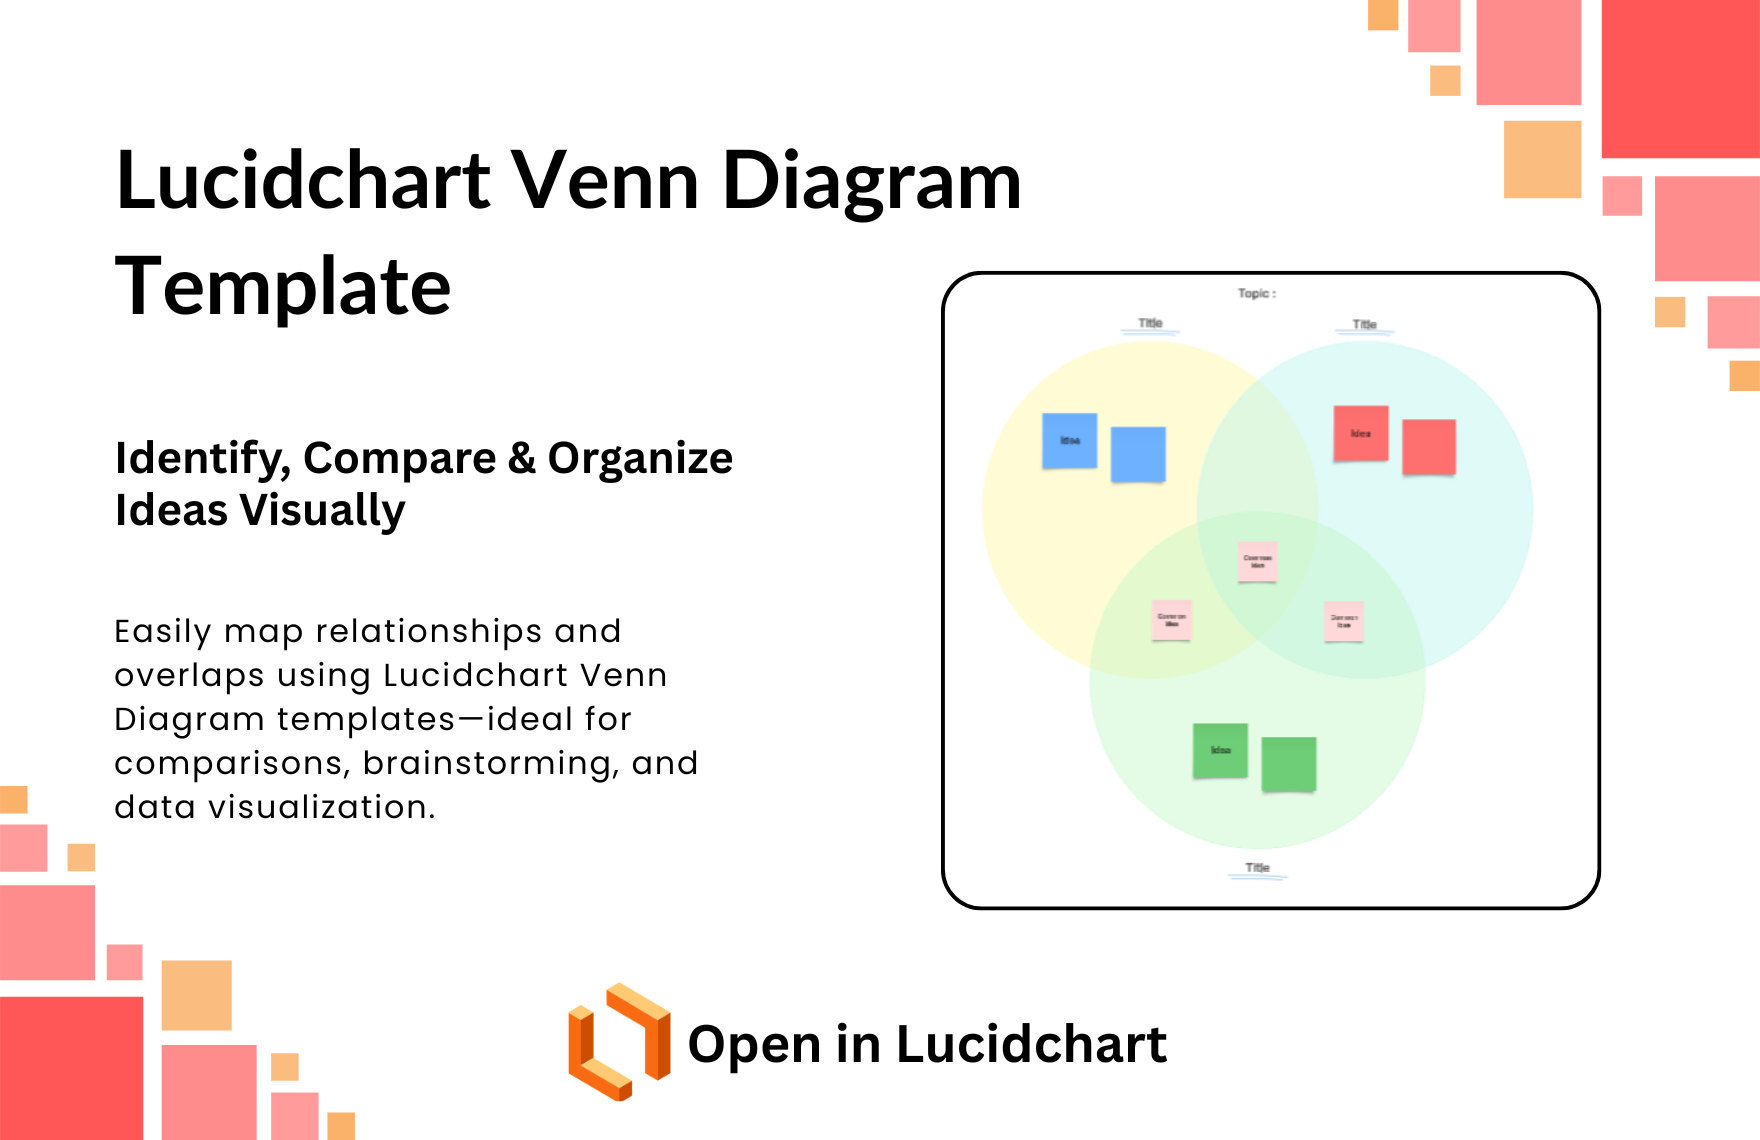
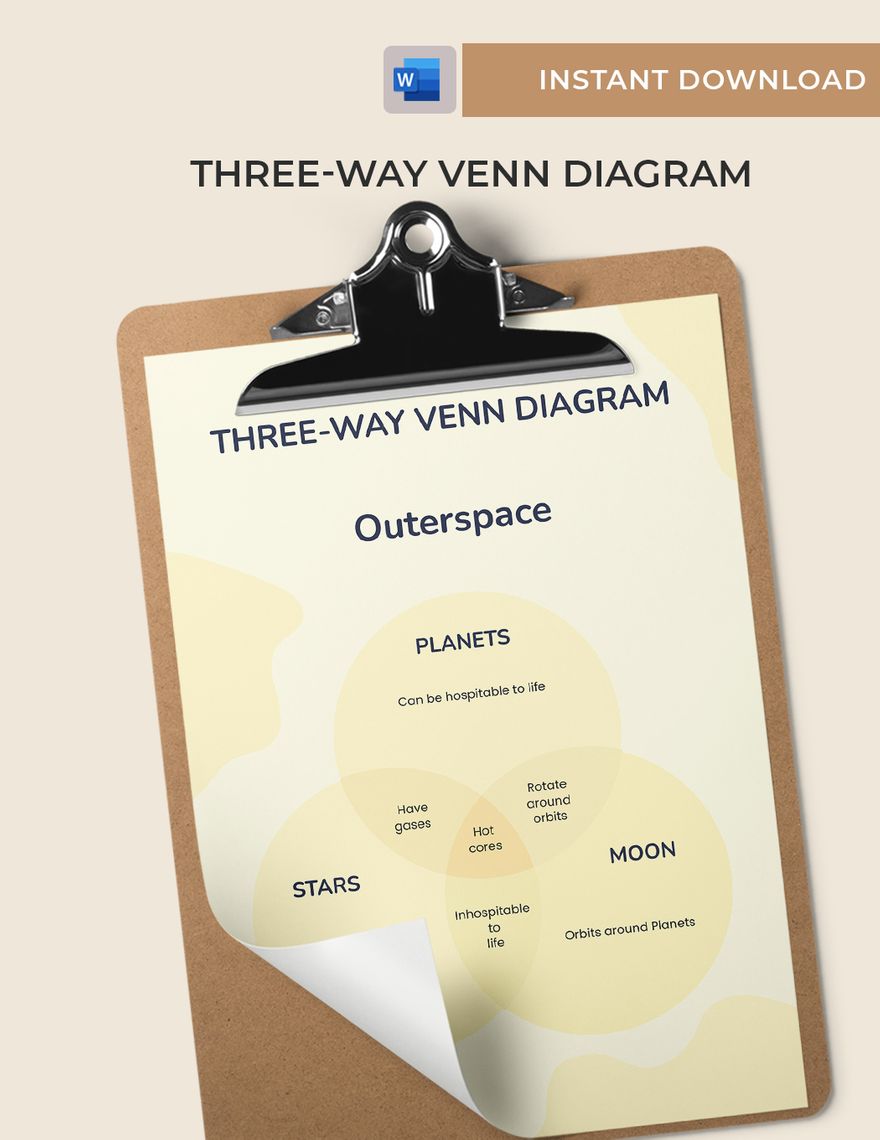
Lucidchart's Venn Diagram Templates offer a powerful way to visualize and compare multiple sets, categories, or concepts, allowing you to represent the overlap and relationship between different elements. These templates are invaluable for decision-making, problem-solving, and data analysis, helping you easily visualize complex relationships. With six unique variations to choose from, you can select the style that best fits your needs and customize it to effectively illustrate overlapping and unique elements. Whether you're evaluating market segments, comparing product features, or organizing ideas, these templates provide a flexible, easy-to-use solution for your project.
Key Advantages of Using Lucidchart Venn Diagram Templates:
-
Easy Comparison: Compare and contrast two or more sets to identify commonalities, differences, and unique elements.
-
Flexible Customization: Modify colors, labels, and shape sizes to suit your project needs, providing a customized visual representation.
-
Clarity in Decision-Making: Make complex decisions simpler by laying out overlapping and unique components in a clear, easy-to-read diagram.
-
Collaborative Features: Lucidchart allows real-time editing, so you can work with your team and share your Venn diagrams for feedback or presentation.
-
Versatile Applications: From business analysis to educational content, Venn diagrams can be applied in many contexts, making them an essential tool in any workplace or classroom.
6 Template Styles to Choose From:
-
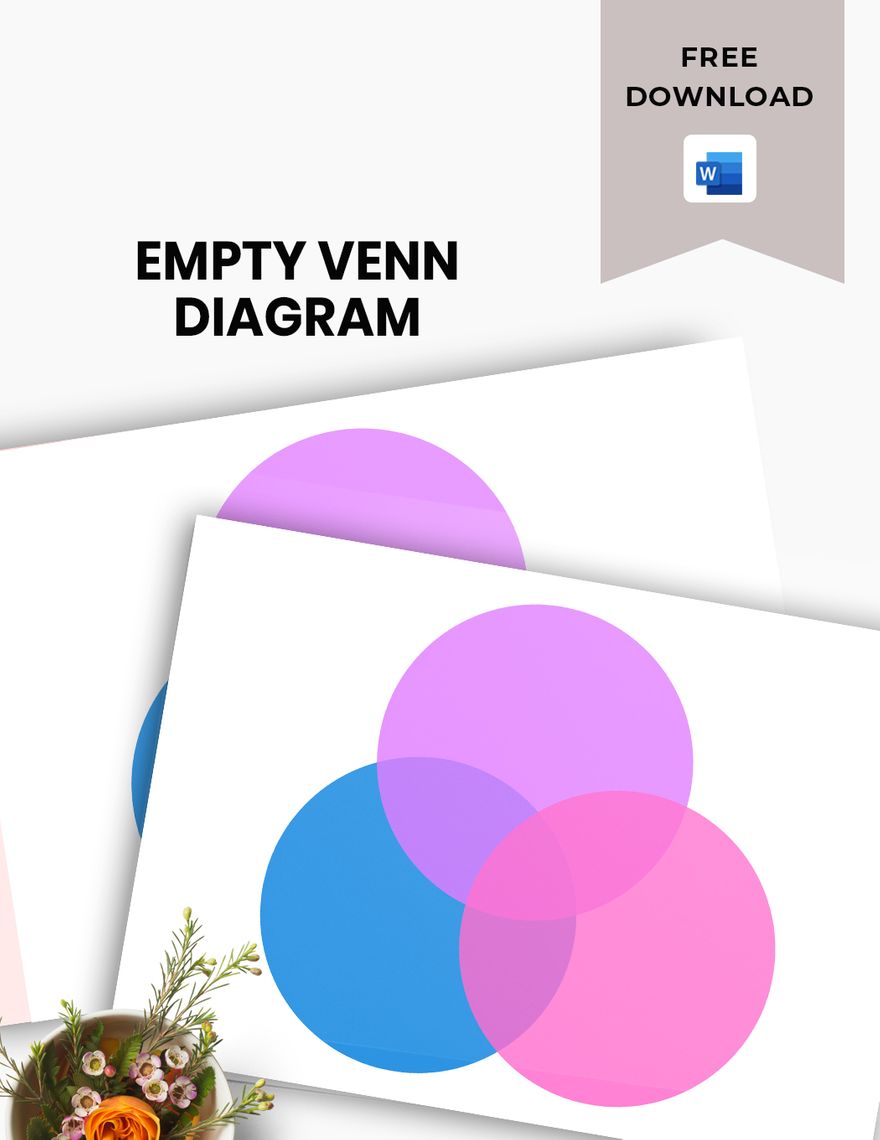
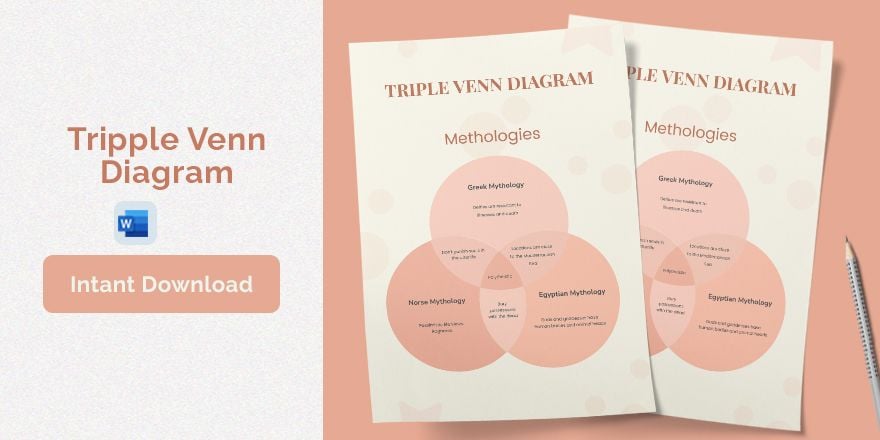
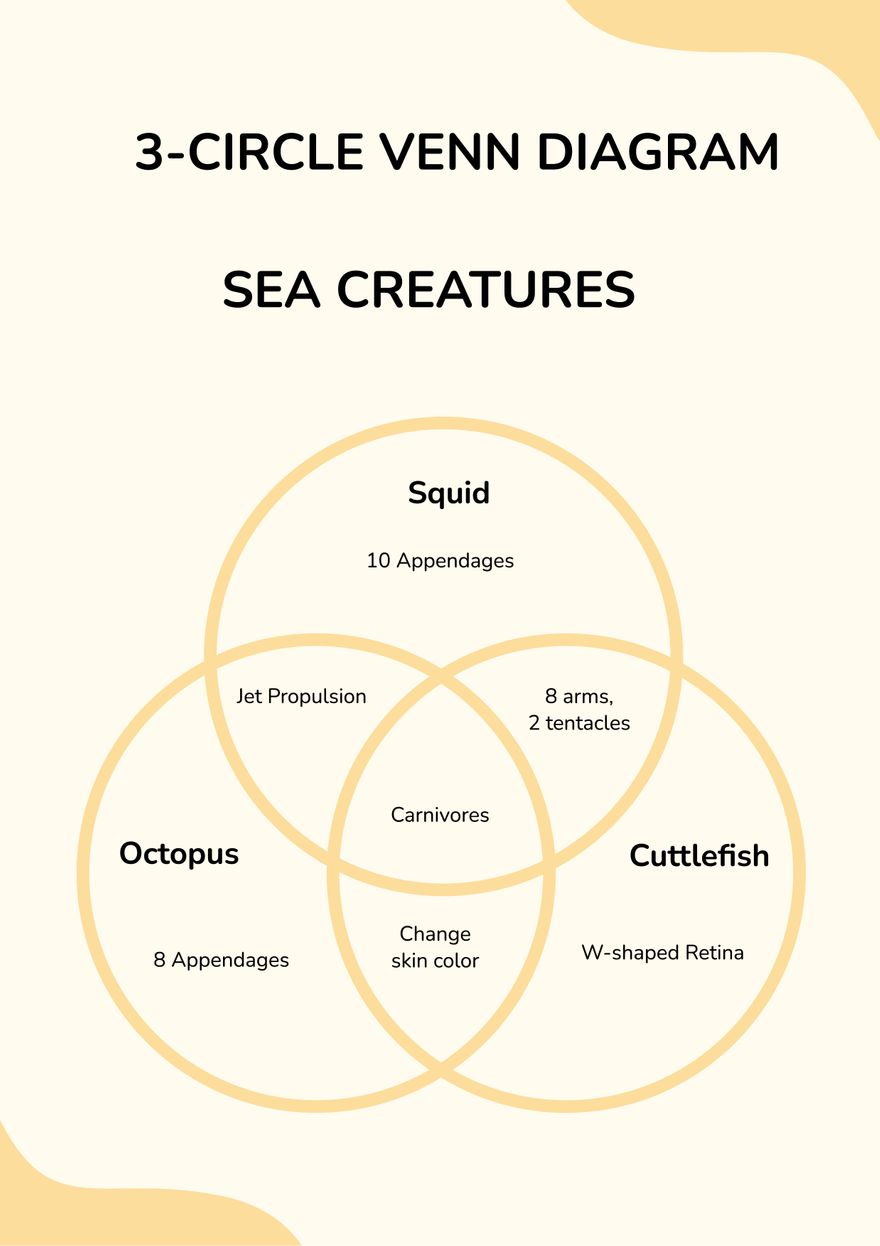
Basic Overlap Venn Diagram: A simple three-circle diagram that is perfect for comparing three distinct sets or categories, showing clear intersections.
-
Four-Set Venn Diagram: This variation includes four intersecting circles, useful for more detailed comparisons across four different elements or groups.
-
Category-Based Venn Diagram: Categorize and compare groups of related items (such as products or services), using color coding to highlight similarities and differences.
-
Aspect-Based Venn Diagram: Ideal for showing different aspects or attributes of a concept, helping to visualize how each element intersects with others.
-
Core Concept Venn Diagram: Aimed at visualizing the core concept or main idea that lies at the intersection of multiple contributing factors.
-
Grouped Venn Diagram: Groups several smaller Venn diagrams together to illustrate the relationship between more than two sets, making it useful for more complex data analysis.
Where These Templates Help Most:
-
Business Analysis: Use Venn diagrams to compare competitors, product features, market segments, or customer needs to find common ground and areas for differentiation.
-
Decision-Making Processes: Help stakeholders visualize decision factors, like cost vs. value, impact vs. effort, or risk vs. reward, to facilitate easier decision-making.
-
Data Analysis & Research: Visualize data points or concepts to better understand correlations, overlaps, and gaps in your research or data sets.
-
Education & Teaching: Perfect for comparing topics, ideas, or concepts in the classroom, making it easier for students to grasp overlapping subjects or theories.
-
Creative Brainstorming: During brainstorming sessions, Venn diagrams help visually capture and compare ideas, providing clarity on where ideas intersect or differ.
Compatibility:
-
Lucidchart
-
Lucidspark
-
Desktop & Web Access
-
Real-time Collaboration
