Free Fishbone Diagram Template
Free Download this Free Fishbone Diagram Template Design in Lucidchart Format. Easily Editable, Printable, Downloadable.
Free Lucidchart Fishbone Diagram Template: Uncover Root Causes and Visualize Problem-Solving Strategies
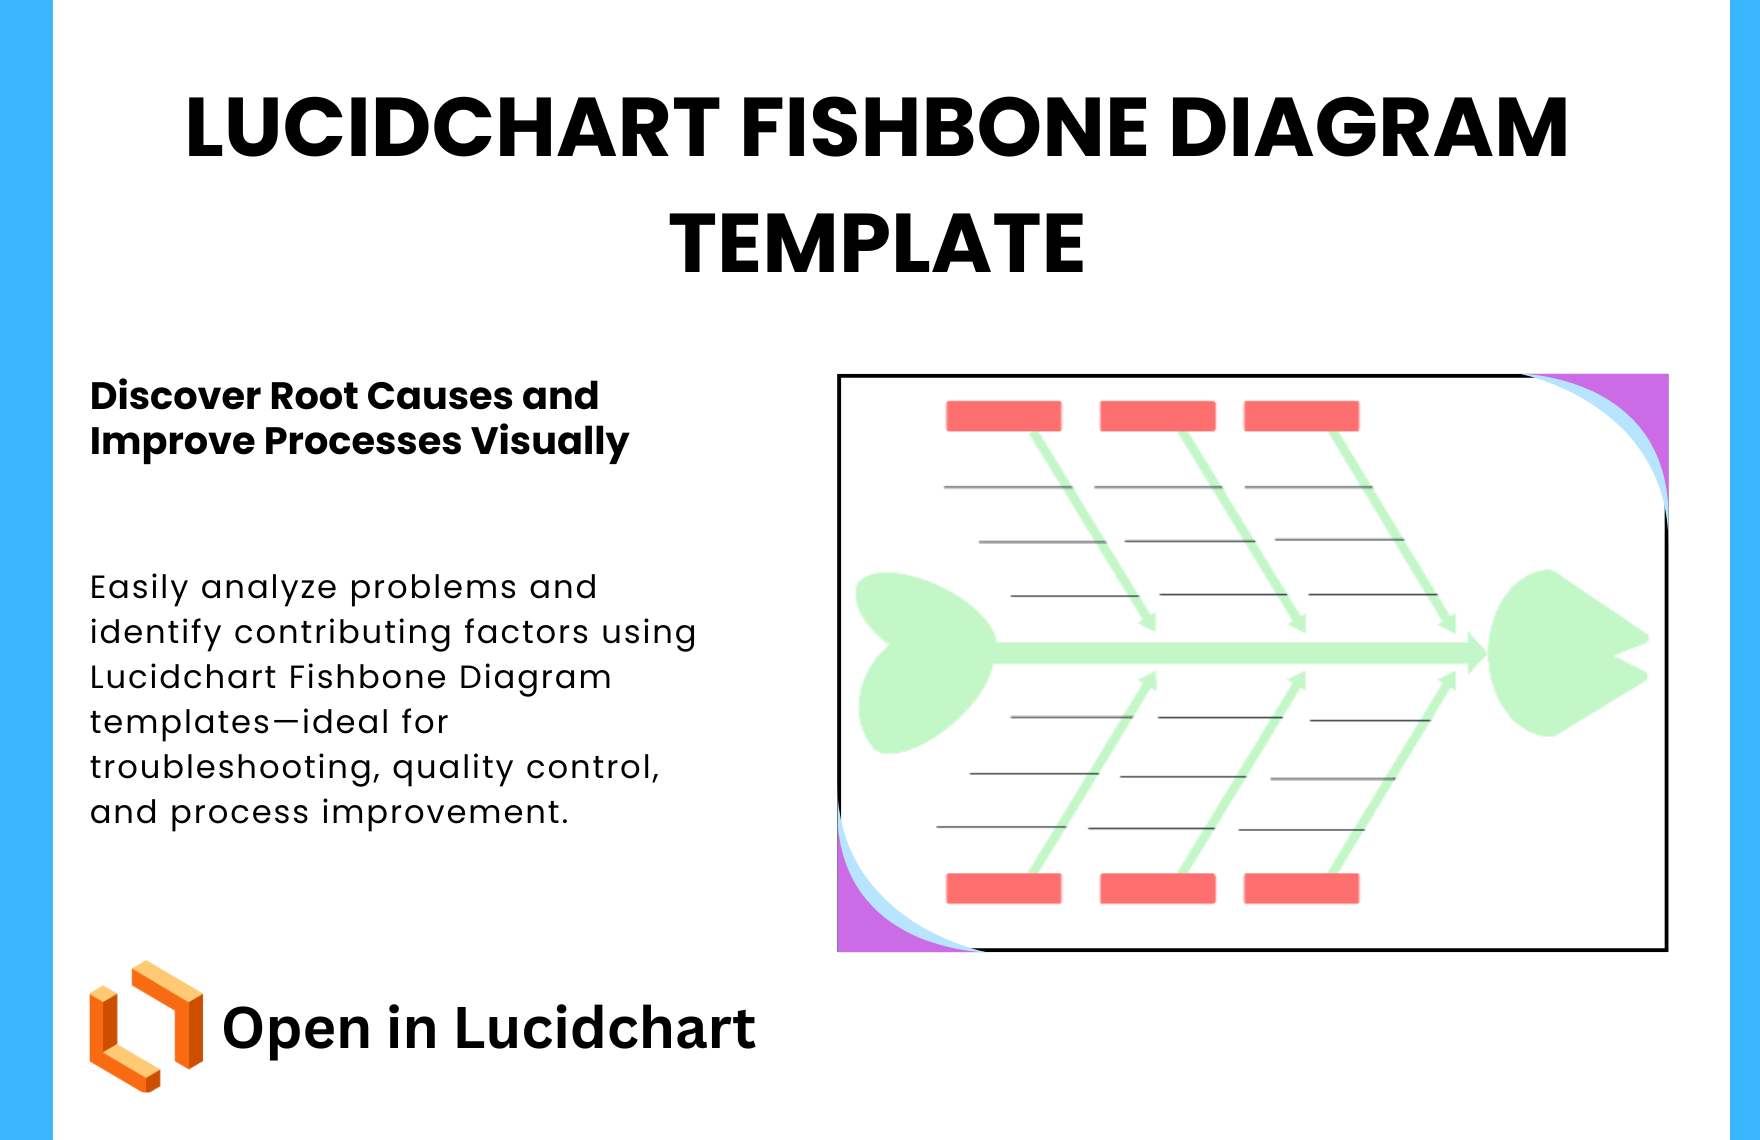
Lucidchart’s Fishbone Diagram Templates (also known as Ishikawa or Cause-and-Effect diagrams) are an excellent tool for identifying the root causes of issues in any process, product, or system. These templates provide a structured, visual method for brainstorming and analyzing potential causes of problems in order to develop effective solutions. With five different variations, you can choose the style that best suits your analysis needs, and customize it for a variety of situations—whether you’re troubleshooting in a team setting, mapping out complex processes, or conducting a deep dive into a specific challenge.
Key Advantages of Fishbone Diagrams:
-
Identify Root Causes: Uncover and analyze the root causes of problems or issues by visually mapping the factors that contribute to the outcome.
-
Structured Problem-Solving: Organize complex problems into categories to ensure that no potential cause is overlooked.
-
Collaborative Approach: Fishbone diagrams foster teamwork by allowing teams to brainstorm and visualize their insights on the same platform in real time.
-
Clear Cause-and-Effect Relationships: Clearly demonstrate how various elements or factors are connected to the central problem or effect.
-
Easy Customization: With Lucidchart, you can adjust the diagram’s labels, categories, and branches, tailoring it to your specific problem-solving needs.
5 Template Styles to Choose From:
-
Traditional Fishbone Layout: A classic version of the fishbone diagram with straightforward cause-and-effect categorization, perfect for simple problem analysis.
-
Categorical Fishbone Diagram: Includes customized categories for a more structured approach to problem-solving, such as "People," "Processes," "Equipment," and "Materials."
-
Multi-Branch Fishbone: Expands on the traditional model by adding additional branches for more complex issues with multiple causes to explore.
-
Reverse Fishbone Diagram: Inverted design where the central issue is placed at the top and branches grow downward—ideal for presenting to audiences.
-
Color-Coded Fishbone: Each branch is assigned a different color to represent various factors or severity, offering visual clarity and easy prioritization during discussions.
Where These Templates Help Most:
-
Quality Improvement Initiatives: Use fishbone diagrams to identify underlying causes of quality issues in manufacturing, software development, or customer service.
-
Process Optimization: Evaluate process inefficiencies by mapping out potential root causes of delays, bottlenecks, or errors.
-
Team Collaboration and Brainstorming: Collaborate with team members in real time to visualize the problem and find effective solutions through a shared fishbone diagram.
-
Troubleshooting and Problem-Solving: Quickly analyze problems in various contexts—from product defects to service disruptions—by identifying the various causes contributing to the issue.
-
Strategic Planning: Apply fishbone diagrams to strategize and evaluate the potential causes and effects of business challenges, aiding in decision-making.
Compatibility:
-
Lucidchart
-
Lucidspark
-
Desktop & Web Access
-
Real-time Collaboration
