Free Plot Diagram Template
Free Download this Free Plot Diagram Template Design in Lucidchart Format. Easily Editable, Printable, Downloadable.
Free Lucidchart Plot Diagram Template: Visualize Your Data’s Journey
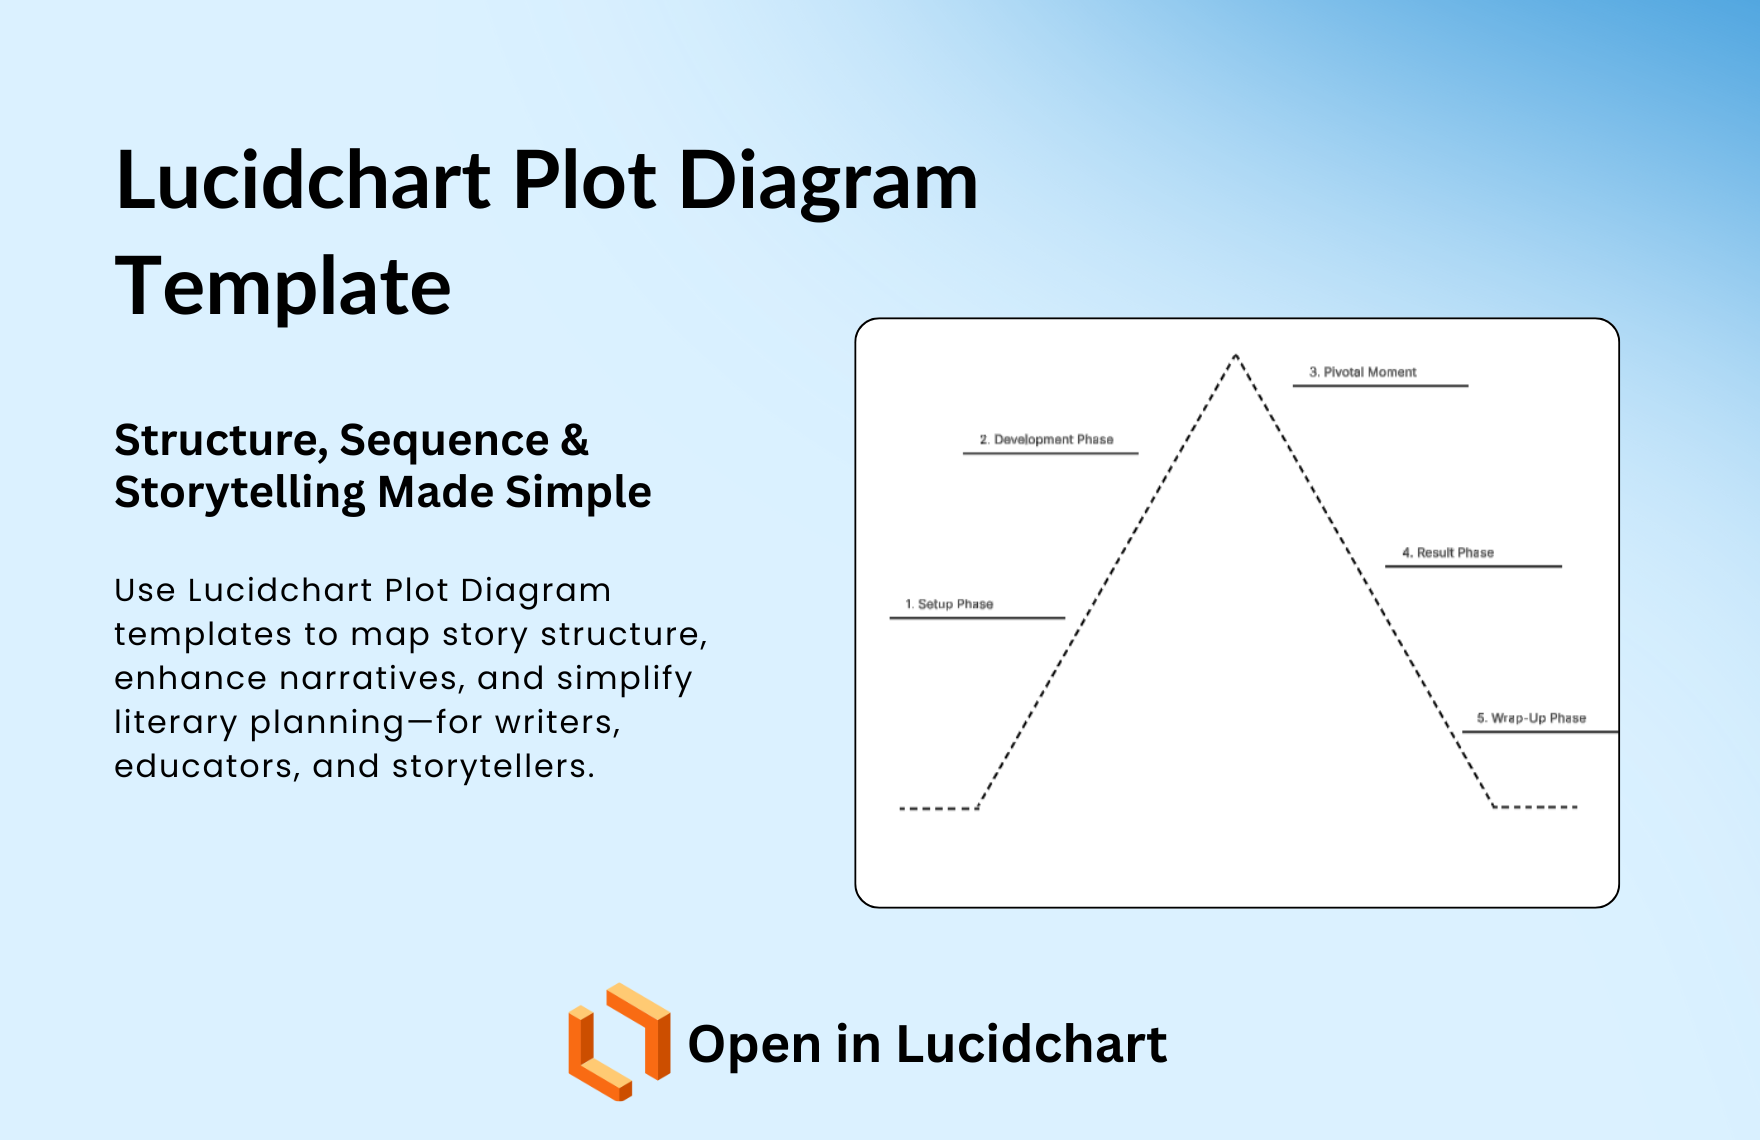
Lucidchart’s Plot Diagram Templates are designed to help you visualize the progression of data, trends, or events over time. Whether you're mapping out a storyline, analyzing project timelines, or illustrating complex processes, these templates make it easy to break down and present your data in a visual format. With five distinct variations to choose from, you can select the best style to match your needs and start editing quickly.
Key Benefits of Using Plot Diagrams:
-
Track Data Progression: Visualize the flow or progression of data, ideas, or events over time, helping you analyze trends or developments clearly.
-
Dynamic Storytelling: Ideal for showcasing a narrative, whether it's for business analysis, academic presentations, or creative projects.
-
Flexible Design: Customize the plot lines, add markers, or adjust the overall layout to better suit your specific use case.
-
Enhanced Understanding: Convert complex or abstract information into simple, digestible plots, ensuring that your audience can easily follow the progression.
-
Real-time Collaboration: Share your plot diagrams with teams or stakeholders to receive instant feedback or make collaborative adjustments.
5 Template Styles to Choose From:
-
Linear Plot Diagram: A simple, straightforward style where data is represented along a continuous line, making it ideal for showing change or progression over time.
-
Exponential Growth Plot: Perfect for illustrating growth or decline, this template showcases data that increases or decreases rapidly over a given period.
-
Split Plot Diagram: Used for contrasting two sets of data or processes that occur side by side, this style is great for comparative analysis.
-
S-Shaped Plot Diagram: A variation that curves to represent gradual changes in a process or data set, suitable for illustrating systems that go through phases of slow and rapid progress.
-
Mountain-Shaped Plot Diagram: Emphasizes the rise and fall of data or events, useful for representing cycles, such as sales performance or project progress.
Where These Templates Help Most:
-
Project Management: Plot diagrams are perfect for visualizing project timelines, milestones, and stages of progress, making it easy to track overall development.
-
Business Analysis: Use plot diagrams to represent market trends, sales data, or growth patterns, allowing stakeholders to easily interpret progress.
-
Storytelling & Presentations: Great for presenting story arcs, project plans, or research findings, providing clarity and engagement through visuals.
-
Educational Tools: Teachers can use plot diagrams to explain timelines, events, or data progression in history, science, or mathematics.
-
Data Interpretation: Simplify complex data sets, showing how variables or factors change over time, making analysis easier and more intuitive.
Compatibility:
-
Lucidchart
-
Lucidspark
-
Desktop & Web Access
-
Real-time Collaboration
