Free Pictogram Template
Free Download this Free Pictogram Template Design in Zoom Format. Easily Editable, Printable, Downloadable.
Present data visually and make your message more engaging with the Free Zoom Pictogram Template. This user-friendly template pack includes 4 clean, customizable layouts designed for data storytelling, infographics, comparison visuals, and survey results.
Perfect for marketers, educators, analysts, and presenters, these pictogram templates help you transform raw numbers into clear visuals—all within the Zoom whiteboard workspace.
Simplify Numbers Through Visual Representation
-
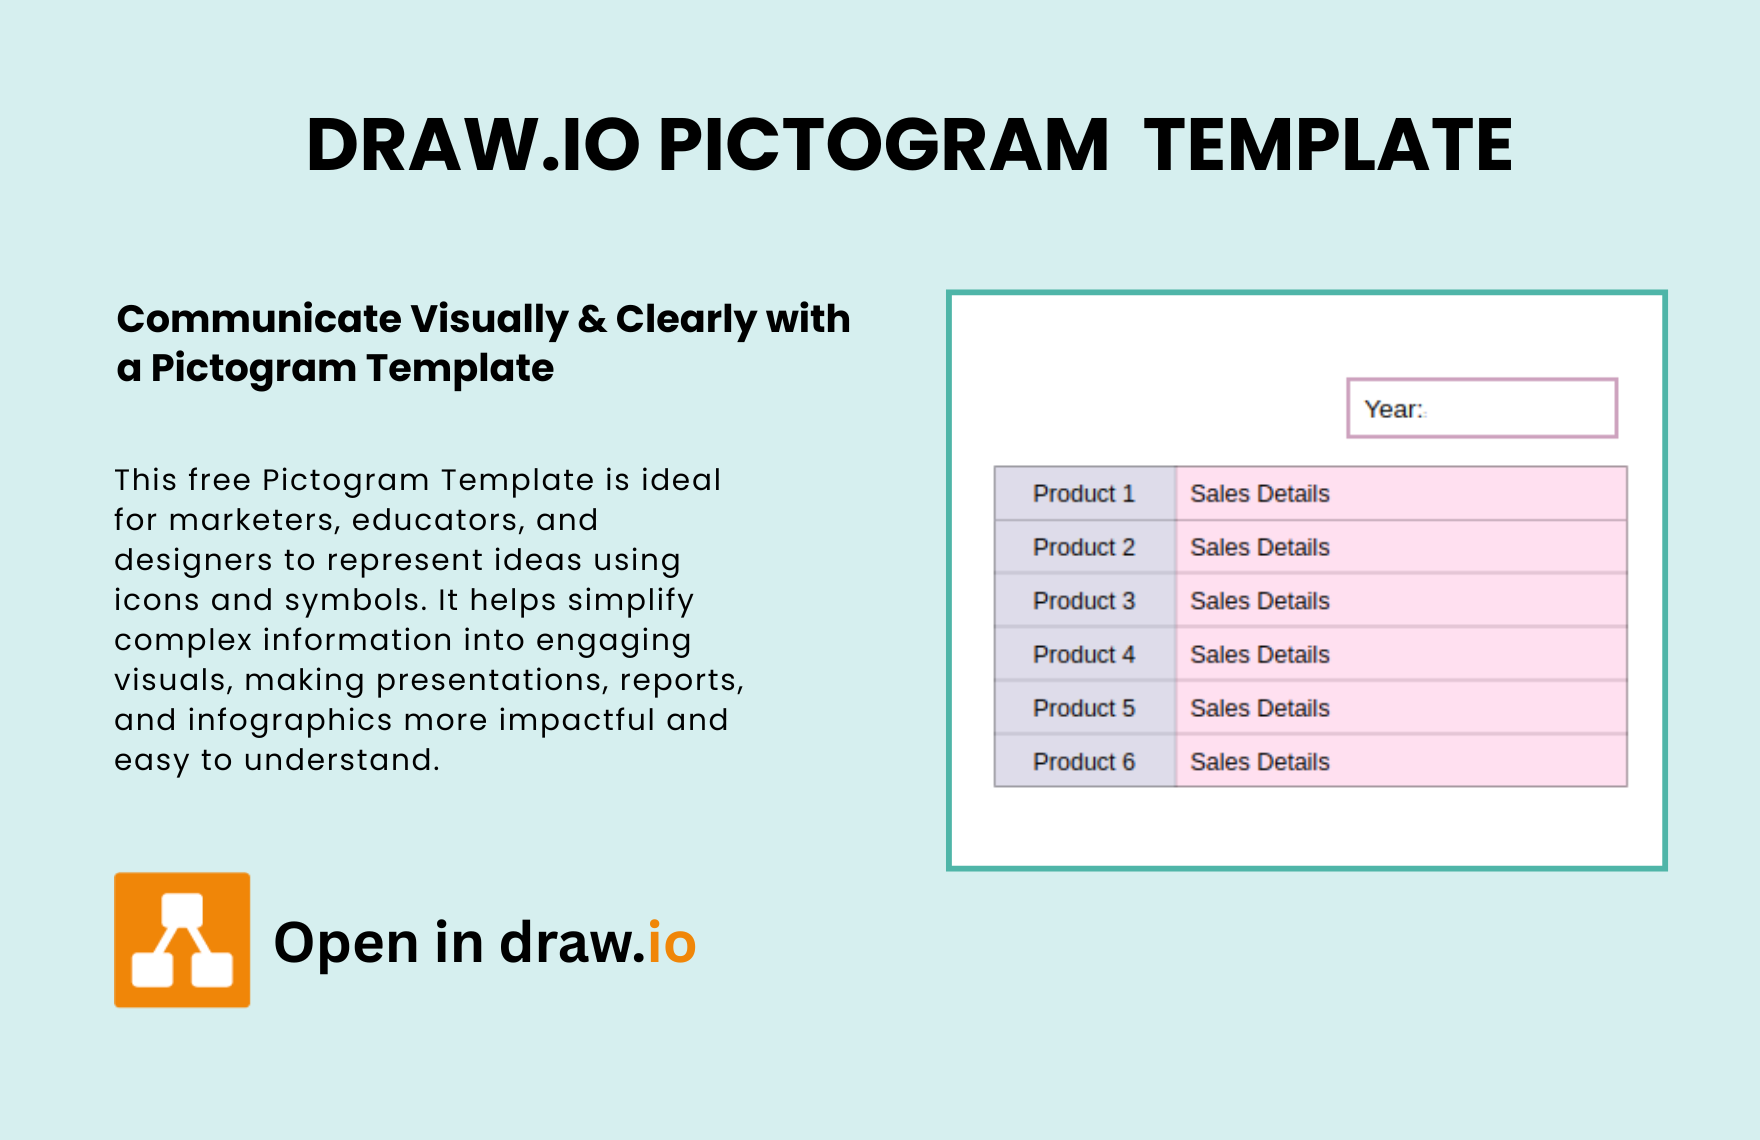
Horizontal Bar Visualization
A classic pictogram layout with stacked horizontal bars, allowing you to compare values using visual repetition—ideal for poll results or segmented data. -
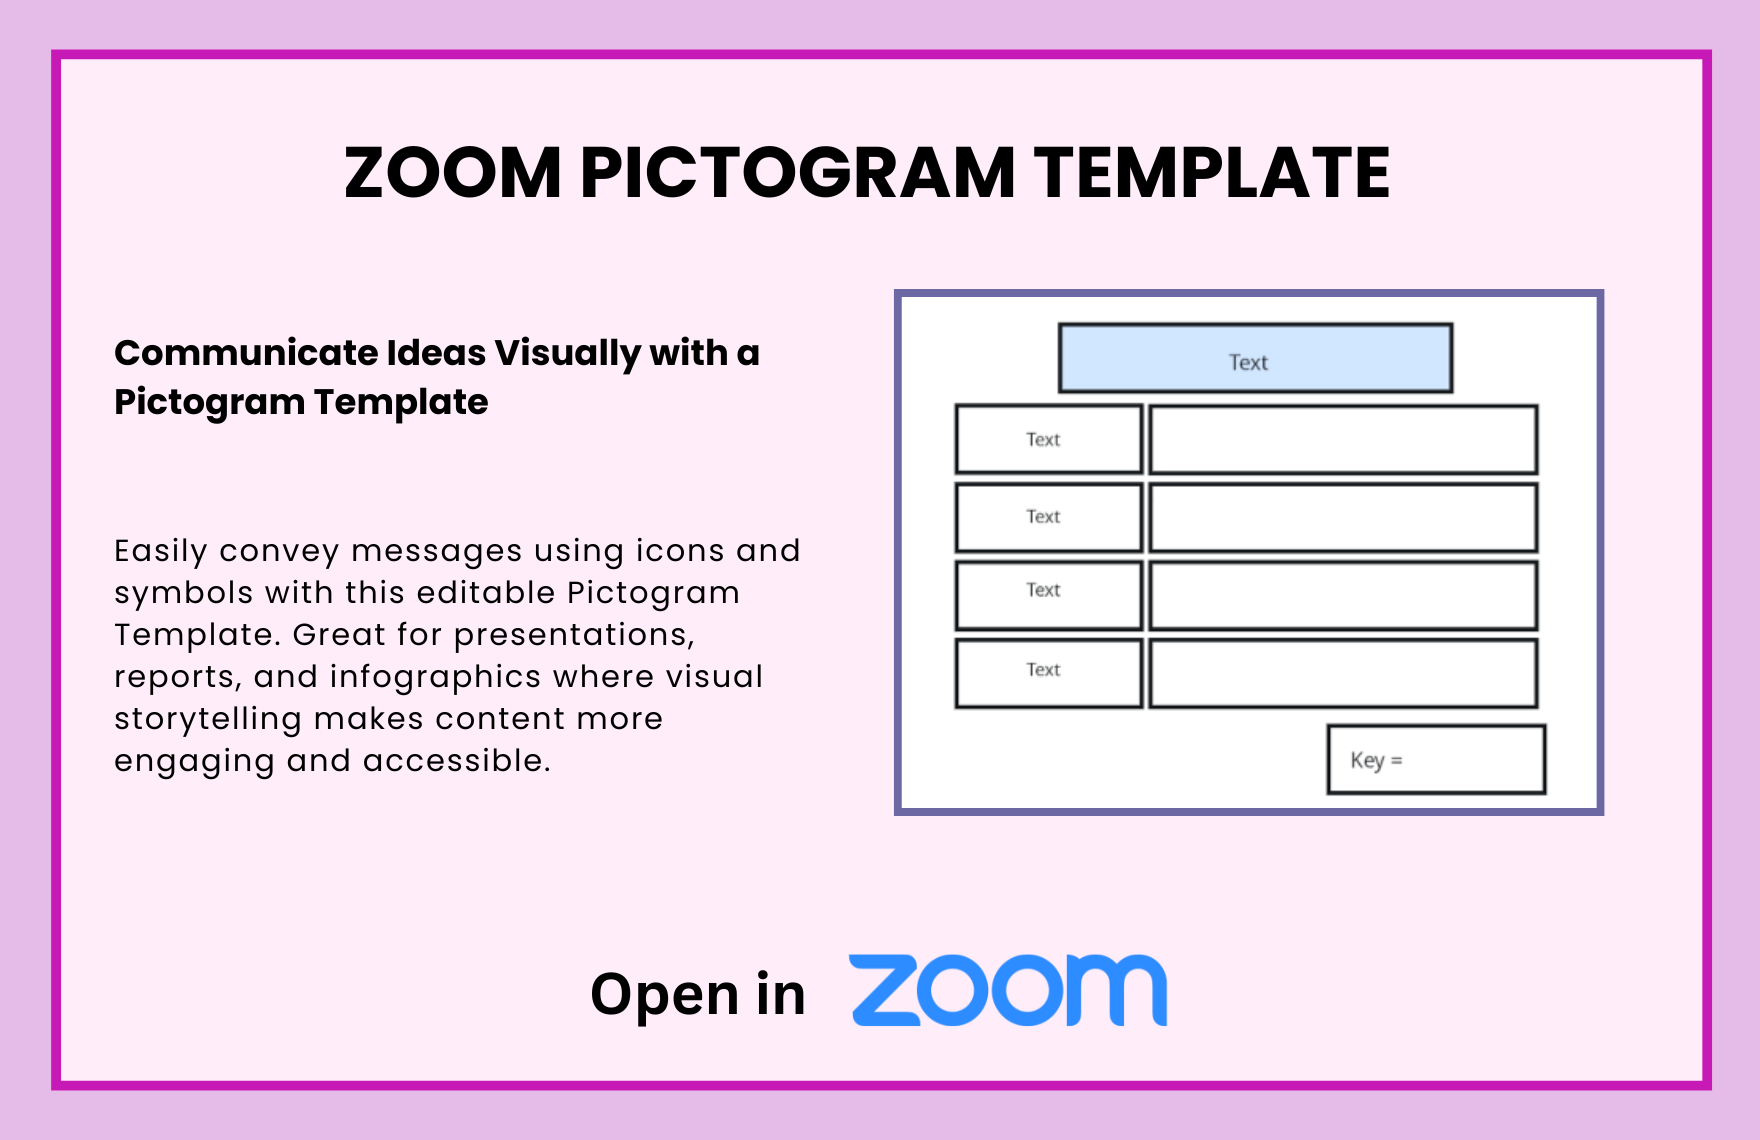
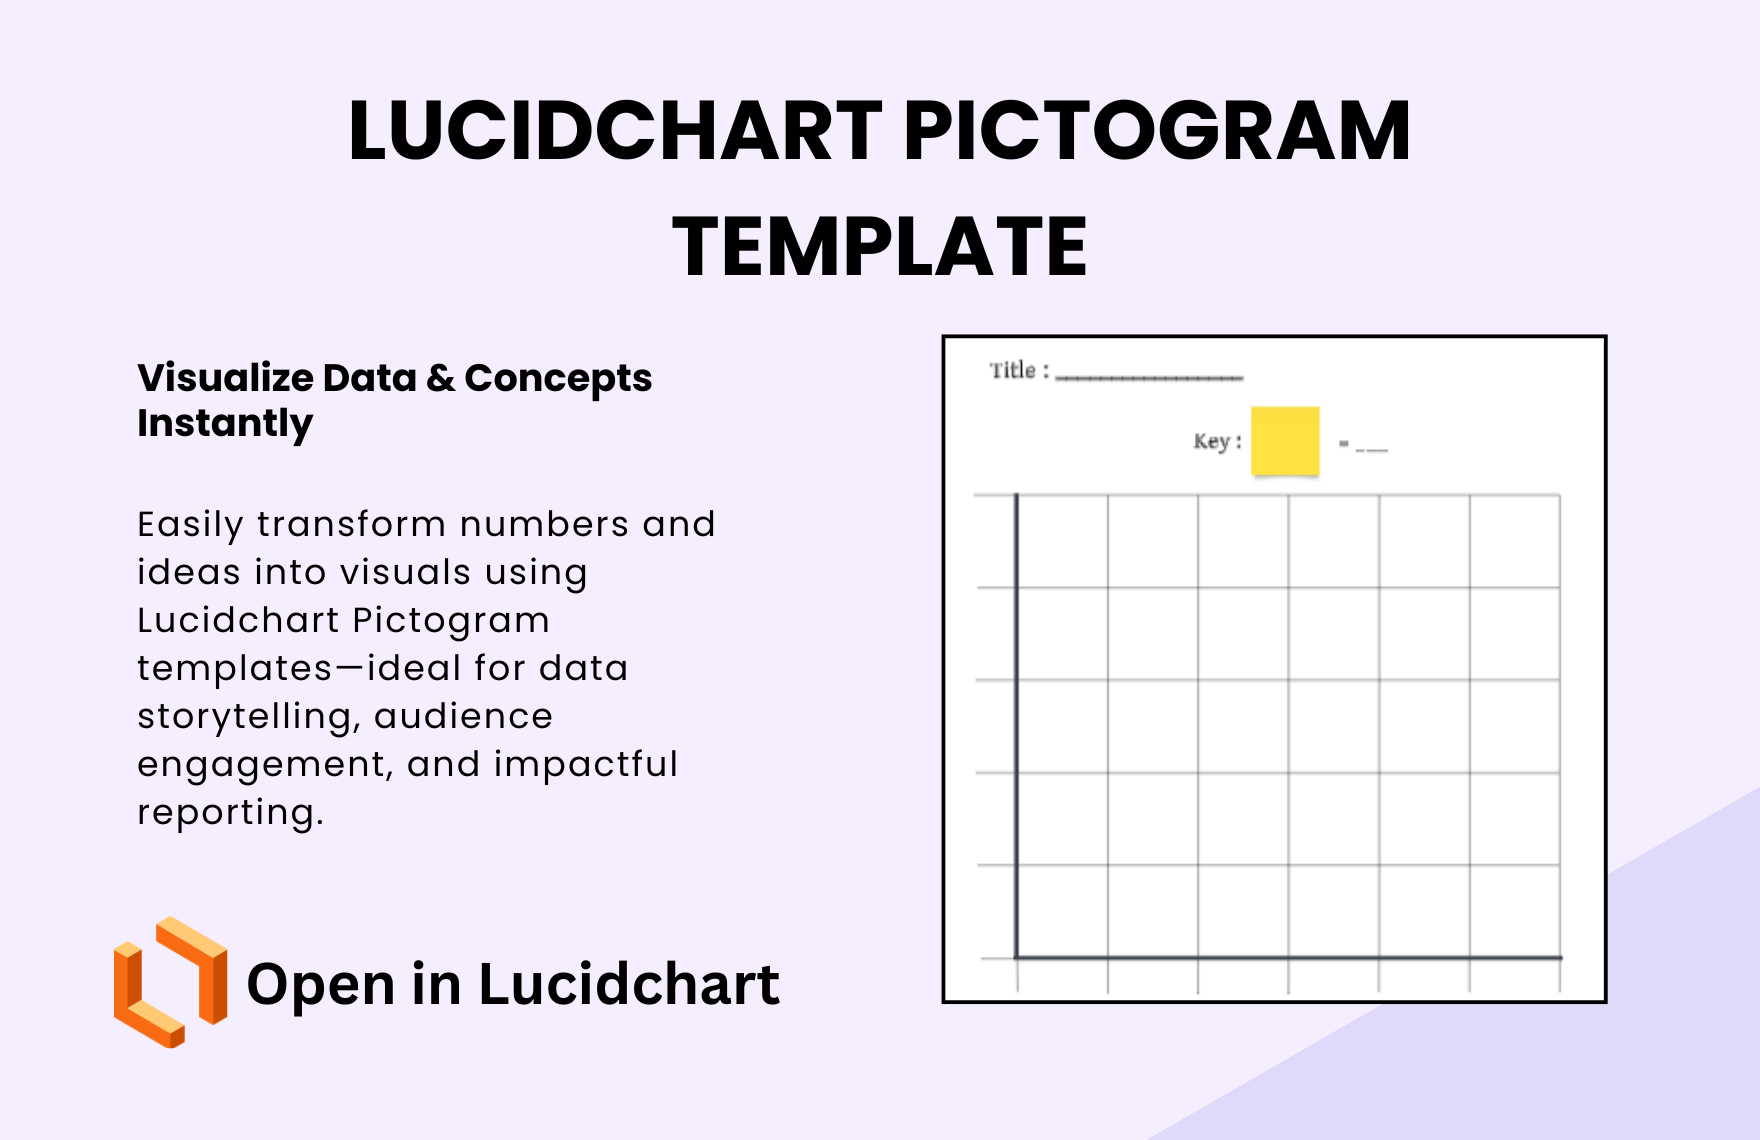
Labeled Box Grid Layout
Features rows of labeled boxes with an optional key to explain color or value—best for showing proportions, categories, or demographic splits. -
Equal Size Icon Table
Organized as a grid with uniform cells for each unit or data point—great for showing quantity-based visualizations like user counts, success rates, or feedback distribution. -
Color-Coded Rank Display
Uses numbered rows with customizable color schemes to visually rank items or options—perfect for survey results or performance highlights.
Key Features of the Template
-
Editable Text & Key Legend – Add your own labels, values, and explanations.
-
Flexible Color Coding – Use colors to represent meaning, emotion, or statistical difference.
-
Drag-and-Drop Customization – Rearrange sections and blocks quickly in Zoom’s whiteboard.
-
Visual Data Interpretation – Replace boring numbers with clean, visual storytelling elements.
-
Client-Ready or Classroom-Ready – Designed for both professional and educational presentations.
Ideal Use Cases
-
Marketing Reports – Display campaign results, customer feedback, or engagement rates.
-
Education & Classrooms – Visualize statistics, demographics, or test scores for better student understanding.
-
Business Dashboards – Present performance metrics, survey outcomes, or team KPIs.
-
Social Media & Infographics – Turn data into shareable, eye-catching content.
-
Client Presentations – Help stakeholders digest data visually and make informed decisions.
Zoom Whiteboard Compatibility
-
Created For: Zoom Whiteboard
-
Accessible On: Web & Desktop
-
Customization Tools: Text, shapes, icons, keys, colors
-
Sharing Support: Collaborate or export during live meetings or sessions
